PROJECT REPORT
Decent Work for Tea Plantation Workers in Assam
Constraints, Challenges and Prospects
Conducted by
Debdulal Saha Chitrasen Bhue Rajdeep Singha
Tata Institute of Social Sciences Guwahati Campus
October 2019
Research Team
Principal Investigator
Dr Debdulal Saha
Core Team
Dr Debdulal Saha Dr Chitrasen Bhue Dr Rajdeep Singha
Research Assistants
Mr Debajit Rajbangshi Mr Syed Parvez Ahmed
Ms Juri Baruah
Enumerators
Ms Majani Das Ms Puspanjali Kalindi
Mr Sourin Deb Mr Partha Paul Ms Ananya Saikia Ms Shatabdi Borpatra Gohain
Mr Prabhat Konwar Mr Oskar Hazarika
Photography
Mr Debajit RajbangshiMs. Ananya Saikia Dr. Debdulal Saha
i
Contents
List of Abbreviations ii
List of Figures iv
List of Tables vi
List of Map, Boxes and Pictures vii
Acknowledgements viii
Executive Summary ix
1. Tea Industry in India: Overview and Context 1
2. Infrastructure in Tea Estates: Health Centre, Childcare, Schools and Connectivity 16
3. State of Labour: Wage and Workplace 34
4. Consumption Expenditure and Income: Inequality and Deficits 55
5. Living against Odds 70
6. Socio-Economic Insecurity and Vulnerability 88
7. Bridging the Gaps: Conclusion and Recommendations 97
Glossary 102
References 103
ii
Abbreviations
AAY Antyodaya Anna Yojna
ABCMS Akhil Bhartiya Cha Mazdoor Sangha ACKS Assam Chah Karmachari Sangha ACMS Assam Chah Mazdoor Sangha APL Above Poverty Line
APLR Assam Plantation Labour Rules ATPA Assam Tea Planters’ Association BCP Bharatiya Cha Parishad
BLF Bought Leaf Factories BMS Bharatiya Mazdoor Sangha BPL Below Poverty Line
CAGR Compound Annual Growth Rates CITU Centre of Indian Trade Unions CSR Corporate Social Responsibility CTC Crush, Tear and Curl (the leaves)
DW Decent Work
ECI Election Commission of India
FEMA Foreign Exchange Management Act, 1999 INTUC Indian National Trade Union Congress ITA Indian Tea Association
LPG Liquefied Petroleum Gas
LT Labour Tea
MCC Model Code of Conduct MI Monthly Household Income MMR Mixed Methods Research
MPCE Monthly Per Capita Consumption Expenditure MPI Monthly Per capita Income
NETA North Eastern Tea Association NFSA National Food Security Act, 2013
NREGA National Rural Employment Guarantee Act NRHM National Rural Health Mission
NSSO National Sample Survey Office OLS Ordinary Lease Square
ONGC Oil and Natural Gas Corporation Limited PCA Principal Component Analysis
iii PDS Public Distribution System
PF Provident Fund
PLA The Plantation Labour Act (1951) RSBY Rashtriya Swasthya Bima Yojna SD Standard Deviation
SDGs Sustainable Development Goals
SPSS Statistical Package for the Social Sciences SSA Sarba Shikshya Abhijyan
STATA Statistics and Data STG Small Tea Growers TAI Tea Association of India TBI Tea Board Of India TRA Tea Research Association
iv
List of Figures
Figure 1.1. Share of Assam Tea of Total Production of Indian Tea 1 Figure 1.2. Growth Rate (percent) of Assam and Indian Tea during 2007–19 2
Figure 1.3. Growth Rate of Export of Indian Tea 3
Figure 1.4. Rate of Change in Auction Price in India during 2007–18 4 Figure 1.5. Share of Tea Sold through Auction and Outside 4
Figure 1.6. Employment Structure in Tea Industry 6
Figure 2.1. Types of Ownership of the Estates 17
Figure 2.2. Types of Planters’ Associations 17
Figure 2.3. Number of Primary Schools in Estate 20
Figure 2.4. Mid-day Meal Facility at the Primary Schools 20
Figure 2.5. School Bus Facility Provided by the Estate 21
Figure 2.6. Crèche Facility in the Estate 22
Figure 2.7. Availability of Food in Crèche 22
Figure 2.8. Health Centre Provided by Estate 24
Figure 2.9. Approach Road between Labour Colony and Health Centres 26
Figure 2.10. Availability of Medicine in the Health Centre 26
Figure 2.11. Free Medicine available in the Estate 26
Figure 2.12. Ambulance Facility and its Availability 27
Figure 2.13. Estates with Factory 28
Figure 2.14. Presence of Trade Union 30
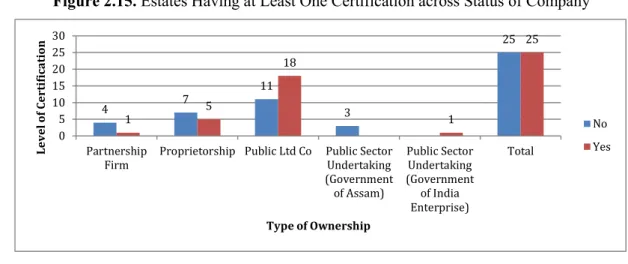
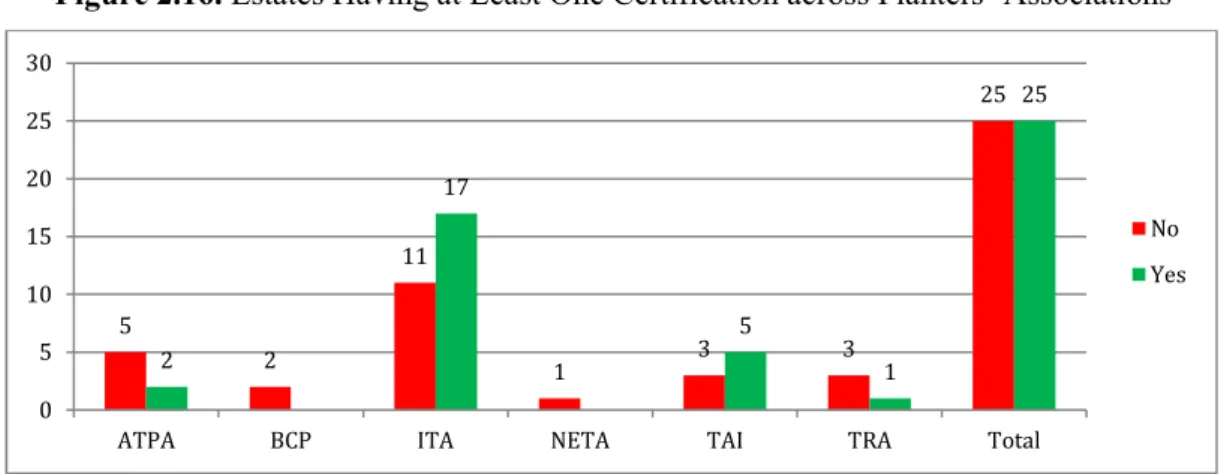
Figure 2.15. Estates Having at Least One Certification across Status of Company 31 Figure 2.16. Estates Having at Least One Certification across Planters’ Associations 32 Figure 3.1. Share of Permanent and Temporary Workers across Districts 34
Figure 3.2. Gender Distribution across Districts 35
Figure 3.3. Types of Workers across Gender 35
Figure 3.4. Educational Qualification across Share of Gender Composition 36
Figure 3.5. Types of Workers and their Qualifications 36
Figure 3.6. Gender Distribution across Work Sites 37
Figure 3.7. Age Distribution 37
Figure 3.8. Age Distribution across Gender 38
Figure 3.9. Age Distribution across Permanent and Temporary Workers 38
Figure 3.10. Pay Slip 42
Figure 3.11. Different Levels of Daily Wage Rate across Workers 43 Figure 3.12. Different Levels of Daily Wage Rate across Gender 43
Figure 3.13. Ration Provided by the Estate 44
Figure 3.14. Electricity Bill deducted by the Estate from Wage Payment 45
v
Figure 3.15. Cost of Water Deducted by the Estate from Wage Payment 45 Figure 3.16. Deduction of Provident Fund from the Wage/Salary 46
Figure 3.17. Firewood Provided by Estate across Districts 47
Figure 3.18. Firewood Provided by Estates across Different Types of Company 48
Figure 3.19. Bonus 49
Figure 3.20. Items Purchased from Bonus Amount 49
Figure 3.21. Distribution of Cash-in-Hand (Income) 50
Figure 3.22. Distribution of Cash-in-Hand (Income) across Gender 50 Figure 3.23. Distribution of Cash-in-Hand (Income) across type of workers 51 Figure 3.24. Distribution of Cash-in-Hand (Income) across Types of Workers at Work 51
Figure 3.25. Monthly Wage Gap 52
Figure 3.26. Wage Gap Distribution across Gender 53
Figure 3.27. Distribution of Wage Gap across Type of Workers 54
Figure 4.1. Household Size 55
Figure 4.2. Distribution of Ration Card 56
Figure 4.3. Household Monthly Per Capita Consumption Expenditure 57
Figure 4.4. MPCE across Gender 57
Figure 4.5. MPCE across Type of Workers 57
Figure 4.6. Share of Different Items in Total MCE 59
Figure 4.7. Food Item Consumption across Gender 59
Figure 4.8. Monthly per Capital Income Distribution 60
Figure 4.9. Monthly per Capital Income across Gender 61
Figure 4.10. Monthly per Capital Income across Types of Worker 61 Figure 4.11. Monthly per Capital Income across Types of Ownership 61
Figure 4.12. Household Income–Expenditure Gap 62
Figure 4.13. Income Inequality at the Household Level 64
Figure 4.14. Inequality Decomposition of Household Income across Status of Company 65
Figure 4.15. Distribution of Calories Intake 67
Figure 4.16. Share of Different Items in per Capita Kcal 68
Figure 4.17. Distribution of per capita per day kcal Gap 68
Figure 5.1. Punishment If Late at the Workplace 71
Figure 6.1. Socio-Economic Intensity Score 93
Figure 6.2. Composite Socio-Economic Intensity Score 93
Figure 6.3. The distribution of monthly per-capita income after out-of-pocket expenses 94
Figure 6.4. Scree Plot Eigen Values 95
Figure 7.1. Poverty Trap and Its Impact 101
vi
List of Tables
Table 1.1. Production Break-up for Big Estates and Small Growers 3
Table 1.2. Incidents of Management-Labour Tussles 8
Table 1.3. Selection of Districts and Tea Estates 13
Table 2.1. Distance of Tea Estate from Basic Facilities 18
Table 2.2. Share of Estate Having Different Community Services 33 Table 2.3. Share of Trade Union Having Different Community Services 33 Table 2.4. Share of Estates having Different Community Services across Certified
Tea Estates 33
Table 3.1. Industry’s Calculation on Daily Wage 41
Table 3.2. Actual Daily Wage based on Pay Slip 41
Table 3.3. Descriptive Statistics of Monetary Components of Wage 42
Table 3.4. Regional Disparity in Wage 52
Table 4.1a. No. of Earners in Households having Income–Consumption Gap 62 Table 4.1b. No. of Earners in Households having Income-Consumption Gap 63
Table 4.2. Result of OLS Model of Income–Expenditure Gap 64
Table 4.3. Income Inequality Decomposition at Household Level 65
Table 4.4. Food Items across Unit and Calories 66
Table 4.5. Daily Per Capita Calorie Intake across India (in Kcal) 66
Table 5.1. Occupational Health Hazards 74-75
Table 6.1. Identification of Indicators of Socio-economic Securities 90
Table 6.2. Steps of Calculating Index 91
Table 6.3. Intensity of Different Socio-Economic Indicators (Negative Scale) 92 Table 6.4. Consumption Security and its relation to Socio-Economic Insecurity 95
Table 6.5. Factor Loading with Four Principal Components 96
Table 7.2. Monthly Wage Gap and Share of Workers 100
Table 7.3. Monthly Income-Expenditure Gap and Share of Workers 100
vii
List of Map, Boxes and Pictures
Map 1.1. Selected Tea Estates across 9 Districts of Assam in Study 12
Box 2.1. Status of Basic Indicators of Selected Estates Box 5.1. Workers' Conditions and Survival Strategy: Case of
Estate-36, Golaghat
Picture 1.1. Group Interview Conducted in Estate-10, Dibrugarh 14 Picture 2.1. Child making an attempt to write alphabets and numbers
in Estate-22 (Tinsukia) 19
Picture 2.2. Conditions of Crèche in Estate-7, Dibrugarh 22
Picture 2.3. Abandoned Hospital in Estate-36 (Golaghat) 24
Picture 2.4. Abandoned Hospital in Estate-36 (Golaghat) 24
Picture 2.5. Approach Road to Labour Colony in Estate-44 (Cachar) 25
Picture 3.1. Pay Slip in Estate 48 (Udalguri) 40
Picture 3.2. Pay Slip in Estate 9 (Dibrugah) 40
Picture 3.3. Pay Slip in Estate-6 (Dibrugah) 40
Picture 3.4. Firewood Collection 48
Picture 5.1. Pesticide Sprayer without any safety equipment in Estate-41 (Sonitpur) 74 Picture 5.2. Pesticide Sprayers without any safety equipment in Estate-31 (Sivasagar) 74
Picture 5.3. Women going to work 77
Picture 5.4. Broken House of Permanent Worker (Estate-2, Dibrugarh) 80 Picture 5.5. House of permanent workers (Estate-10, Dibrugarh) 80 Picture 5.6. Kutcha House of a permanent worker in Estate-47 (Cachar) 80 Picture 5.7. Housing Conditions of a permanent worker in Estate-39 (Golaghat) 80 Picture 5.8. Toilet of a permanent worker’s house (Estate-8, Dibrugarh) 81 Picture 5.9. Inside the Kutcha Toilet of a permanent worker (Estate-20, Tinsukia) 81 Picture 5.10. Source of drinking water (Estate-20, Tinsukia) 82
Picture 5.11. Drainage system in Estate-12 (Dibrugarh) 82
viii
Acknowledgements
This report marks the culmination of the effort, help and support of various individuals and organizations, without which it would have been very difficult to complete this study within the stipulated time. Fieldwork has been the most important part of this research project and thus we are grateful to various key persons without whom it would have been impossible to access the vital informants. We are thankful to Stephen Ekka, Wilfred Topno, Anil Kujur, David Lakra, Mridula Kalita, Nila Nagbangshi, Nabin Nag, Gopal Bhomich, and Dhanjit Baishya for their help at every stage in accessing estates and respondents.
We thank the Tea Board of India, Rainforest Alliance, Fairtrade Foundation, IDH-the sustainable trade initiative and Trustea. Special thanks to the following organizations for introducing us to the labour and their family. These are: All Assam Students Union (AASU), All Assam Tea Student Association (AATSA), Assam Chah Mazdoor Sangha (ACMS), Centre of Indian Trade Unions (CITU), PAJHRA, Tezpur, Sonitpur, and People’s Action for Development, Purbabharati Educational Trust, Chah Mukti Sangram Samiti, and Satra Mukti Sangram Samiti. Without their support, our interaction with the labour would have not been so illuminating and enlightening.
When I began this research project, we had realized that we would need a team to accomplish this ambitious project covering 50 tea estates from nine major tea-producing districts of Assam (India) within a stipulated time. I am indebted to my colleagues Dr. Rajdeep Singha and Dr. Chitrasen Bhue who not only came on board but formed an exciting research team and offered support throughout this project. On behalf of the team, I would like to thank our energetic research assistants Syed Parvez Ahmed, Debajit Rajbangshi and Juri Baruah for tirelessly and efficiently conducting the fieldwork along with the enumerators. This report has been commissioned by Oxfam Germany and been supported by Oxfam Germany (ODE) and the German Federal Ministry for Economic Cooperation (BMZ). We thank ODE and BMZ. We also acknowledge the support of Oxfam India (OIN) for technical advice and coordination support.
Workers who participated in this study were patient, tolerant and provided vital information on an exhaustive list of their consumption, income and information related to their work despite their hectic schedule. Even after our fieldwork, our research assistants constantly called them for any doubts, clarification and to cross-check information. We shall always be obliged to each one of them for their cooperation, support and for their wonderful hospitality during our visits to their house.
Our sincere apology to all the people, whose names we have not mentioned, but their efforts are nevertheless close to our hearts. We would express regret over any mistake that have been made unintentionally in the report and we take responsibility for the final product and all its shortcomings.
Debdulal Saha October, 2019
ix
Executive Summary
The study examines work and employment conditions of tea plantation workers of Assam (India) in present times. Statistical inferences and narratives show that there is ‘decent work deficit’ among the tea plantation workers in Assam. Using the combination of quantitative and qualitative methods, the study depicts decent work conditions of 510 plantation workers across 50 tea estates from 9 major tea- producing districts of Assam, emphasizing on employment opportunities, rights at work, social protection and social dialogue.
Though the quantity of the country’s total tea production including that of Assam has been increasing since 2011, the auction price per kilogram of tea is declining in the same period. This can be stated as a crisis situation. Tea is a labour-intensive commodity and labour is one of the main factors of production besides land and capital. The tea industry employs around 1.2 million permanent workers who usually reside within the plantation, making the industry the largest employer in the formal private sector. The Plantation Labour Act (1951) and other related Acts have made it mandatory for the plantation management to provide workers with housing, education, health and childcare facilities besides minimum wage, bonuses, rations, provident funds. The study highlights that workers in tea plantations suffer from work controls at multiple levels; wage cut mechanisms; deplorable housing and living conditions; calorie intake deficits; and work-related securities including economic, social, representative, and non-availability of basic facilities at the workplace.
The key results of the study depict:
Poor infrastructure of primary schools with a student–teacher ratio of 1:75.
70 percent health centres in the estates have bare minimum services which include a bed, saline, a staff, and medicines for fever or cold.
54 percent tea estates provide crèche facility which is generally located far away from the workplace; they lack basic facilities including proper meals, owing to which women avoid sending their children. During regular sickness of children, women lose a working day and wages.
52 percent workers do not receive pay slips.
95 percent women wage workers use firewood and suffer directly from indoor pollution.
75 percent workers suffer from monthly wage gap between what they are supposed to and what they actually receive after written and unwritten deductions.
38 percent workers’ household monthly expenses exceed their income.
45 percent worker’s bonus amount is spent towards house repairing and medical expenses.
32 percent of the total food consumption is spent on rice and wheat, apart from the amount of ration that a worker receives from the estate.
56 percent of the household’s per day per capita calorie gap is between -2000 Kcal to 0 Kcal.
19 percent of workers spend their wages towards repairing houses, obtaining firewood, children’s education and healthcare.
Occupational health and economic security including wages are regarded as the 2 principal components under work-related securities through statistical analysis. With proper right based entitlements such as weekly paid holiday (Sunday) and proper implementation of non-cash benefits as per the agreement, wage gap of 95 percent can be reduced and 33 percent (one-third) of the households can overcome the income–consumption gap.
1
1
Tea Industry in India: Overview and Context
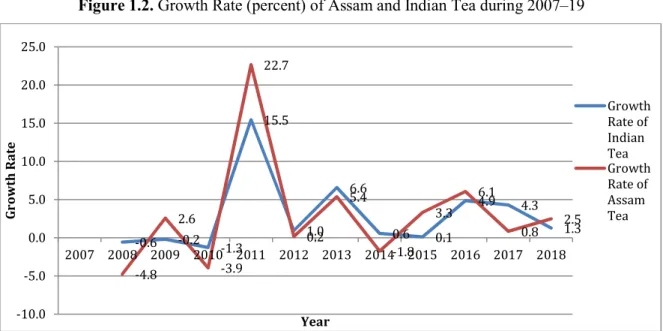
The tea industry in India is about 180 years old. Robert Bruce discovered tea plants growing in upper Brahmaputra Valley in 1823 and Indian tea from Assam was sent to UK for sale for the first time in 1838. Owing to specific soil and climatic advantages, tea is traditionally grown mainly in four states in India, namely, Assam and West Bengal in the East and Northeast India and Kerala and Tamil Nadu in South India. Assam is the largest tea-growing area, and it steadily produces over 50 percent of the country’s tea (see Figure 1.1), followed by West Bengal accounting for 17 percent of the total quantum. The growth rate of tea production in Assam has gone up to 15.5 percent while that of Assam’s tea production has been 22.7 percent in 2011–12 (see Figure 1.2). Over the last two decades, this industry has witnessed dramatic changes, particularly, in terms of land utilization, production, consumption and price mechanisms.
The tea industry employs around 1.2 million permanent workers, thereby being the largest employer in the formal private sector. Although the Plantation Labour Act (1951) and other Acts make it mandatory for the plantation management to provide workers with various economic and social welfare benefits, several studies illustrate that workers have been subjected to exploitative work patterns, control mechanisms, low wage payments, deplorable housing and living conditions, inadequate supply of drinking water, poor levels of welfare benefits and lack of collective bargaining (Bhowmik 1981; Bhowmik et al. 1996; Xaxa 1985; Guha 2012). The workers not only suffer on account of eviction but also face difficulty to search for alternative sources of employment.
Since 2000, the consumption of tea in India in the domestic market has increased at a faster rate compared to its production. The ‘crisis’ in the tea industry has been paradoxically triggered by the decline of its exports and not a shrinkage of its production, price or sale in the domestic market. The contributing factors towards such a situation are stiffer competition in the domestic and global market;
inadequate investment (Sarma et al. 2012); the closure of tea gardens and the low quality of tea produced in the international market. In addition, there has been increasing unrest amongst the labourers culminating into violent protests against inadequate wage payment, poor social infrastructure, insufficient entitlements and decline in living standards and human security in the tea estates (ibid). In Assam, many such manifestations have resulted further degradation of relations between employers and labourers. Against this backdrop, this study discusses the labour relations within the framework of ‘decent work’, emphasizing on the restructuring of socio-economic entitlements.
Figure 1.1. Share of Assam Tea of Total Production of Indian Tea
Source: Compiled from Tea Board of India
51.9
49.7 51.1
49.7 52.8
52.4 51.8
50.6
52.2 52.8
51.1 51.7
48.0 49.0 50.0 51.0 52.0 53.0 54.0
2007 2008 2009 2010 2011 2012 2013 2014 2015 2016 2017 2018
% Share
Year
2
Figure 1.2. Growth Rate (percent) of Assam and Indian Tea during 2007–19
Source: Compiled from Tea Board of India
Tea Production in India and its Transitions Challenges in the Export Market
Tea was one of the important export commodities for India. Till 1970s, UK was the major buyer of Indian tea. From the early1980s till 1991, Russia (then USSR) used to buy more than 50 percent of the total volume of Indian tea and became its largest buyer (GOI 2019). With the disintegration of the USSR and the abolition of the Central Buying Mechanism, Indian tea exports suffered since 1992/93 but recovered in 1993 under the Rupee Debt Repayment Route and a long-term agreement between Russia and India (ibid). However, since 2001 owing to change in consumption pattern in the global market the tea industry has fallen into another crisis. Though the Russian market still prefers Orthodox over CTC tea, green and organic teas have also become popular worldwide. Countries like China, Sri Lanka, Indonesia, Vietnam and Kenya are producing tea at a much lower price (ibid).
While China produces green tea, Sri Lanka and Indonesia have focused more on orthodox varieties of tea and Kenya has started producing CTC tea. As there is not much demand for domestic consumption of tea in Sri Lanka and Kenya, they export significant volume of teas directly to the international markets (ibid). In India, however, tea is an essential beverage item and over 80 percent of the total tea produced in India is consumed by the domestic market (Tea Board of India, 2018). Further, the industry believes that due to strict implementation of the Foreign Exchange Management Act, 1999 (FEMA), most of the sterling companies of UK, have started getting tea in Kenya which makes Kenya the largest supplier of tea to UK. Apart from stiff competition from Sri Lanka, Kenya, China, Indonesia and Vietnam, inadequate investment and production of better quality tea in international markets account for the poor performance of Indian tea in the global market (ibid). Looking at the export growth rate, it has taken a sharp increase from 2016 (see Figure 1.3).
-0.6 -0.2 -1.3 15.5
1.0 6.6
0.6 0.1
4.9 4.3 1.3
-4.8 2.6
-3.9 22.7
0.2 5.4
-1.8 3.3
6.1
0.8 2.5
-10.0 -5.0 0.0 5.0 10.0 15.0 20.0 25.0
2007 2008 2009 2010 2011 2012 2013 2014 2015 2016 2017 2018
Growth Rate
Year
Growth Rate of Indian TeaGrowth Rate of Assam Tea
3
Figure 1.3. Growth Rate of Export of Indian Tea
Source: Compiled from Tea Board of India
Growth of Low-Cost Production Model
The total production, consumption and price of tea in the national market have been increasing since 2011–12. The main reason is the growth of self-employed tea cultivators, namely, small tea growers (STGs) who cultivate their own land either using family labour or employing wage labour. Tea produced by STGs is manufactured either by factory of the estate or by bought leaf factories (BLFs).
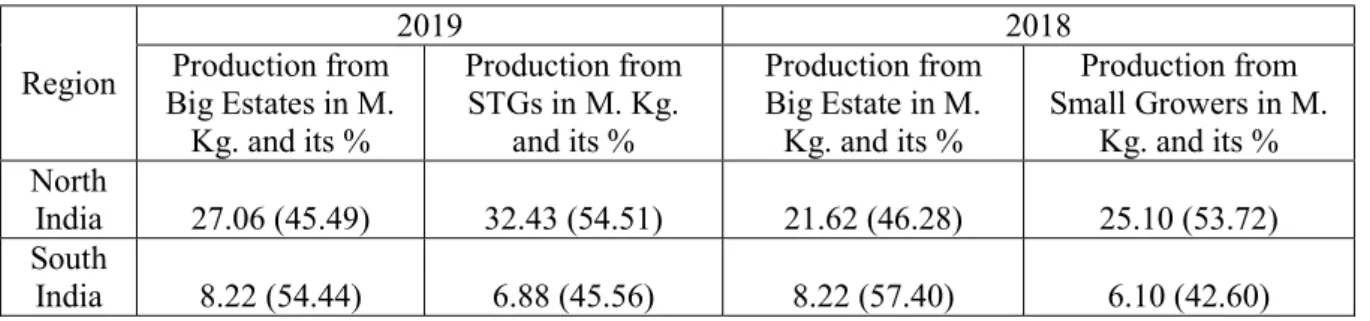
Thus independent factories have grown across tea-producing states. This has led tea to grow to a great extent in Karnataka, Tripura, Himachal Pradesh, Uttaranchal, Arunachal Pradesh, Manipur, Sikkim, Nagaland, Meghalaya, Mizoram, Bihar and Orissa; and brought in a change in the landscape of tea production. Data shows that over 50 percent of tea production are made by STGs in 2018 (see Table 1.1). According to Tea Board of India (2018), around 25 percent of green leaves produced by STGs are purchased by tea estates to meet their daily capacity. Most of the selected estates in the study have separate machines to process CTC (crush, tear, curl) tea, purchased from the STGs which are mostly for the domestic markets.
Table 1.1. Production Break-up for Big Estates and Small Growers
Region
2019 2018
Production from Big Estates in M.
Kg. and its %
Production from STGs in M. Kg.
and its %
Production from Big Estate in M.
Kg. and its %
Production from Small Growers in M.
Kg. and its % North
India 27.06 (45.49) 32.43 (54.51) 21.62 (46.28) 25.10 (53.72) South
India 8.22 (54.44) 6.88 (45.56) 8.22 (57.40) 6.10 (42.60) Source: Tea Board of India 2018, 2019
Stagnant Price and Auction Markets
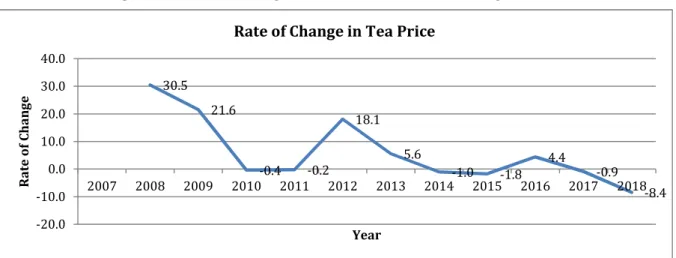
Despite steady rise in production, the price of tea has become capped beyond a certain point. The rate of change in average auction price of tea has been declining since 2007 (see Figure 1.4). Interaction with auction market officials has revealed that most of the good quality tea does not enter the auction market; therefore, price setting at the auction market has been low. Assam tea, however, has been selling tea at Rs 75,000 per kg (The Indian Express 2019). The quantity sold for such price is negligible.
13.6
-2.6 12.2
-3.0 -3.3 5.2
-5.3 10.2
-2.7 13.2
32.9
-10.0 -5.0 0.0 5.0 10.0 15.0 20.0 25.0 30.0 35.0
2007 2008 2009 2010 2011 2012 2013 2014 2015 2016 2017 2018
Growth Rate of Export
Year
4
The low price on tea from the auction market is one of the reasons for the stagnancy of the tea industry. However, if we look at the share of tea sold, it is increasingly being done through direct retail market. In 2011–12, when 1 billion kg of tea had been produced, about only 35 percent was being sold through the auction market (see Figure 1.5). Price that is set in the auction market is easily available but that prevailing during direct selling is difficult to gauge. Interaction with traders and retailers reveals that the price of tea through direct selling mechanism is a way higher than that through the auction market. The difference is a minimum of Rs 8–10 per kg. This is certainly a motivation for the industry towards opting for direct sale in the retail market.
Figure 1.4. Rate of Change in Auction Price in India during 2007–18
Source: Compiled from Tea Board of India
Figure 1.5. Share of Tea Sold through Auction and Outside
Source: Compiled from Tea Auction Market
Activities and Employment Structure in the Tea Industry Activities in Garden
Production process of making tea is much organised and time and motion each activity are followed rigidly to efficiently produce tea. Tea plantation is an agro-based industry where the production process takes place both at the garden and factory. Planting trees, managing land and production of green leaves which includes pruning, spraying pesticides, plucking, cleaning, and digging are the main activities at the garden. Women are mainly trained in plucking leaves.
30.5 21.6
-0.4 -0.2
18.1 5.6
-1.0 -1.8
4.4 -0.9 -8.4 -20.0
-10.0 0.0 10.0 20.0 30.0 40.0
2007 2008 2009 2010 2011 2012 2013 2014 2015 2016 2017 2018
Rate of Change
Year
Rate of Change in Tea Price
52 54 51 53
35
44 43 43 45
40 45 44 48 46 49 47
65
56 57 57 55 60
55 56
0 10 20 30 40 50 60 70
2007 2008 2009 2010 2011 2012 2013 2014 2015 2016 2017 2018
% Share of Tea Sold through Auction
% Share of Tea Sold in Outside Auction
5 Methods of Processing Tea at the Factory
There are mainly two broad ways of processing tea in India—crush, tear, curl (CTC) and orthodox methods. The CTC method refers to the process where tea leaves are run through a series of cylindrical rollers. Orthodox, on the other hand, refers to a method where tea is either hand-rolled or done with machinery. Notably, not all estates are specialized in the orthodox method of processing tea. Cost of production for producing tea by following orthodox methods (often called orthodox tea) is higher than tea produced using CTC methods (called CTC tea). Labour process depends on the tea processing method. The orthodox method requires more physical strength while the CTC is more machine dependent.
There are two divisions in the factory, namely, the high risk and low risk zone. Heavy machines are kept in the high risk zone; fermentation and packaging units are considered to be part of the low risk zone inside the factory. Men are mostly seen working in the high risk zone where work is done with the help of machines. The following broad six steps are involved in processing tea.
Withering
Soon after plucking the green leaves, they are brought at the factory. Once the leaves are received at the factory, they are weighed and sorted, and spread on troughs. Withering is a process where conditioned air is circulated between the leaves, initially to remove surface moisture. Both male and female workers are involved in weighing, sorting and spreading.
Rolling
In the rolling process, the leaf is twisted and the damp tea leaves are then rolled into wrinkled strips.
The rolling machines have deep jacket, a pressure cap to apply pressure on the leaf, and the table itself has battens and a cone at the centre to twist the leaf. Mostly, male workers are involved in this activity. Rolling falls under high risk zone, and therefore, males are predominant in this section.
Fermentation
Fermentation, mainly for CTC, is the oxidization process of the enzymes in the juices, which brings out the flavour, strength and colour of the liquors and infusions. As fermentation progresses, there is a colour change of the leaf from greenish to coppery brown. The degree of fermentation is judged by the colour and aroma.
Drying
The primary objective of drying is the extraction of moisture and the prevention of fermentation. The fermented leaf is passed through driers, which have circuits of trays with perforation. The drying process takes place in very high temperature (50OC to105OC). This process is considered to be extremely exhaustive and tiring, and is considered as a high risk unit. Male workers are the primary workers in this unit.
Grading
The fired tea after cooling is graded/sifted according to size and shape, as the trade demands, and stored in airtight bins. The sifting is carried out on a series of grading and cleaning machines, which have several trays of different mesh sizes. This facilitates the separation of tea particles—the stalk from fiber—into the various grades of tea. Grading unit falls under high risk zone and male workers are involved in this activity.
6 Packing and Dispatching
Being hygroscopic, tea is either packed in plywood tea chests made of multi-walled craft paper and dispatched to the auctions, or into tea packs of various forms for direct export/distribution. While female workers are seen in packaging, male workers are found in dispatching as the latter involves lifting weight. This unit is under low risk zone.
Employment Structure
The employment structure of the tea industry is pyramidal where authorities like the manager, deputy and assistant managers occupy the pivot, and labour, permanent and temporary, constitutes the bottom, and make up the largest quantum who earn on a daily wage rate. Over 90 percent of the workers including permanent and temporary workers occupy the bottom of the pyramid (Saha et. al.
2019). Permanent workers across all the sections can either be salaried employees or daily wage earners. However, temporary workers are always hired on daily wages and mostly during peak season (see Figure 1.6). Employees are mainly on the payroll and are salaried persons.
Most of the workforce is involved in the garden. As far as composition of workers is concerned, while men are predominantly involved in the factory, women are the primary workers in the garden.
However, the sardars (garden supervisors) at different levels are men. Sardars assign work to the labour, supervizes it and manages time. There are two types of sardars—one, popularly known as chhotasardar, who directly monitors work at the plot level and is mainly assigned on daily wages;
two, the badasardar, who oversees the work of a particular area. Sardars carry a pencil to show the exact size of leaves to be plucked. The mohori, who assists the field manager to weigh the leaves, remains in the garden and receives a monthly salary. The line chowkidar looks after the labour lines and checks whether workers are in the house or in the garden. This is a surveillance mechanism that workers face; hence, one can argue that chowkidar is a personification of the authority.
If we see the composition of workers, the primary workforce is categorized under Group D at the unskilled level. This category is divided into two groups based on the mode of payment—daily wage workers and monthly salaried employees. The payment is based on the nature of work involvement both in factory and garden. Details of the payment system are discussed in the section on economic benefit section. Notably, mode of payment is associated with dignity and power. Most of the salaried workers, both in the garden and factory, are men.
Figure 1.6. Employment Structure in Tea Industry
Source: Developed by researcher
Manager
Dy. Manager Assistant Manager Factory Supervisor Staff (Monthly Salaried) (clerks, factory and garden
assistants)
Sub-Staff (Level-D) (Monthly Salaried) (supervisory levels)
[Difference among workers are based on nature of employment and nature of payment
both at factory and garden]
Workers (Level-D) (Daily Wage Workers) (Permanent+ Temporary) (adult male, adult female, and adolescent)
7 Workers in Tea Plantations
Tea is a labour-intensive commodity and labour is one of the main factors of production besides land and capital. Workers in tea plantations usually reside within plantation premises. The existing structure of the tea industry is exploitative and reminiscent of the British colonial system. Though the Plantation Labour Act (1951) and other Acts make it mandatory for the plantation management to provide workers with various economic and social entitlements such as minimum wage, bonuses, rations, provident funds, education and healthcare facilities, on the contrary, several studies illustrate that the workers in tea plantations are subjected to exploitative work patterns, control mechanisms, low wage payments, deplorable housing and living conditions, with no provisions of collective bargaining (Bhowmik 1981; Xaxa 1985; Bhowmik et al. 1996; Guha 2012; Sharma et. al. 2012; Behal 2014; Saha et. al. 2019).
Labour Relations
Tea being a labour intensive commodity, the relationship between management and labour is highly contested and one can wonder why management–labour relation is exploitative, rather it should have been benign for better productivity. Production process of plantation allows in forming an exploitative system. Labour in the tea plantation industry has historical disadvantages. There are five broad disadvantages have been highlighted here. First, the migrants were recruited for plantation at very low wages (Bhowmik 2011). Labour in the plantation in Assam were recruited from the tribal areas of Central India—mainly from the Chotanagpur region (present Jharkhand state) and tribal belts of Orissa (present Chattisgarh state), where workers had to face frequent droughts, famines, and brutal land revenue policies by colonial rulers (ibid). These migrants were indentured labour. Second, labour and their families were brought and kept captives (ibid). Watchmen (guards) kept strict vigil in the labour lines preventing any outsider entering the plantation’s premises (ibid). Third, most of the plantations are located in isolation and any other alternative employment options were not formed in the tea growing region. Fourth, tea plantation workers, mainly, adivasis from central India are not considered as scheduled tribes of Assam (Gohain 2007). Fifth, these adivasi workers do not have any land rights. These disadvantages led to poor labour relations.
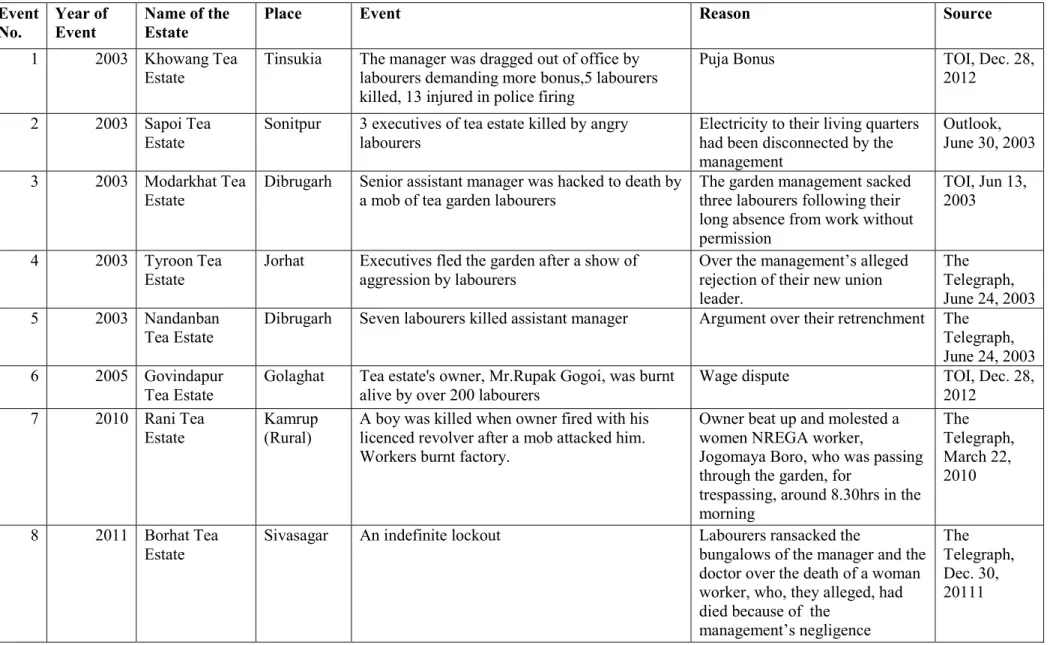
Besides historical disadvantages, we tried to look at the various incidents that reported of tussles between management and labour during the period between 2003 and 2019. We have come across 14 violent cases (ref. Table 1.2). While violent acts of labour are not undesirable, it raises the question on what compel the workers to act at this extreme. Analyzing these incidents, one can argue that most of the incidents are mainly due to when workers are denied with basic facilities, wage payments were inadequate and workers had problems with management’s attitude. A tussle between owner and labour was even taken place due to molestation. From the narratives of the workers, there are also many cases and everyday struggle that exist in the lives of the plantation workers which are not reported. For instance, a permanent worker was forced to resign in Estate 21 (Tinsukia) as the worker met an accident. Another permanent worker was died due to medical negligence in Estate 49 (Udalguri). Therefore, this study intends to study the labour relations and also tries to explore if there is any way in which this relationship can be established as benign. Labour relations are understood from the decent work perspective as it is one of the most holistic approaches (through both macro and micro indicators). In particular, this project aims to look at the aspects of labour and employment in the tea industry in Assam, taking into account work and workplace conditions, economic security in terms of wages and compensation, and social security, including labourers’ welfare, collective bargaining and the status of their basic rights within the decent work framework (ILO 1999).
8
Table 1.2.Incidents of Management-Labour Tussles Event
No.
Year of Event
Name of the Estate
Place Event Reason Source
1 2003 Khowang Tea Estate
Tinsukia The manager was dragged out of office by labourers demanding more bonus,5 labourers killed, 13 injured in police firing
Puja Bonus TOI, Dec. 28,
2012 2 2003 Sapoi Tea
Estate
Sonitpur 3 executives of tea estate killed by angry labourers
Electricity to their living quarters had been disconnected by the management
Outlook, June 30, 2003 3 2003 Modarkhat Tea
Estate
Dibrugarh Senior assistant manager was hacked to death by a mob of tea garden labourers
The garden management sacked three labourers following their long absence from work without permission
TOI, Jun 13, 2003
4 2003 Tyroon Tea Estate
Jorhat Executives fled the garden after a show of aggression by labourers
Over the management’s alleged rejection of their new union leader.
The Telegraph, June 24, 2003 5 2003 Nandanban
Tea Estate
Dibrugarh Seven labourers killed assistant manager Argument over their retrenchment The Telegraph, June 24, 2003 6 2005 Govindapur
Tea Estate
Golaghat Tea estate's owner, Mr.Rupak Gogoi, was burnt alive by over 200 labourers
Wage dispute TOI, Dec. 28,
2012 7 2010 Rani Tea
Estate
Kamrup (Rural)
A boy was killed when owner fired with his licenced revolver after a mob attacked him.
Workers burnt factory.
Owner beat up and molested a women NREGA worker,
Jogomaya Boro, who was passing through the garden, for
trespassing, around 8.30hrs in the morning
The Telegraph, March 22, 2010
8 2011 Borhat Tea Estate
Sivasagar An indefinite lockout Labourers ransacked the
bungalows of the manager and the doctor over the death of a woman worker, who, they alleged, had died because of the
management’s negligence
The Telegraph, Dec. 30, 20111
9 9 2012 Konapathar
Tea Estate
Tinsukia Allegedly 700 tea plantation workers burned their boss and his wife to death
The management had served notice to 10 workers two days ago and asked them to vacate their quarters. Following an [First Information Report] lodged by the management, the police had detained three workers
IBT, Dec. 27, 2012
10 2013 Keyhung Tea Estate
Tinsukia Declared an indefinite lockout at the garden following the attack on the general manager, acting manager and other staff by workers
After a boy got electrocuted and died in the labour lines
EastMojo, Sept. 3, 2019 11 2017 Bogidhola Tea
Estate
Golaghat A tea estate owner and his brother allegedly opened fire at labourers
PF, gratuity, ration and bonus 12 2019 Teok Tea
Estate
Jorhat 73 years old medical doctor is killed by the labour. A temporary worker was died due to medical negligence
Dissatisfaction over health facility and a temporary worker was died.
There was no medical officer when the worker was taken to the hospital
NDTV, Sept.
1, 2019
13 2019 Rosekandi Tea Estate
Cachar Two women tea workers were shot Heated altercation with garden manager over the time of plucking of tea leaves
TOI, Jul 26, 2019 14 2019 Dikom Tea
Estate
Dibrugarh Indefinite lock-out after attack on a doctor The death of a woman worker during a severe thunderstorm, management lapsed in despatching an ambulance
Northeast Now, May 13, 2019
Source: Various Newspaper Articles
10 Objectives of the Study
The specific objectives of the study are to:
1) Examine the work and employment of tea plantation workers from the decent work perspective in terms of employment and income opportunities (availability of work, wage payment, compensation, etc.), guarantee of certain rights at work (access to basic amenities and various discriminations at the workplace), social protection (social security measures and welfare benefits) and social dialogue (freedom of association and collective bargaining process).
2) Explore the vulnerabilities of workers across gender (men/women), age groups (child/adolescent/adult) and nature of employment (seasonal/contractual or permanent).
3) Analyse the future of tea plantations, plantation workers and their alternative livelihood options.
4) Identify factors, constraints and enablers that can facilitate the improvement of work and living conditions of tea plantation workers.
Analytical Framework from Decent Work Perspectives
Nations all over the world are keen on devising new and innovative approaches to address poverty through different goals including Sustainable Development Goals (SDGs). It is also widely accepted that as a condition, economic growth is necessary but not sufficient in itself for sustained reduction in poverty. Enhanced labour productivity—an indicator of economic growth—is an indispensable instrument for fighting against poverty. The importance of decent working and living conditions for all workers throughout the world is understood. The term ‘decent work’ (DW) was introduced by the International Labour Organization (ILO) in 1999 in the director general’s report presented at the 87th International Labour Conference. The main goal was to promote ‘opportunities for women and men to obtain decent and productive work, in conditions of freedom, equity, security, and human dignity’
(ILO 1999: 3). The four major pillars recommended by the ILO (1999) as essential to achieve the goal of decent work are:
1) opportunities for employment and income 2) respect for rights at work
3) social protection and 4) strong social dialogue.
Four major pillars indicators from the decent work (employment opportunities, rights at work, social protection and social dialogue) in the present study to understand the overall well-being of the plantation workers. The DW indicators have been divided into two groups:
1) statistical indicators 2) qualitative indicators
Methodology
Research Design, Approach and Methods
The study aims to explore the current work structure and the living and working conditions of plantation workers including contractual, temporary and permanent workers of tea estates and those working in small tea plantations within the analytical framework of DW. Indicators to understand the work and living conditions encompass both quantitative and qualitative parameters. A descriptive research design has been considered to carry out the study in understanding the objectives. This research design helps to describe the phenomenon, understand the situation, individual and groups, and the relationships between variables (Dulock 1993).
11
A concurrent mixed methods research (MMR) approach has been used combining both quantitative and qualitative methods. Triangulation within concurrent method has been used at the levels of method and data. However, quantitative method has been the dominant method and qualitative method its supplementary (Bryman 2009; Creswell 2009).
Data Sources
Secondary and primary data sources have been used. To set the background at the macro level, the analysis has been drawn from different secondary sources such as Tea Board of India, Indian Tea Association and various reports. Quantitative and qualitative data has been collected under primary data collection. Primary data has been collected by using survey method.
Unit of Analysis
The primary unit of analysis of the study is plantation workers and their family members. They are participants of this research.
Universe of the Study
Assam is the major tea-producing state in India which has the highest number of tea estates. In the present study, Assam is the universe of the study.
Sampling Framework
A 6-stage sampling method has been used to collect data from respondents. Fifty tea estates, located across nine major tea-producing districts of Assam, have been selected. The process and rationale for selecting estates and districts under various stages have been explained.
Stage-1: Selecting of Districts (Clustering)
There are five divisions of Assam, of which the major tea producing estates are located mainly in four divisions. These are: Upper Assam, North Assam, Barak Valley, and Central. We have considered these four divisions as a cluster. As per the record of Tea Tribes, Directorate for Welfare, Government of Assam (2019), there are 803 tea estates spread across 27 districts1 and five divisions of the state of Assam. Out of 803 estates, 706 estates (about 88 percent of the total estates) are located across nine major tea-producing districts (see Table 1.2)—Dibrugarh (177), Tinsukia(122), Jorhat (88), Sivasagar (85), Golaghat (74), Sonitpur (59), Cachar (56), Udalguri (24), and Nagaon (21). Thus, one-third of the total districts (one-third) have been considered in the study.
Stage-2: Selection of Estates (Proportionate Sampling)
The percentage distribution of tea estates across nine major tea-producing districts are 25 percent (Dibrugarh), 17.3 percent (Tinsukia), 12.5 percent (Jorhat), 12 percent (Sivasagar), 10.5 percent (Golaghat), 8.4 percent (Sonitpur), 7.9 percent (Cachar), 3.4 percent (Udalguri), and 3 percent (Nagaon) (see Table 1.2).
1The names of the districts are: (1) Sivasagar, (2) Tinsukia, (3)Golaghat, (4)Karbi-Anglong, (5) Jorhat, (6)Dibrugarh, (7) Dhubri, (8) Bongaigaon, (9) Goalpara, (10) Udalguri, (11) Kokrajhar, (12) Baksa, (13) Chirang, (14) Kamrup (Metro), (15) Kamrup (Rural), (16) Barpeta, (17) Nalbari, (18) Nagaon, (19) Morigaon, (20) Sonitpur, (21) Darang, (22) Lakhimpur, (23) Dhemaji, (24) Kachar, (25)Hailakandi, (26) Karimganj, and (27) DimaHasao.
12
Stage-3: Number of Estates (Quota Sampling and Proportionate Sampling)
In view of the timeframe, availability of financial resources and distance between tea estates in each district, the quota of 50 tea estates has been fixed. With regard to the proportion (in percentage) of major tea-producing districts, 13 (Dibrugarh), 9 (Tinsukia), 6 (Jorhat), 6 (Sivasagar), 5 (Golaghat), 4 (Sonitpur), 4 (Cachar), 2 (Udalguri), and 1 (Nagaon) tea estates have been considered. Geographical location of selected tea estates are shown in Map 1.1.
Map 1.1. Selected Tea Estates across 9 Districts of Assam in Study
Map of India Map of Assam
Stage-4: Selection of Workers (Purposive)
At the time of research design, we decided 10 respondents from each tea estate will be selected so that we can reach out to 500 respondents. However, with the availability of time and workers, in total, we have selected 510 (see Table 1.2). These workers are selected keeping in view of their mode of payment (such as monthly salaried and daily wage) and nature of employment including permanent and temporary workers across gender composition. Although selecting 10 respondents from each tea estate is not representative sampling, collectively 510 across 50 estates are representative as issues and situation are same and homogenous.
13
Table 1.3. Selection of Districts and Tea Estates
Division
No. of District
Name of the District
No. of Tea
Estate percent
No. of TE
No. of Respondents Upper Assam
1 Dibrugarh 177 25.07 13 142
2 Tinsukia 122 17.28 9 89
3 Jorhat 88 12.46 6 62
4 Sivasagar 85 12.04 6 56
5 Golaghat 74 10.48 5 52
North Assam 6 Sonitpur 59 8.36 4 38
7 Udalguri 24 3.40 2 21
Barak Valley 8 Kachar 56 7.93 4 40
Central 9 Nagaon 21 2.97 1 10
Total 706 100 50 510
Source: Calculated based on Tea Tribes, Directorate for Welfare, Government of Assam Inclusion Criteria for Estates
While selecting tea estates in each district, the following broad four inclusion criteria (see Table 1.2) have been taken into account to understand the issues holistically:
a. Status of the Company: Thirty tea estates (60 percent) under Public Ltd Company, nine (18 percent) under Proprietorship, eight (16percent) under Public Sector Undertaking both under Government of India and Government of Assam, and three (6 percent) under Partnership have been considered.
b. Member of Association: Six major associations namely, ITA (Indian Tea Association), TAI (Tea Association of India), TRA (Tea Research Association), ATPA (Assam Tea Planters’
Association), BCP (Bharatiya Cha Parishad) and NETA (North Eastern Tea Association) are identified, with which 50 tea estates are associated.
c. Presence of Trade Union: Although there is not much clear information on the existence of trade union in the estates, we have however tried to consider a couple of tea estates whether two unions are present in the collective bargaining process. We have tried to consider Assam Chah Mazdoor Sangha (ACMS) affiliated to the Indian National Trade Union Congress (INTUC), Akhil Bhartiya Cha Mazdoor Sangha (ABCMS) associated with the Centre of Indian Trade Unions (CITU) and Bharatiya Mazdoor Sangha (BMS) allied to Bharatiya Janata Party (BJP).
d. Areas under Tea Cultivation: Size of the tea estates have also been taken into consideration.
Data Collection Tools Interview Schedule
Semi-structured interview schedule has been used to directly associate with the survey research by including closed-ended and open-ended questions. The survey was carried out using a mobile app (named Collect), based on the structured questionnaire developed during the inception phase of the research. Pilot survey was conducted to finalise the questions before fitting in the app. An orientation was given to the enumerators and research assistants. The app provided a user-friendly interface and allowed efficient collection and storage of data in a database. Concurrently, field note and observation check list were taken.
Interview Methods
Personal interviews and group interviews were conducted (Bryman 2009). In the current study, interviews of 510 plantation workers were conducted and at least one group interview was conducted with 10-15 workers in each of the tea estates. Group interviews in particular helped us to understand common issues of the estates. It further helped to validate and cross-check the data.
14
Picture 1.1. Group Interview Conducted in Estate-10, Dibrugarh
Source: Picture taken during fieldwork In-depth interviews
Government officials, trade union leaders among workers, members from civil society who are actively working for the workers, managers who gave permission to interact with labour, former managers, owner of the estate, and officials from certifying agencies who are interviewed have been considered as the key respondents in this study. In-depth interviews were conducted with individual workers to understand and explore the current situation. They [key informants] provided information on the current situation of tea industry.
Data Analysis
Concurrent methods have been used to analyse quantitative as well as qualitative data. Statistical inferences have been drawn from the quantitative data and analysed with the help of SPSS and STATA. Further, qualitative data has been analysed based on descriptions and narratives from different stakeholders. Case narratives were developed based on in-depth and group interviews and observation and its checklist. Cross tabulation, descriptive statistics, correlation coefficient, and Principal Component Analysis have been used to present the data.
A comparison has been made across broad four types of plantations—Public Ltd Company, Proprietorship, Partnership, and Government Undertaking (both under Government of India and Government of Assam) estates. This is mainly because basic entitlements, wage structure, non-cash benefits, schools, hospitals, work conditions, infrastructure, among other gains vary across these categorization of plantations. Identification or any other personal information/features of the primary responses [workers] and key respondents are not revealed throughout the analysis.
Wage gap calculation has been based on actual consumption keeping family members into account and the actual wage that they receive including both cash and non-cash benefits. Although we have analysed the work undertaken by women and the time spent on the same in a separate section, every theme of this study has been examined from the gender aspect as well. This is the reason, we did not keep any separate section on gender, and rather we presented data across gender. Work is understood from the DW (ILO 1999) framework. We have tried to contextualize DW indicators among plantation workers and revise the framework. Naila Kabeer’s approach of gender equality and women's empowerment have been considered as the analytical framework to understand agency, choice, access to resource and empowerment (Kabeer 2015).
15 The Fieldwork: Strengths, Challenges and Limitations
Despite several challenges, research was successfully conducted. When workers, who are the primary stakeholders to participate in the study, were contacted they immediately gave their consents and they and their family members cooperated whole-heartedly. Some sections of the interviews were based on recall methods and some were based on their experiences. The key respondents of the household did discuss with their family members and shared the information with us. When key respondents gave wrong answers, they were corrected by their family members. This is how the data was simultaneously cross-checked.
The main challenge of this study has been the stipulated time framework. The fieldwork was conducted during February–June 2019 over eight phases. The second major difficulty that we faced was the General Elections in India which was scheduled over seven phases starting from 11 April till 19 May. Due to the enforcement of the Model Code of Conduct (MCC), as declared by the Election Commission of India (ECI), Government of India, we had to stop the fieldwork. Nonetheless, during MCC, we could conduct meetings and interviews with the key informants.
Other than election, as expected, accessing tea estates was difficult at the initial phases. We approached various organizations, as well as the management of many estates. However, seven estates had given us access, agreed to interact with us and also gave permission to interact with the workers.
With the help of the local grass root-level organizations, trade unions and student unions, we could carry out our study. Snowball sampling of key respondents at one level was helpful to gain access to the tea estate at the initial level.
Non-response from the different stakeholders was one of the disappointing factors while conducting this study. We approached 72 tea estates through various contacts but could get access to 50 only. In some cases, workers and trade unions were reluctant to participate in the study and we were asked whether we had the consent of the management. For instance, we were told to provide our identity cards along with study purpose and objectives. However, in some of the tea estates such as Estate-17 (Tinsukia), Estate-26 (Jorhat), Estate-30 (Sivasagar), Estate-39 (Golaghat), Estate-8 (Dibrugarh) and in estates 48 and 49 (Udalguri), we could carry out the study with due official permission. We could visit workers directly in their houses. In one estate in Sonitpur district, we conducted fieldwork with due permission from the owner and the management. As we conducted the fieldwork, we experienced homogeneity in responses. We also perceived that workers’ responses were orchestrated and framed to portray a positive picture of the life of plantation workers. This was revealed once we started validating the responses. For example, all the workers in the garden wore new aprons, new uniforms and had new umbrellas. When one of us asked in the regional language whether they received all the safety equipments only for our visit, one of the women replied affirmatively and counter questioned us: ‘how did you know?’ The women workers looked confused about the purpose of our visit as we approached them [women] through the management. Since workers from this tea estate were reluctant, we decided to drop this estate from our study. It can be inferred from the experience that responses were meant to be staged. Some key respondents from industry, companies, certifying agencies and Tea Board of India were enthusiastically participating in the study which helped us to develop certain indicators. However, some key stakeholders who initially promised to provide required information did not respond after several attempts. It is hard to understand if these stakeholders retracted from their initial approach after going through the questionnaires and guidelines. We believe as a research team if we would have gotten a greater access to the knowledge and expertise of the various stakeholders, the result would have been more enriching.
16
Infrastructure in Tea Estates: Health Centre, 2
Childcare, Schools and Connectivity
This chapter gives an overview of the basic facility and infrastructure in the 50 tea estates across 9 major tea-producing districts of Assam. Here, infrastructure denotes the basic facilities and installations, including roads, schools, childcare units and healthcare services, which facilitate the day-to-day activities of the worker community. These basic amenities are linked to a qualitative and developed human living. The Government of India, through the Plantation Labour Act of 1951 (PLA) has outlined the responsibilities of the tea planters to establish various social infrastructure, social security and welfare benefit measures. Further, the Government of Assam has given it a concrete shape with the Assam Plantation Labour Rules, 1956. Both the Act and the Rules guarantee accessibility to basic services including hospitals, schools, crèche, educational facilities, drinking water sanitation and canteen. According to the Plantation Labour Act, 1951, the employer needs to provide a garden hospital for estates having more than 500 workers or have a lien of 15 beds for every 1,000 workers in a neighbouring hospital within a distance of 5km, a group hospital in a sub area considered central for the people and provide transport to the patients. The ease of access is also determined by their proximities to the residences of the workers in the estates. Apart from basic amenities and social infrastructure, the chapter also deals with the collective bargaining rights of the workers in the form of trade unions and the presence of trade certification agencies in the estates.
These are mainly to understand the role trade unions and certifying bodies in lives of workers.
Ownership Status and Organizational Affiliation Ownership Status
There are broadly four different types of ownership in the tea industry in Assam, namely, Public Limited Company (Public Ltd. Co.), Partnership-based Firm, Proprietorship and Public Sector Undertaking. However, we have considered five categories in our analysis in details. We have divided government undertaking firms into two parts such as one by the Government of India and another by the Government of Assam. Therefore, five categories that are considered in our analysis are: Public Ltd. Co., Partnership, Proprietorship, Public Sector Undertaking (Government of India enterprise), Public Sector Undertaking (Government of Assam undertaking). The assumption of categorising ownership is that entitlements and benefits for labour may vary across estates. Looking at the findings, ownership of the estates does not have great impact on the entitlements and labour relations.
Likewise, planters’ affiliations are considered whether they have any positive impact or not.
Conditions of the labour across different planters’ associations are similar. Out of 50 estates, 29 estates are owned as public limited companies while 12 are owned on proprietorship basis and 5 are retained as partnership firms (see Figure 2.1). The number of estates owned by the Government of Assam and Government of India Public Sector Undertakings (PSUs) are 3 and 1, respectively.
17
Figure 2.1.Types of Ownership of the Estates
Source: Based on TBI 2019
Affiliation
As far as different planter’s associations are concerned, there are six dominant planters’
associations—Indian Tea Association (ITA), Tea Association of India (TAI), Assam Tea Planters’
Association (ATPA), Tea Research Association (TRA), Bharatiya Cha Parishad (BCP) and North East Tea Associations (NETA)—on which 50 selected estates are affiliated. Out of 50 tea estates, 28 estates are associated with the ITA, while 8 are registered with the TAI and 7 associated with ATPA.
Four estates are registered under TRA while 2 with BCP and 1 with NETA (see Figure 2.2).
Figure 2.2. Types of Planters’ Associations
Source: Based on TBI 2019
Distance from Estates
Accessibility of the estates to basic services like the nearest railway station, bus stop, government hospitals, high schools and highways from the estate is important to understand how captive society is
5
12
29
3 1
0 5 10 15 20 25 30 35
Partnership firm Proprietorship Public Ltd Co Public Sector Undertaking (Government of
Assam)
Public Sector Undertaking (Government of India
Enterprise)
No. of Estates
Types of Ownership
7
2
28
1
8
4
0 5 10 15 20 25 30
ATPA BCP ITA NETA TAI TRA
No. of Estates
Planter's Association

![Figure 2.5). Therefore, this is obvious that students will find difficulties to go out of the estates as they [estates] are isolated far away located](https://thumb-eu.123doks.com/thumbv2/1library_info/5317685.1679489/32.892.124.766.218.497/figure-obvious-students-difficulties-estates-estates-isolated-located.webp)