Marine Environmental Science (M. Sc.)
MASTER THESIS
Clock gene expression patterns in brain and eyestalk tissue of freshly caught Antarctic krill,
Euphausia superba, during winter.
Submitted by: CONSTANZE BARK
PRINCIPAL SUPERVISOR: Prof Dr Bettina Meyer, University of Oldenburg CO-SUPERVISOR: Dr Kim Last, Scottish Association for Marine Science
Oldenburg, September 9, 2019
MASTER-THESIS
Clock gene expression patterns in brain and eyestalk tissue of freshly caught Antarctic krill, Euphausia superba, during winter
Submitted: September 9, 2019
SUBMITTED BY
Constanze Bark
Matriculation number: 3261087 Am Dobben 35
28203 Bremen
constanze.bark@uni-oldenburg.de
PRINCIPAL SUPERVISOR
Prof Dr Bettina Meyer
Helmholtz Institute for Functional Marine Biodiversity at the University of Oldenburg (HIFMB)
Section: Biodiversity and biological processes in polar oceans Ammerländer Heerstraße 231, 26129 Oldenburg
Alfred Wegener Institute for Polar- and Marine Research Section: Polar biological oceanography
Am Handelshafen 12, 27570 Bremerhaven
CO-SUPERVISOR
Dr Kim Last
Scottish Association for Marine Science (SAMS) Scottish Marine Institute
Oban, Argyll, PA37 1QA
Abstract Abstract
The high-latitude Antarctic krill, Euphausia superba, is a key species in the Southern Ocean, a region with extreme seasonal and daily changes in photoperiod (day length), light intensity, sea-ice extent, and food availability. In particular, changes in environmental light regimes have been shown to strongly influence krill circadian clock mechanisms and, by extension, synchronized metabolic or physiological output functions. However, knowledge of clock gene functions and regulations in Antarctic krill is still limited, especially with regard to clock gene products, their distribution, and their impact on oscillatory rhythmicity and chronobiological functions. In particular, it is still unclear whether or not the circadian clock might be functioning in krill during summer and winter, when due to the high latitude krill are exposed to near constant light and near constant darkness respectively. This study aims to provide a first basic insight into clock gene expression in wild Antarctic krill during winter conditions. Besides, methodological optimization was attempted to identify putative tissue-specific rhythmic gene expression patterns in brain and eyestalks. In summary, significant 24 h and 16 h oscillatory rhythms could be identified in the relative gene expression of three important clock genes, Cyc, Sgg, and Tim, as well as in the metabolic gene Atpg in both krill brain and eyestalks.
Additionally, nine of ten tested clock genes displayed a general tendency for upregulation in the early night in both tissues during low to even absent light regime.
The results of the present study suggest that krill brain and eyestalks are equally important for clock gene expression due to similar detected amplitudes and therefore the analysis of whole krill heads is recommended for further studies.
Furthermore, the results suggest that the circadian clock might be still active in wild krill during winter, despite the extremely low levels of day light to which the animals might be exposed. Future investigations concerning the regulation of endogenous timing systems and rhythmic functions in Antarctic krill might help to understand how circadian functions might be preserved during summer and winter at high latitudes and also how these might be affected by potential environmental alternations driven by climate change.
Key words: Antarctic krill Euphausia superba, circadian clock, clock genes, brain and eyestalks, field samples, Bransfield Strait, austral winter, relative mRNA level
Zusammenfassung Zusammenfassung
Der in hohen Breiten vorkommende Antarktische Krill, Euphausia superba, ist eine Schlüsselart im Südpolarmeer, einer Region mit extremen saisonalen und täglichen Veränderungen der Photoperiode (Tageslänge), Lichtintensität, Meereisausdehnung und Nahrungsverfügbarkeit. Es wurde gezeigt, dass Änderungen des Umgebungslichtregimes die zirkadianen Uhr-Mechanismen von Krill und damit auch die synchronisierten metabolischen oder physiologischen Ausgangsfunktionen stark beeinflussen. Jedoch ist das Wissen über die Funktion und Regulation von Uhr- Genen im antarktischen Krill nach wie vor begrenzt, besonders in Bezug auf Uhr- Genprodukte, deren Verteilung und deren Auswirkung auf die oszillatorische Rhythmik und die chronobiologischen Funktionen. Noch ist unklar, ob die zirkadiane Uhr im Sommer und Winter im Krill funktioniert, wenn Krill aufgrund des hohen Breitengrades nahezu konstantem Licht bzw. nahezu konstanter Dunkelheit ausgesetzt ist. Diese Studie soll einen ersten grundlegenden Einblick in die Uhr- Genexpression in wildem antarktischem Krill unter winterlichen Bedingungen geben.
Außerdem wurde eine methodische Optimierung getestet, um mutmaßliche gewebespezifische, rhythmische Genexpressionsmuster in Gehirn und Augen zu identifizieren. Zusammenfassend konnten signifikante 24-h- und 16-h- Oszillationsrhythmen in der relativen Genexpression von drei wichtigen Uhr-Genen Cyc, Sgg und Tim, sowie im metabolischen Gen Atpg im Gehirn und in Augenstielen des Krills identifiziert werden. Zusätzlich zeigten neun von zehn getesteten Uhr- Genen eine allgemeine Tendenz zur Hochregulation in der frühen Nacht in beiden Geweben, bei schwachem bis sogar fehlendem Lichtregime. Die Ergebnisse der vorliegenden Studie legen nahe, dass das Gehirn und die Augenstiele von Krill aufgrund ähnlicher detektierter Amplituden für die Genexpression von Uhr-Genen gleichermaßen wichtig sind, weshalb die Analyse ganzer Krillköpfe für zukünftige Studien empfohlen wird. Weiterhin deuten die Ergebnisse darauf hin, dass die zirkadiane Uhr im Winter in wildem Krill möglicherweise noch aktiv ist, obwohl das Tageslicht, dem die Tiere ausgesetzt sein könnten, extrem niedrig ist. Zukünftige Untersuchungen zur Regulation endogener Zeitsteuerungssysteme und rhythmischer Funktionen im antarktischen Krill könnten Aufschluss darüber geben, wie zirkadiane Funktionen im Sommer und Winter in hohen Breiten erhalten bleiben und wie diese durch potentielle klimabedingte Umweltänderungen beeinflusst werden können.
Schlüsselwörter: Antarktischer Krill Euphausia superba, innere Uhr, Uhr-Gene, Gehirn und Augenstiele, Feldproben, Bransfieldstraße, südlicher Winter, relatives mRNA Level
Index
Index
1 INTRODUCTION ... 1
1.1 The Antarctic krill Euphausia superba ... 1
1.2 Rhythmic functions in the Antarctic krill, Euphausia superba ... 2
1.2.1 Daily rhythms in krill: diel vertical migration (DVM) ... 2
1.2.2 Seasonal cycles in krill ... 4
1.3 Daily biological processes in organisms are regulated by endogenous clocks ... 5
1.3.1 The circadian clock regulating biological processes ... 5
1.3.2 The circadian clock on a molecular level using the example of Drosophila6 1.3.3 The circadian clock in marine organisms ... 8
1.4 The circadian clock in Euphausia superba, and mechanisms of regulation ... 9
1.5 Challenges to circadian regulation in high-latitude species... 11
1.6 Aim of study ... 12
2 MATERIAL & METHODS ... 13
2.1. Time-series sampling of E. superba in the field ... 13
2.2 Average integrated chlorophyll a determination and water temperatures………14
2.3 Irradiance at fishing depth and sea-ice concentration data... 15
2.4 Selecting and processing of E. superba ... 16
2.4.1 Tissue separation and processing ... 16
2.4.2 Dissection of eyestalk and brain tissue ... 17
2.5 RNA extraction ... 18
2.6 Preparation of spike controls... 21
2.6.1 Transcription of the spikes, purification, and quality control ... 21
2.6.2 Determination of optimal spike concentration for further chronobiologic analyses ... 23
2.7 cDNA synthesis of tissue-specific RNA extracts ... 24
2.8 Analysis of gene expression via TaqManTM qPCR ... 24
Index
2.8.1 Custom TaqManTM Array Card Design ... 24
2.8.2 Gene selection for the Custom TaqManTM Array Card ... 25
2.8.3 Primer design and sequence validation for Custom TaqManTM Array Card ... 27
2.8.4 Primer efficiency for all primer sets (in particular for timeless and clock) 27 2.8.5 qPCR with Custom TaqManTM Array Cards ... 29
2.8.6 Data quality control of TaqManTM qPCR results ... 29
2.9 Normalization of raw Ct values and relative quantification of mRNAs ... 29
2.10 Statistics ... 30
3 RESULTS ... 32
3.1 Regulatory network of clock gene expression patterns ... 32
3.2 Daily profiles of clock gene expression in brain and eyestalks ... 33
3.2.1 Analyzed differences within brain and eyestalks tissues ... 33
3.2.2 Analyzed differences between brain and eyestalks tissue ... 36
4 DISCUSSION ... 39
4.1 Environmental conditions in the field ... 39
Light conditions at fishing depth ... 39
Krill abundance and chl a concentration ... 40
4.2 Regulation of clock genes in E. superba during winter conditions ... 40
4.3 Comparison of clock gene expression levels in brain and eyestalk tissue ... 43
Putative co-regulation of clock genes between tissues ... 44
4.4 Improvements and indications for future studies ... 46
5 CONCLUSION ... 48
6 OUTLOOK ... 49
7 ACKNOWLEDGMENTS ... 51
8 APPENDIX ... 52
REFERENCES ... 56
STATUTORY DECLARATION... 63
List of figures
List of figures
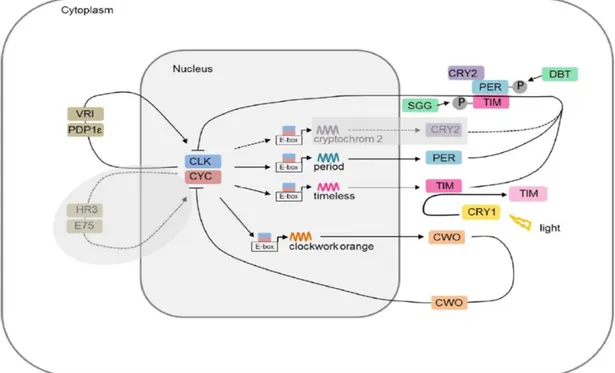
Figure 1: Hypothetical molecular mechnisms of the insect circadian clock in the model organism Drosophila melanogaster – The principal auto regulative feedback loop consists of the transcription factors CLOCK (CLK) and CYCLE (CYC), and the regulators PERIOD (PER) and TIMELESS (TIM). In Drosophila, CHRYPTOCHROME (CRY1) displays a negative regulator and degrades TIM in a light-dependent manner to reset the clock’s phase. CHRYPTOCHROME (CRY2) as an additional negative regulator is not present in Drosophila, but in other arthropods species including the monarch butterfly Danaus plexippus (Zhu et al., 2008; Merlin et al., 2009) and the Antarctic krill (Biscontin et al., 2017). SHAGGY (SGG) and DOUBLETIME (DBT) regulate the timing of nuclear entry of TIM and PER by phosphorylating both proteins, respectively. In an additional loop, CLK is cyclically expressed by VRILLE (VRI) and PAR DOMAIN PROTEIN 1ɛ (PAR1ɛ), while expression of CYC is still unknown in Drosophila, but proposed to be expressed by HR3 and E75 in other insects. In a second additional loop, CLOCKWORK ORANGE (CWO) is rhythmically expressed. Solid lines indicate pathways known for Drosophila. Dashed lines and grayed out fields indicate hypothesized mechanism in other insects.
[Adapted from Tomioka and Matsumoto, 2015 and Pitzschler, 2018. Modified.]
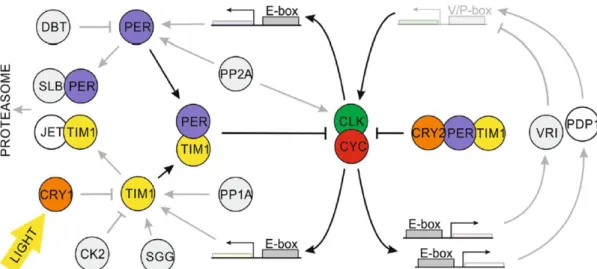
………7 Figure 2: Schematic representation of the putative circadian clock in Antarctic krill –
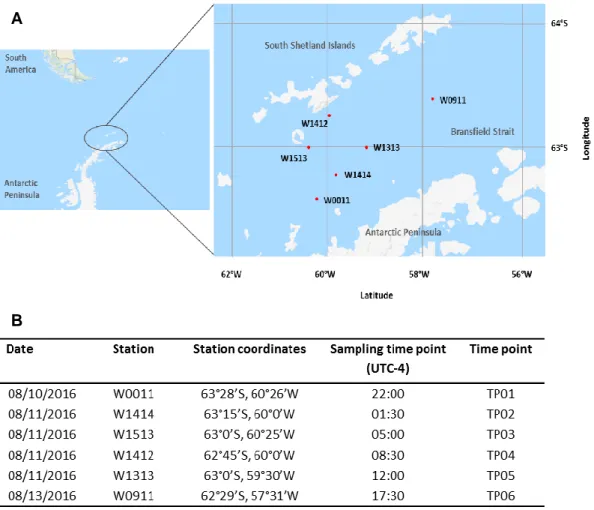
The two main feedback loops are indicated, containing CLK, CYC as positive elements and PER, TIM, and CRY2 as negative elements, whereas negative elemetns interact to suppress the activation of the positive elements. The blue- light photoreceptor CRY1, is activated by light and causes degradation of TIM, releasing PER/TIM suppression from CLK/CYC. Identified clock components in Antarctic krill are colored, while components with no functional characterization are greyed. Modified after Biscontin et al., 2017. ... 10 Figure 3: Study area incl. stations where krill was sampled – A) Krill sampling
stations during AMLR 2016 NBP 1606 cruise. B) Stations W011 to W1513 were sampled every 3.5 hours for a time period of 24 h, except for TP06. E. superba was caught between 56°- 62°W latitude and 62°- 64°S longitude in the Bransfield Strait between the South Shetlands Islands and the Antarctic Peninsula. UTC-4 = Coordinated Universal Time minus 4 hours, indicates the local time in Bransfield Strait, Antarctica at time of sampling. [Reference: Map Data © 2019 Google. Modified.] ... 14
List of figures
Figure 4: Separation of head from the rest of the body of E. superba – Head was cut off in a skewed angle behind the eyes without damaging the stomach. The dashed red line indicates the separation. Modified. [Reference:
https://link.springer.com/chapter/10.5822/978-1-61091-854-1_1] ... 17 Figure 5: Schematic representation of circadian oscillators in crustacean head -
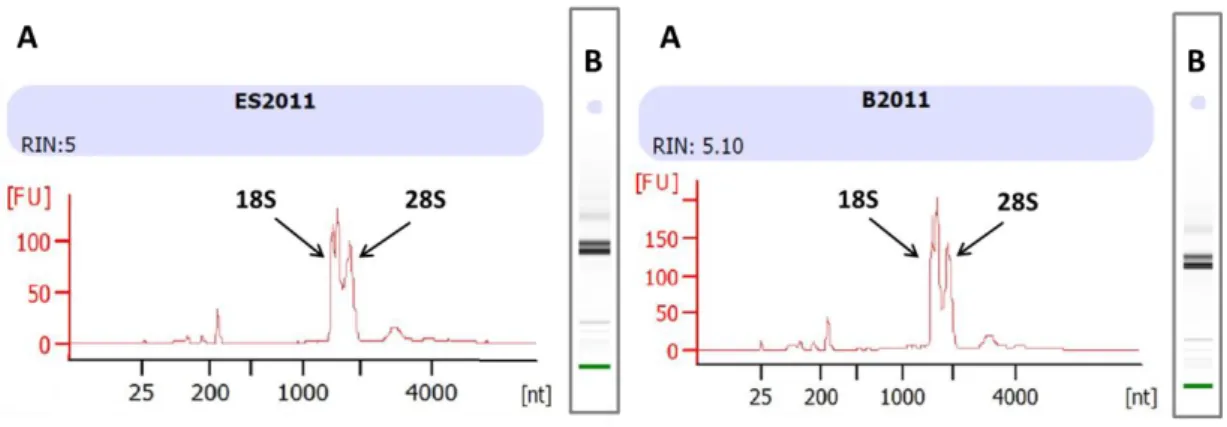
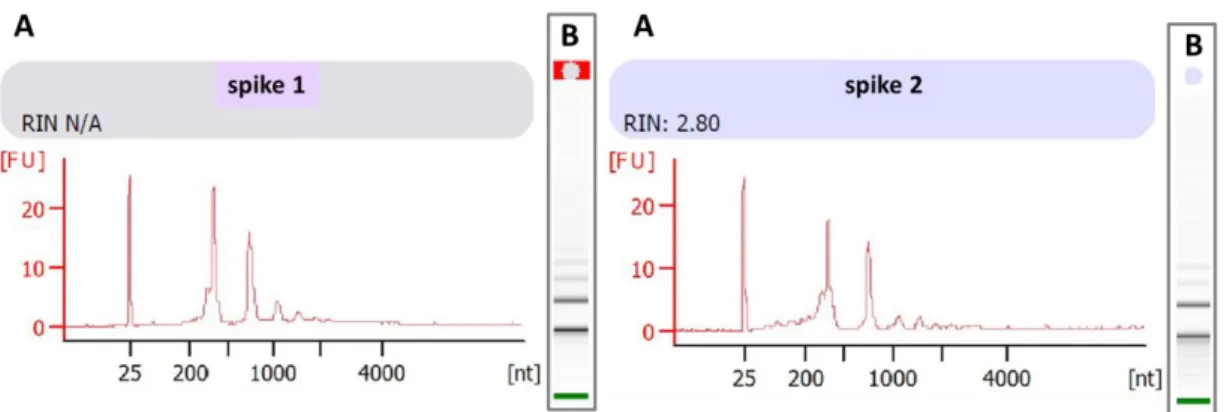
Localization of the circadian oscillators in the head of a generic crustacean (modified after Strauss and Dircksen, 2010). Putative oscillators are indicated as small sinus waves within the retinae of the compound eye, the eyestalks, and the brain. ... 17 Figure 6: Separation of E. superba head and dissection of tissues – a) Exemplary brain-eyestalks-retinae complex. Dashed red lines indicate the cut surfaces used to separate retinae (R) from eyestalks without contamination and to remove the excess tissues at the base of the brain. b) Exemplary brain- eyestalks complex with dissected retinae. Dashed red lines indicate the cut surfaces used to cut off the eyestalks (ES) from the brain (B). Binocular microscope pictures with a dimensional scaling of 2 mm. ... 18 Figure 7: Electropherogram (A) and gel (B) of an exemplary eyestalk (left panel) and brain (right panel) sample of Antarctic krill (E. superba) - Results of a microfluidic electrophoresis performed in the Agilent 2100 Bioanalyzer using the RNA 6000 Nano Kit System. Time of RNA peak appearance (size related; x- axis) is plotted against the fluorescence (concentration related; y-axis). Small smudgy peaks within the 200 to 1000 nt region usually do indicate degradation, while big bulked peaks within the 2000 to 4000 nt region do indicate genomic contamination. RNA degradation and genomic contamination were not obvious, neither in the electropherogram (A) nor in the progress of the gel (B). The 18S peak resulted from the presence of 18S rRNA which is a component of the small eukaryotic ribosomal subunit, while the 28S peak resulted from the presence of 28S rRNA which is the structural ribosomal RNA for the large subunit of eukaryotic cytoplasmic ribosomes. These two characteristic peaks do suggest that the RNA which was analyzed came from a eukaryotic organism, in this case from the head section of Antarctic krill E. superba. ... 20 Figure 8: Electropherogram (A) and gel (B) of spike 1 (left panel) and 2 (right panel) for E. superba samples – Results of a microfluidic electrophoresis performed in the Agilent 2100 Bioanalyzer using the RNA 6000 Nano Kit System. Time of RNA peak appearance (size related; x-axis) is plotted against the fluorescence (concentration related; y-axis). The lower marker of the Kit System showed a peak at 25 [nt], while the spike displayed a peak around 220 [nt]. Both
List of figures
electropherograms revealed a similar peak pattern (750 nt, 1000 nt, 1800 nt).
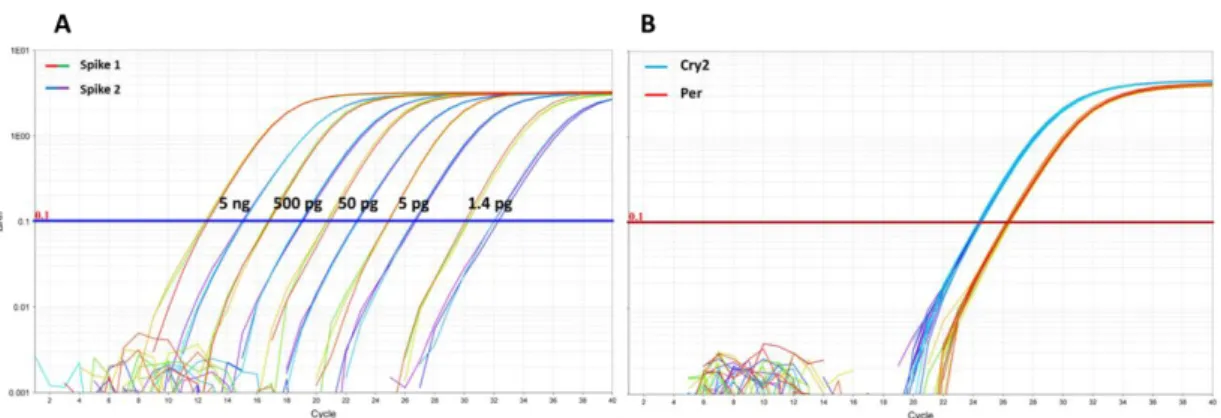
These peaks could be a result of non-completed DNA digestion, but they do not affect the analyses. For more accurate verification, sequencing would be required. ... 22 Figure 9: Amplification plots of the TaqManTM Real-Time PCR-Assay – A)
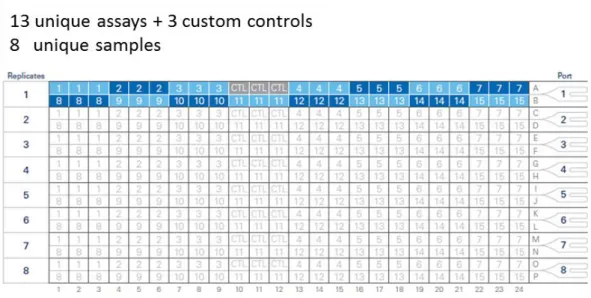
Amplification plot of the spike controls 1 and 2 with different concentrations (5 ng, 500 pg, 50 pg, 5 pg, 1.4 pg). B) Amplification plot of the genes Chryptochrome2 gene (Cry2) and Period (Per). Ct values of Cry2 reached the threshold baseline (0.1) after approx. 24 cycles, while Per Ct values reached the baseline after approx. 26 cycles. The spike concentration (A) which corresponded most likely to this was above 5 pg. For further analyses 7 pg of spike1 and 2 were used. ... 23 Figure 10: Custom TaqManTM Array Card format with 13 unique assays and 3
custom controls used in this study – Instead of the mandatory control (CTL) slot 3 custom controls (internal: Usp46 and external: spike 1 and 2) were loaded.
The 8 unique samples were loaded using the ports on the right hand side.
Modified. [Reference: https://assets.thermofisher.com/TFS-Assets/LSG/
Warranties/cms_040127.pdf]. ... 25 Figure 11: Primer efficiency using clock gene specific primer sets – Mean Ct-values of Clk and Tim primer sets were plotted against the logarithm of cDNA concentration used in a dilution series (100 ng, 200 ng, 400 ng, and 800 ng) in brain and eyestalks tissue, respectively. Primer efficiencies were calculated using the formula E= (10(-1/slope) -1) x 100. Efficiencies [%] for each primer pair within the respective tissues are indicated in bold. ... 28 Figure 12: Geometric mean of raw Ct-values of internal and external control - UTC-
4 = Coordinated Universal Time minus 4 hours, indicates the local time in Bransfield Strait, Antarctica at time of sampling. Raw mean Ct-values (y-axis) were plotted against the UTC-4 (x-axis). Left panel: Combination of Spike 1 + Usp46, respectively in brain. Right panel: Combination of Spike 1 + Usp46, respectively in eyestalks. Data are expressed as geometric mean ± SEM (brain:
n= 10, 9, 10, 10, 10, 7; eyestalks: n= 10, 10, 10, 10, 10, 7). ... 30 Figure 13: Heat maps of daily clock gene expression patterns in different tissues – A) Gene expression over time (24 h) in brain. B) Gene expression in eyestalks over time (24 h) (for more details concerning clock gene regulatory network see Figure 1). Heat maps and dendrograms show the expression levels of clock genes during the 24 h cycle and are represented with a color-coded scale;
yellow and blue represent high and low expression levels, respectively. TP=
List of figures
time point, indicates the time point of sampling every 3.5 h in a time period of 24 h (except for TP06, it was 53.5 h). Genes clustered together based on similarity of daily gene expression patterns. Light bar beneath the graphs shows the respective photoperiod at the sea surface (grey = dark phase; yellow = light phase). ... 33 Figure 14: Core clock gene expression patterns in brain and eyestalks – Ten clock genes (Clk, Cry2, Cwo, Cyc, Dbt, E75, Per, Sgg, Tim, and Vri) and the metabolic key enzyme Atpg were analyzed over 24 h. Relative mRNA levels (NRQ) were plotted against local time (UTC-4). UTC-4 = Coordinated Universal Time minus 4 hours, indicates the local time in Bransfield Strait, Antarctica at time of sampling. Data are expressed as mean ± SEM (brain: n=
10,9,10,10,10,7; eyestalks: n= 10,10,10,10,10,7). TP= time point, indicates the time point of sampling every 3.5 h in a time period of 24 h ( except for TP06, it was 53.5 h). Light bar beneath the graph shows the respective photoperiod (grey = dark phase; yellow = light phase) at the sea surface. Schematic sinus curves indicate significant daily oscillation for Cyc and Tim with a period of 16 h and 24 h in eyestalks determined by RAIN analysis (for p-values see appendix) in brain and eyestalks. Hash keys indicate significant differences between both tissues tested for each ZT (Whitney-Wilcoxon test). ... 37 Figure 15: Associated clock genes and metabolic gene expression patterns in brain
and eyestalks – Ten clock genes (Clk, Cry2, Cwo, Cyc, Dbt, E75, Per, Sgg, Tim, and Vri) and the metabolic key enzyme Atpg were analyzed over 24 h.
Relative mRNA levels (mean NRQ) were plotted against local time (UTC-4).
UTC-4 = Coordinated Universal Time minus 4 hours, indicates the local time in Bransfield Strait, Antarctica at time of sampling. Data are expressed as mean ± SEM (brain: n= 10,9,10,10,10,7; eyestalks: n= 10,10,10,10,10,7). TP= time point, indicates the time point of sampling every 3.5 h in a time period of 24 h (except for TP06, it was 53.5 h). Light bar beneath the graph shows the respective photoperiod (grey = dark phase; yellow = light phase) at the sea surface. Schematic sinus curves indicate significant daily oscillation with a period of 24 h for Sgg and Atpg in brain and eyestalks, respectively and a daily oscillation with a period of 16 h for Sgg in eyestalks. Hash keys indicate significant differences between both tissues tested for each ZT (Whitney- Wilcoxon test). ... 38 Figure 16: Schematic representation of potential co-regulation of clock genes over
idealized 24 h cycle – Mean expression levels of Clk, Cyc, Per, Tim, Cry2, Cwo, Vri, E75, Sgg, Dbt, and Atpg were analyzed over 18 h +/- 6 hours to identify
List of figures
putative rhythmicity within a range of periods included between 12 h and 24 h in daily patterns of gene expression. We tested for this range of periods to ensure a detection of all rhythmic circadian behavior, including potential bimodal patterns with 12 h. ‘Hours’ indicates the distance towards the next repetition in hours (potential rhythmicity). TP = time point, displays the time point of sampling every 3.5 h in a time period of 24 h, except for TP06 (it was 53.5 h).
Distances between TPs were idealized to 4 hours due to clarity. Blue squares with white ‘B’ illustrate highest NRQ levels in brain, red half round squares with white ‘ES’ illustrate maximum mean expression levels in eyestalks. Half blue/half red squares illustrate maximum expression levels for both tissues at the same time point. Values on y-axis cannot be equated with relative mRNA levels. Genes are grouped in core clock genes (green), associated clock genes (yellow), kinases (purple) and metabolic genes (black). Grey bar indicates dark phase at the sea surface, while yellow field indicates light phase at the sea surface. ... 46
List of tables
List of tables
Table 1: Environmental data from August 10th, 11th, and 13th, 2016 – Data were taken in West Antarctica in the Bransfield Strait stratum (62°-64°S, 56°-62°W), between the South Shetland Islands and the Antarctic Peninsula at different stations in August 2016. UTC-4 = Coordinated Universal Time minus 4 hours, indicates the local time in Bransfield Strait, Antarctica at time of sampling. ... 16 Table 2: Primer sequences of target genes, housekeeping genes, and spike controls used for RT-qPCRs – Sequences of genes were obtained from the krill database (http://krilldb.bio.unipd.it/; Sales et al., 2017) except for spike 1, spike
2 and cry2, which can be accessed via GenBank
(https://www.ncbi.nlm.nih.gov/genbank/). ... 26 Table 3: Primer efficiencies in tested brain tissues – Reaction efficiencies were
calculated using the following formula: E = (10(-1/slope) -1) x 100. ... 53 Table 4: Primer efficiencies in tested eyestalk tissues – Reaction efficiencies were
calculated using the following formula: E = (10(-1/slope) -1) x 100. ... 53 Table 5: Results of statistical RAIN analysis in brain implemented by R - Data were
fit to a sinusoidal curve with the required period. P-values and the phases of the sinusoidal curve (amplitude of the oscillation is maximal) are shown in the table for each gene. P-values were corrected for multiple comparisons using the false discovery method (fdr) of Benjamini, Hochberg, and Yekutieli (Benjamini and Hochberg, 1995; Benjamini and Yekutieli, 2001) implemented within the RAIN package. Significant p-values are indicated in bold. ... 54 Table 6: Results of statistical RAIN Results of statistical RAIN analysis in brain
implemented by R - Data were fit to a sinusoidal curve with the required period.
P-values and the phases of the sinusoidal curve (amplitude of the oscillation is maximal) are shown in the table for each gene. P-values were corrected for multiple comparisons using the false discovery method (fdr) of Benjamini, Hochberg, and Yekutieli (Benjamini and Hochberg, 1995; Benjamini and Yekutieli, 2001) implemented within the RAIN package. Significant p-values are indicated in bold. ... 54 Table 7: P-values of Mann-Whitney-Wilcoxon test - To compare the level of gene expression for each time point (TP) between eyestalk and brain tissues the Mann-Whitney-Wilcoxon test were used. Bold p-values were still significant after fdr adjustment. ... 55
List of abbreviations List of abbreviations
1 Introduction 1 Introduction
1.1 The Antarctic krill Euphausia superba
The Antarctic krill, Euphausia superba (Dana, 1850), is an important marine key species of the high-latitudes and belongs to the order Euphausiacea, superorder Eucarida. The term ‘krill’ originates from the Norwegian word kril, describing the small crustaceans North Atlantic whalers found in baleen whales stomachs (Mauchline and Fisher, 1969; Nicol, 1994). Nowadays, the term krill encompasses approx. 85 pelagic shrimp-like crustacean species, also known as Euphausiids, which are widespread in all world oceans (Siegel, 2000). Within the Euphausiids, Euphausia superba, our species of interest, dominates the zooplankton communities in the Southern Ocean as an endemic species and is therefore of great importance in the Antarctic marine ecosystem.
E. superba (hereafter krill) is circumpolar distributed in the Southern Ocean between latitudes of approx. 50°S to 70°S (Hill et al., 2013). However, over 70 % of its total population is located in the productive southwest Atlantic sector (Drake Passage) and in the region of the West Antarctic Peninsula, where they inhabit continental shelf areas and slopes as well as deep-ocean basin regions (Siegel, 2000; Atkinson et al., 2004; Siegel, 2016). In the Antarctic food web, krill dominates the herbivorous zooplankton community due to their circumpolar distribution, high abundance, and high biomass (Knox, 1984). This species is of enormous ecological importance since it plays a key role in energy transfer from primary producers (phytoplankton) to higher trophic levels, including fish, squids and top predators such as birds (e.g. penguins, albatrosses, and petrels) and marine mammals (e.g.
seals and whales), (Clarke and Harris, 2003).
However, krill’s central position in the Antarctic food web might be endangered, to which man contributes directly and indirectly. In course of the anthropogenic climate change, the main feeding grounds of krill in the Southern Ocean, the southwest Atlantic sector and the region of the West Antarctic Peninsula, experienced a surface summer temperature increase of 1°C since the 1950s (Meredith and King, 2005). It is assumed that the decline in sea-ice extent due to warming has led to a change in primary productivity, phytoplankton composition, and sea-ice dynamics (Curran et al., 2003; Clarke and Harris, 2003), and that these changes have already significantly affected the distribution and abundance of Antarctic krill (Atkinson et al., 2004; Reiss et al., 2008; Hill et al., 2013). Besides, ocean acidification is also associated with changes in krill population density and
1 Introduction
recruitment (Kawaguchi et al., 2013). Furthermore, Atkinson et al. (2004) found indications for a decline in krill stocks (~ 70%) over the past 30 years in association with a southward shift of the remaining stocks and an increase in salp densities in the affected regions of the Southern Ocean (Atkinson et al., 2008). Besides the changes in sea-ice extent, the southward shift has also been explained with changes in the anomalies of the Southern Annular Mode (Atkinson et al., 2019).
In addition to the indirect threats of climate change, there is also a direct threat to Antarctic krill stocks in the form of a growing fishing industry (Nicol et al., 2012; Reiss et al., 2017). The pressure on the species is increased by improved harvesting techniques and a growing interest in newly developed krill products in the aquaculture, pharmaceutical, or dietary supplements sectors due to its high nutritional value (Yoshitomi et al., 2007; Tou et al., 2007; Schiermeier, 2010). In view of the changing environmental conditions within its habitat and increasing commercial interests, a holistic and detailed understanding of Antarctic krill, its adaptability, and its (future) role in the southern polar ecosystem is of great importance.
1.2 Rhythmic functions in the Antarctic krill, Euphausia superba
The Southern Ocean is characterized by a wide range of strong seasonal and daily fluctuations, occurring in day length, food supply, and sea-ice extent (Quetin and Ross, 1991; Clarke and Harris, 2003). Antarctic krill show remarkable adaptions to its high-latitude habitat and have evolved rhythmic functions in behavior, metabolism, and transcription to cope with the extreme variations in their environment (Hays, 2003; Murphy et al., 2006; Meyer et al., 2010; Teschke et al., 2011; Piccolin et al., 2018a).
1.2.1 Daily rhythms in krill: diel vertical migration (DVM)
In the water column, adult Antarctic krill usually occur within the upper 200 m in large assemblages or schools with average lengths of hundreds of meters to avoid predation by swarming (Siegel, 2016). A daily rhythm that appears in krill swarms is the diel vertical migration (DVM), (Cisewski et al., 2010; Siegel, 2005). The most common DVM pattern, called ‘nocturnal’, describes the zooplankton behavior of swimming upwards towards the surface layers (photic zone) around sunset feeding on phytoplankton, and migrating back downwards towards deeper layers around sunrise (Quetin and Ross, 1991; Hays, 2003). It is generally believed that this strategy has evolved to avoid predator pressure occurring in the light and thus
1 Introduction
minimize predator risk (Brierley, 2014). The ‘twilight’ DVM pattern displays another behavior in zooplankton, where two following migrations are performed over a 24 h cycle, one around sunset and another around sunrise (Cohen and Forward, 2005).
In an ongoing discussion, light cues are still considered as the main driver of DVM, especially due to the often observed close association between DVM ascent/descent and sunset/sunrise (Cohen and Forward, 2009). Nevertheless, other parameters such as food availability, predator presence/absence (Gliwicz, 1986;
Bollens and Frost, 1991; Hays, 2003; Sourisseau et al., 2008) or social interactions (swarming behavior) (Gaten et al., 2008; Kawaguchi et al., 2010) are also taken into account as influencing factors in DVM. Besides, investigations in Arctic zooplankton species showed that DVM patterns correspond with rhythms in metabolic activity and clock gene expression (Häfke et al., 2017) and that DVM persists even during winter which suggests the evolvement of an endogenous circadian clock mechanism (Last et al., 2016).
It has been suggested that Antarctic krill can flexibly adapt their DVM pattern to environmental factors such as predator or food conditions (Zhou and Dorland, 2004; Cisewski et al., 2010). Moreover, as a high latitude species, it might be possible that krill DVM patterns vary between seasons (Piccolin et al., in prep). In spring and autumn the ‘nocturnal’ DVM in krill is more pronounced due to a clear day/night cycle and ranges between 50 and 150 m depth, compared to summer where krill DVM is restricted within surface layers possibly due to high food availability and weaker photoperiodic cues (Siegel, 2005; Quetin and Ross, 1991).
In winter, krill may become more benthopelagic living in deeper layers around 350 to 600 m and might perform extensive DVM, remaining below 100 m during the night, and sinking down to around 300 m during daytime (Siegel, 2005). The influence of photoperiodic cues and endogenous rhythms on krill DVM was investigated by Gaten et al. (2008), where different rates of activity were detected under constant light/dark conditions. Therefore, they assumed that the photoperiod might not be the major factor in regulating krill DVM, but rather that an endogenous timing system which is instead influenced by an interplay of local food conditions, social interactions, and the light-dark cycle might be involved. Daily rhythms in krill oxygen consumption and energy metabolism which were higher in the laboratory during the dark phase might represent a connection between nocturnal krill DVM patterns and daily rhythms of metabolic regulation (Teschke et al., 2011).
1 Introduction
1.2.2 Seasonal cycles in krill
The high-latitude habitat of krill in the Southern Ocean displays strong seasonal variabilities affecting the dynamics of abiotic and biotic factors over the year. In summer, the environment displays day length of up to 24 h combined with a lack of sea-ice cover, leading to high levels of irradiance at sea surface and increasing primary production. In winter, the situation differs, showing shortened day length (3- 4 h light) and extreme sea-ice extent which leads to a significantly reduced irradiance at sea surface and to the absence of primary production.
To cope with these extreme high-latitude challenges, krill display seasonal cycles of metabolic activity, sexual maturity, and lipid utilization. Adjustments such as low metabolic rates (Teschke et al., 2011; Meyer, 2012; Piccolin et al., 2018b) sexual regression (Kawaguchi et al., 2007) and high lipid utilization (Meyer et al., 2010) are observed in winter, whereas high metabolic rates (Teschke et al., 2007), sexual maturity (Kawaguchi et al., 2006), and low lipid utilization (Teschke et al., 2008) are common during summer. These sequences of seasonal cycles of energy utilization and energy storage should benefit krill during low-food seasons and contribute to an over-wintering strategy (Meyer, 2012). Food availability is generally supposed to be a major driving force behind krill maturity and metabolism as they often correlate in the field, but it is also suggested that metabolic activities might be driven by another different regulatory mechanism (Torres et al., 1994).
On the basis of several laboratory studies, it was concluded that the actual driving mechanism could be the prevailing photoperiod. Indeed, the reaction of krill to high food supply during artificial winter light conditions depended on the prevailing light regime and feeding activity increased with prolonged light period (Atkinson et al, 2002; Teschke et al., 2007; Meyer et al., 2010). In different studies, both sexual maturity and sexual regression in krill were also influenced by changes in artificial seasonal light periods (Teschke et al., 2008; Brown et al., 2010). In fact, under constant dark conditions in the laboratory over months or even years, seasonal changes in krill sexual maturity and metabolic activity were observed (Brown et al., 2013, Kawaguchi et al., 2007, Piccolin et al., 2018b). In one of the latest studies, Piccolin et al. (2018b) ascertained that the annual light regime could possibly trigger the seasonal cycle of metabolic activity in Antarctic krill. In long-term laboratory experiments they simulated seasonal light regimes and detected photoperiodic effects on krill’s metabolic cycle which were also found on gene expression levels (Seear et al., 2009). Ultimately, this leads to the assumption that the seasonal
1 Introduction
cycles in krill are regulated by an endogenous timing system synchronized to the seasonal light conditions in the Antarctic.
1.3 Daily biological processes in organisms are regulated by endogenous clocks
Life on land and in the oceans is determined by multiple rhythmic events, the best known being probably the day/night cycle, the tides, and the annual change of seasons. Because of these rhythmic changes, most organisms have synchronized their physiology and behavior to their environment and therefore evolved an endogenous timing system often referred to as endogenous biological clock (Dunlap, 1999; Strauss and Dircksen, 2010). An endogenous clock system represents a molecular oscillator that is synchronized by rhythmic environmental cues (Zeitgeber, German = time giver) and can respond to them through rhythmic output functions at the metabolic, physiological, or behavioral level. Ultimately, the three classic features of a biological clock are an entrainment to relevant environmental cues, a free-running period, and temperature compensation (Kuhlman et al., 2007; Zhang et al., 2013). Hence, biological clocks have the ability to maintain constant endogenous rhythmicity over a wide temperature range and in the absence of environmental time cues.
1.3.1 The circadian clock regulating biological processes
The circadian clock (from the Latin ‘circa dies’ = ‘about a day’) is the most studied endogenous timing system in all groups of organisms, including plants, animals, fungi, or photosynthesizing cyanobacteria. It is basically a series of circadian or endogenous rhythms that oscillate under constant conditions within 24 h and persist even in the absence of entraining environmental cues (Bell-Pedersen et al., 2005;
Kuhlman et al., 2007). In this case, an internal pacemaker, or clock, controls the endogenous rhythmicity and provides autonomous control of cellular activity levels, thus regulating physiology, metabolism, and behavior in an oscillatory pattern (Strauss and Dircksen, 2010). The most reliable cue affecting the synchronization of the clock and therefore regulating daily rhythms is represented by the day/night cycle, thus light can be considered as the main ‘Zeitgeber’ for the circadian clock.
Other kind of cues including food availability, temperature, and social behavior are also considered as additional Zeitgebers (Gaten et al., 2008; Bell-Pedersen et al., 2005; Kronfeld-Schor et al., 2017).
1 Introduction
1.3.2 The circadian clock on a molecular level using the example of Drosophila At the molecular level, the circadian clock is based on rhythmically expressed so called ‘clock genes’, which are so diverse and interact in such different ways that an independent evolution of the circadian clock in all organisms can be assumed (Dunlap, 1999). The best-studied model organism in terms of eukaryotic circadian clock systems is the fruit fly Drosophila melanogaster and is therefore used as an example in the following.
Central to the circadian clock of Drosophila are negative and positive transcriptional and translational feedback loops controlled by a set of clock genes (Dunlap, 1999). Transcriptional feedback loops consist of sequence-specific DNA binding proteins which stimulate the transcription of their own repressors, thus causing a negative feedback loop (Hardin, 2009). At the beginning, the core clock genes Clock (Clk) and Cycle (Cyc) interact by forming the CLK/CYC heterodimer, and activating respective gene expression by binding to E-box sequences in target promoters (Fig. 1) (Tomioka and Matsumoto, 2015). Within the first feedback loop, the heterodimer CLK/CYC activates the transcription of the core clock genes Period (Per) and Timeless (Tim) around sunset. In a self-sustained negative feedback loop, the transcribed proteins PER and TIM accumulate in the cytoplasm forming the heterodimer PER/TIM at midnight, and translocate into the nucleus to suppress their own transcription by inhibiting the DNA-binding ability of CLK/CYC. The timing of the nuclear entry is regulated through phosphorylation of PER and TIM by the protein kinases SHAGGY (SGG) and DOUBLETIME (DBT). Following this, mRNA levels of Per and Tim decrease to a minimum around dawn and a new cycle of transcriptional activation is then started during the early day.
Furthermore, two additional feedback loops with the associated clock genes Vrille (Vri) and Clockwork orange (Cwo) were identified in Drosophila involving the CLK/CYC heterodimer. Hence, CLK/CYC activates the transcription of the repressor Vri and Par domain protein 1ɛ (Pdp1ɛ), whereby VRI proteins accumulate suppressing the transcription of Clk through a V/P box in the Clk regulatory region.
As PDP1ɛ is accumulating later than VRI, there is a period of time for Clk transcription and accumulation of CLK during the day. The mechanism underlying cyclic expression of Cyc gene remains to be understood. In other insects, this regulatory function is assumed to be fulfilled by nuclear hormone receptor 3 (HR3) and ecdysone induced protein 75 (E75) that are also involved in regulation of molting (Tomioka and Matsumoto, 2015). The general function of this process is still not clear. In the second additional feedback loop, CLK/CYC activates the
1 Introduction
transcription of the repressor Cwo suppressing CLK/CYC-mediated transcription and thus regulates the amplitude of Per and Tim mRNA oscillation. A loss of Cwo results in altered molecular and behavioral rhythms, suggesting this feedback loop might promote robust rhythmicity.
Most circadian clock processes on a molecular level happen in a similar way also in organisms such as mammals or other insects. However, the circadian clock of Drosophila differs by the presence of the clock gene Cryptochrome (d-Cry or Cry1), a blue light photoreceptor, which promotes the light-dependent degradation of TIM, hence entraining the endogenous clock system (Tomioka and Matsumoto, 2015). In addition to Cry1, the clock gene cryptochrome2 (m-Cry or Cry2) is present in
Figure 1: Hypothetical molecular mechnisms of the insect circadian clock in the model organism Drosophila melanogaster – The principal auto regulative feedback loop consists of the transcription factors CLOCK (CLK) and CYCLE (CYC), and the regulators PERIOD (PER) and TIMELESS (TIM). In Drosophila, CHRYPTOCHROME (CRY1) displays a negative regulator and degrades TIM in a light- dependent manner to reset the clock’s phase. CHRYPTOCHROME (CRY2) as an additional negative regulator is not present in Drosophila, but in other arthropods species including the monarch butterfly Danaus plexippus (Zhu et al., 2008; Merlin et al., 2009) and the Antarctic krill (Biscontin et al., 2017).
SHAGGY (SGG) and DOUBLETIME (DBT) regulate the timing of nuclear entry of TIM and PER by phosphorylating both proteins, respectively. In an additional loop, CLK is cyclically expressed by VRILLE (VRI) and PAR DOMAIN PROTEIN 1ɛ (PAR1ɛ), while expression of CYC is still unknown in Drosophila, but proposed to be expressed by HR3 and E75 in other insects. In a second additional loop, CLOCKWORK ORANGE (CWO) is rhythmically expressed. Solid lines indicate pathways known for Drosophila. Dashed lines and grayed out fields indicate hypothesized mechanism in other insects.
[Adapted from Tomioka and Matsumoto, 2015 and Pitzschler, 2018. Modified.]
1 Introduction
mammals and other arthropods (Rubin et al., 2006; Merlin et al., 2009), where the mRNA expression level peaks at sunset (as levels of Tim and Per) and the transcribed protein CRY2 forms a complex with PER/TIM to inhibit CLK/CYC. In contrast to CRY1, CRY2 has lost the ability of photoreception (Tomioka and Matsumoto, 2015).
1.3.3 The circadian clock in marine organisms
In terrestrial animals, circadian clocks are well-studied using model organisms in arthropods or mammals (such as Drosophila and mouse). Far fewer studies have investigated the principles of the circadian clock in marine organisms. Terrestrial and marine organisms are exposed to different rhythmic environmental cues (e.g.
tidal rhythm) due to their physical habitat, which may lead to different timekeeping functions (Tessmar-Raible et al., 2011). In the marine environment, some studies revealed an effect of temperature (Lahiri et al., 2005) and food availability (Cavallari et al., 2011; Aguzzi et al., 2011) on circadian clocks and furthermore assume an influence on circadian clock functions by endogenous noncircadian clocks (Zantke et al., 2013). Rhythmic circadian behaviors can include rhythms of feeding/fasting, rhythms of sleep/wake or rhythms related to reproduction (e.g. mating and spawning) and are not restricted to periods of 24 h including also bimodal patterns with 12 h periods (e.g. to cope with tidal cycles) (Tessmar-Raible et al., 2011; Gaten et al., 2008).
Among others, circadian rhythmicity activities incl. clock functions have also been investigated in crustaceans, for example in relation to locomotion, reproduction, metabolism, and developmental processes (Strauss and Dircksen 2010). The pacemaker of circadian clocks in crustacea, as in many other animals, is located in the nervous system. For the intertidal isopod Eurydice pulchra tidal cycles of swimming in parallel to circadian 24 h rhythms in behavioral, physiological, and molecular phenotypes were demonstrated by Zhang et al. (2013), with the assumption that the circadian pacemakers are located in the brain. In the Norwegian lobster Nephrops norvegicus, candidate clock genes including a vertebrate-like Cry2 were identified within the eyestalk tissues of the species (Sbragaglia et al., 2015).
So far, no crustacean single central brain oscillator or master has been identified (Strauss and Dircksen 2010). Therefore, Strauss and Dircksen (2010) assumed that several neuronal tissues might act together in a complex system, which contains distinct oscillators located in the brain (supraoesophageal ganglion), the retina of the eye, the eyestalks, and the caudal photoreceptors.
1 Introduction
1.4 The circadian clock in Euphausia superba, and mechanisms of regulation The level of knowledge of circadian regulation in non-model marine organisms is low, and even less is known about those regulations in high-latitude pelagic zooplankton species like the Antarctic krill. As a pelagic species, krill might not be affected by tidal rhythms but they still perform DVM and are therefore subjected to daily changes in light spectral composition and light intensity.
As one of the first, Mazzotta et al. (2010) recorded circadian clock gene activity over 24 h in wild krill during Antarctic summer and identified the presence of Cryptochrome2 (EsCry2), a krill orthologue of the mammalian-like Cry2 (m-Cry2) gene. Although an ancestral form of circadian feedback loop was assumed in krill because of the presence of EsCry2, daily expression levels did not coincide with previous findings in the honeybee, Apis mellifera, and in the monarch butterfly, Dana plexippus (Rubin et al., 2006; Zhu et al., 2008). However, entrainment of clock functions may follow the rhythms of alternative Zeitgebers, since even in the absence of clear light/dark cues daily Cry2 expression levels showed daily oscillation. Mazzotta et al. (2010) supposed light spectral composition to be the major influence, since EsCry2 oscillation did not show any apparent link with the daily cycle of light intensity. Based on these field findings, Teschke et al. (2011) conducted laboratory analyses to determine if an endogenous rhythm could be detected in krill clock gene activity at the molecular level and whether the regulation of rhythmic output functions in physiology was influenced. During the experiments, daily gene expression of EsCry2 were determined under simulated long-day conditions (16 h light: 8 h darkness, LD 16:8) and constant darkness (DD). Under both conditions Cry2 displayed daily oscillation in mRNA levels, which also correlated with metabolic-related enzyme activity profiles underlying the endogenous nature of the circadian timing system in krill with a putative link to metabolic key processes (Teschke et al., 2011). Summer field samples of Mazzotta et al. (2010) were used in the laboratory analysis of De Pittà et al. (2013) investigating the krill transcriptome over daily cycles. Daily oscillations with periods of either 24 h or 12 h were detected for 8 % of the transcriptome reflecting a chronological progression of biochemical and physiological events throughout the 24 h cycle. Thus an endogenous circadian clock seems to control the krill metabolism in the high-latitude environment during summer.
The most important findings for the functional characterization of the circadian clock in krill came from Biscontin et al. (2017) and Hunt et al. (2017), who identified putative krill orthologues of the core clock components by screening online
1 Introduction
databases containing the krill transcriptome (Hunt et al., 2017; Sales et al., 2017).
Beyond that, Biscontin et al. (2017) proposed a circadian clock model for the Antarctic krill and defined the role of core clock components within the circadian feedback loop (Fig. 2). Within the core feedback loop, the krill clock proteins CLK (EsCLK) and CYC (EsCYC) displayed the positive regulators, like in Drosophila, whereas PER (EsPER), TIM (EsTIM), and CRY2 (EsCRY2) displayed putative negative regulators, like in the monarch butterfly, D. plexippus. In krill, EsPER and EsTIM interacted with various kinases among others EsSGG, EsDBT, or EsVRI.
Significant daily rhythmic expression patterns in krill were observed for the core clock genes EsClock, EsCycle, EsPeriod, EsTimeless, and EsCryptochrome2 (Biscontin et al., 2017). Despite the strong annual variability at high-latitude regions, light is still suggested as main Zeitgeber in krill with a light-entrainment occurring among others through the blue-light photoreceptor CRY1 (EsCRY) and krill opsins (Biscontin et al., 2016; Biscontin et al., 2017; Piccolin et al., 2018b).
Figure 2: Schematic representation of the putative circadian clock in Antarctic krill – The two main feedback loops are indicated, containing CLK, CYC as positive elements and PER, TIM, and CRY2 as negative elements, whereas negative elemetns interact to suppress the activation of the positive elements. The blue-light photoreceptor CRY1, is activated by light and causes degradation of TIM, releasing PER/TIM suppression from CLK/CYC. Identified clock components in Antarctic krill are colored, while components with no functional characterization are greyed. Modified after Biscontin et al., 2017.
1 Introduction
1.5 Challenges to circadian regulation in high-latitude species
The control of biochemical and physiological processes by an endogenous circadian clock plays a central role in the adaptive success of the high-latitude key species Antarctic krill, especially in the regulation of DVM and the seasonal life cycles. One persisting question is if the circadian regulation incl. clock functions remains active during summer and winter due to the extreme kight conditions at those times of the year. Circadian timing mechanisms and potential regulation were studied both in wild krill during summer conditions (Mazzotta et al., 2010; de Pittà et al., 2013) and in the laboratory under different artificial seasonal light regimes (Piccolin et al., 2018; Teschke et al., 2011; Biscontin et al., 2017), but still information on clock gene activity and rhythmic activities promoted by alternative light cues is scarce. In addition, according to our knowledge, field studies concerning the circadian clock functions in krill during winter conditions are still missing. Moreover, the current increasing anthropogenic-driven warming accelerates changes in the Southern Ocean environment, which might affect the synchronization between endogenous and external factors, creating a ‘match- mismatch’ scenario in circadian rhythmicity with potential negative effects for the occurring krill population. Hence, it is essential to investigate the capability of krill to regulate their endogenous circadian timing system under natural extreme environmental changes during seasons.
1 Introduction
1.6 Aim of study
The present study investigated clock gene expression in wild Antarctic krill during winter conditions to give a first basic impression about what happens in clock functions, since so far only field studies in summer have been conducted. Within this thesis, wild krill from the Bransfield Strait, Southern Ocean, were sampled every 3.5 h over a 24 h cycle during a winter cruise in order to examine:
i) putative rhythmic gene expression patterns of clock genes (Clock, Cycle, Period, Timeless, Cryptochrome2, Doubletime, Shaggy, Clockwork orange, Vrille, E75) and the metabolic gene Atpg.
Additionally, previous findings regarding clock gene expression in krill under laboratory and field conditions often showed high variance among biological replicates together with low amplitude of different gene expression, leading to poor statistical power to detect significant rhythmicity. In order to optimize these sources of interference, a tissue-specific examination was tested in the present work with the following sub-targets:
ii) tissue-specificity of clock gene expression in different tissues (brain and eyestalks) to identify potential interactions or co-regulations between clock genes and specific tissues
iii) efficiency of different clock gene primer sets (Clock and Timeless) to draw conclusions on the accuracy of clock gene expression quantification in different tissues of krill
2 Material and Methods 2 Material & Methods
2.1. Time-series sampling of E. superba in the field
Field samples of E. superba from a 24 h time series were collected in austral winter in the Atlantic sector of the Southern Ocean. The RNA of brain and eyestalks tissues was extracted and converted to cDNA. Via TaqManTM qPCR and a modified 2-ΔΔCt normalization method, daily gene expression profiles of clock genes were generated and tested for rhythmicity (between 12h and 24 h) or significant differences among tissues.
Samples of E. superba were collected in West Antarctica in the Bransfield Strait (62°-64°S, 56°-62°W), between the South Shetland Islands and the Antarctic Peninsula. Different stations were sampled between 4th and 31st August 2016 in the framework of the Antarctic Marine Living Resources (AMLR) program, during the voyage NBP1606 with the research icebreaker RVIB Nathaniel B. Palmer from the National Oceanic and Atmospheric Administration (NOAA). Krill were caught using a 1.8 m (2.54 m² mouth area) Isaacs-Kidd midwater trawl (IKMT) equipped with a 505 µm mesh net. The volume of sea water filtered during trawlings, was quantified using a General Oceanic flow meter (model 2930R) attached on the depressor frame in front of the net. All tows were double-oblique to 170 meters (m) depth of the water column. Real-time tow depths were deduced from a pressure sensor mounted on the trawl bridle. Tow speeds were ~2 knots, with volumes filtered averaging
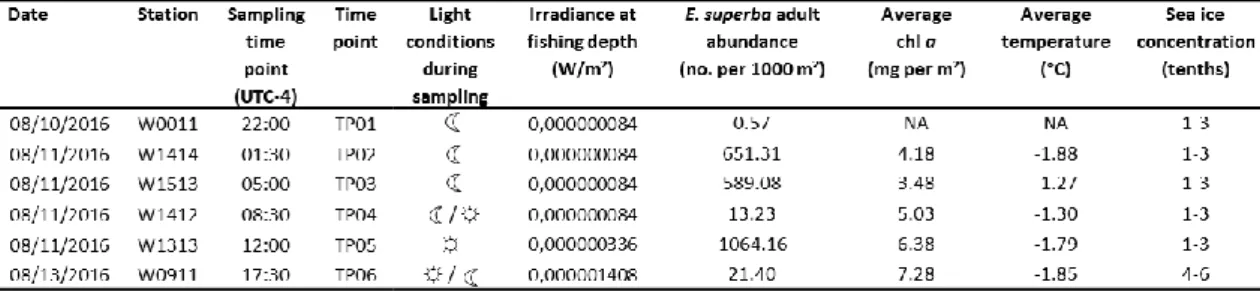
~3621 m³. Krill abundance was standardized to no. m-2 based on volume of water filtered at each time point multiplied by the depth of the tow. To get a time series covering one entire 24 h cycle, E. superba was caught with a regular time interval of 3.5 hours within Bransfield Strait starting on 22:00 on August 10th until 12:00 on August 11th for a total of 5 time points (TP). The last time point (TP06) of the time series was collected at 17:30 on 13th August (Fig. 3, Tab. 1). The longer interval of time occurring between TP05 and TP06 was due to unfavorable weather conditions together with operational issues regarding the sampling grid schedule of the AMLR expedition. The biomass of adult E. superba between time points and stations were highly variable, ranging from 0.57 no. m-2 on August 10th (22:00 UTC-4) over 651 no.
m-2 (01:30 UTC-4), 13 no. m-2 (08:30 UTC-4), and 1064 no. m-2 (12:00 UTC-4) on August 11th to 21.4 no. m-2 on August 13th (Tab. 1).
2 Material and Methods
2.2 Average integrated chlorophyll a determination and water temperatures Chlorophyll a (chl a) concentration is used as a proxy for the available food in the water column for Antarctic krill. At each station, conductivity, temperature, and depth (CTD) were measured with a SBE9/11 (SBE Inc.), equipped with 10 l bottles for water sampling. These bottles were closed during the upcast at 750, 200, 100, 75, 50, 40, 30, 20, 15, and 5 m respectively. Chlorophyll a concentrations were detected fluorometrically following Holm-Hansen et al. (1965) and for each station the average integrated chl a (to 100 m depth; mg chl a m-2) was calculated (Reiss et al., 2009). The average chl a concentration was generally higher during daytime with values of 6.38 and 7.28 mg chl a m-2 (August 11th, 12:00 and August 13th, 17:30) compared to nighttime where measured chl a concentrations varied between ~ 3.5
Figure 3: Study area incl. stations where krill was sampled – A) Krill sampling stations during AMLR 2016 NBP 1606 cruise. B) Stations W011 to W1513 were sampled every 3.5 hours for a time period of 24 h, except for TP06. E. superba was caught between 56°- 62°W latitude and 62°- 64°S longitude in the Bransfield Strait between the South Shetlands Islands and the Antarctic Peninsula. UTC-4 = Coordinated Universal Time minus 4 hours, indicates the local time in Bransfield Strait, Antarctica at time of sampling. [Reference: Map Data © 2019 Google. Modified.]
A
B
2 Material and Methods
to 5.0 (August 11th 01:30 to 08:30) (Tab. 1). There are no chl a and temperatures data for August 10th. The water temperatures remained constant between -1.80°C during the day and -1.30°C during the night (Tab. 1).
2.3 Irradiance at fishing depth and sea-ice concentration data
Surface irradiance was measured with the Biospherical Instruments’ Quantum Scalar Reference Sensor (QSR-240) on mast the research vessel. The QSR-240 is a surface (non-submersible) instrument for monitoring total incident photosynthetically active radiation from the sun and sky. Photosynthetically available radiation (PAR) denotes the spectral range of solar radiation from 400 to 700 nanometers utilized by photosynthetic organism to perform photosynthesis.
Measured PAR at surface in the Bransfield Strait was indicated in units of µEinstein/m²/s² and was converted to W/m² to determine irradiance at sampling depth (1 W/m² ≈ 4.6 µEinstein/m²/s²). The actual solar irradiance at 170 m depth was calculated according to Mazzotta et al., (2010) using the following formula:
𝐼𝑍 = 𝐼0𝑒− (𝐾𝑑𝑍)
For all time points, the calculated irradiance at fishing depth was very low (Tab. 1).
At the surface, we found a light/dark cycle with sunrise approx. at 08:00, sunset approx. at 16:00 and dusk at approx. 17:00 UTC-4 and irradiance at the sea surface of 2 to 8 W/m² during the day and of 34 W/m² at dusk. However, we must consider that: i) at fishing depth, the actual levels of irradiance might have been extremely low over the entire 24 h cycle (Tab. 1) and ii) due to DVM and/or twilight DVM before sampling, E. superba might have occurred at different depths with respect to the actual fishing depth. Therefore, it is impossible to predict the exact photoperiod to which krill was exposed, but we can assume that krill were exposed to a maximum of 8 daily hours of light (when occurring close to the surface at all times) and a minimum of almost zero daily hours of light (when occurring at fishing depth or deeper at all times).
Sea-ice concentration data for August 10th, 11th and 13th, 2016 were extracted from the U.S. National Ice Center (https://www.natice.noaa.gov). The ice concentration is reported in tenths (0/10 to 10/10). For August 10th and 11th, the sea- ice concentration showed consistent low values of 1-3 tenths with new and young ice, while on August 13th the ice concentration rose slightly to 4-6 tenths (Tab. 1).
2 Material and Methods
2.4 Selecting and processing of E. superba
Immediately after each IKMT trawl, all zooplankton were sorted and krill was separated first. Hence, a subsample of up to 100 adult krill was measured. Total body length (mm) was determined by measuring the distance from the tip of the rostrum (forward extension of the carapace) to the posterior tip of the uropods (appendages of the last body segment) (Standard 1 as described by Mauchline, 1980). After measuring, krill was directly frozen in liquid nitrogen and stored at -80°C until further processing.
From each subsample, we selected the experimental krill to use for molecular analysis based on the following parameters: (i) body lengths between 40 and 50 mm to ensure same development stages and a sufficient amount of RNA; (ii) a balanced male/female ratio; (iii) damaged samples were neglected. Based on these parameters, it was possible to select 10 biological replicates per time point, with the exception of TP06 where only 7 samples were suitable for further chronobiologic analyses. In total, 57 frozen E. superba sampled during AMLR2016 cruise were chosen for brain- and eyestalk-specific gene expression analysis.
2.4.1 Tissue separation and processing
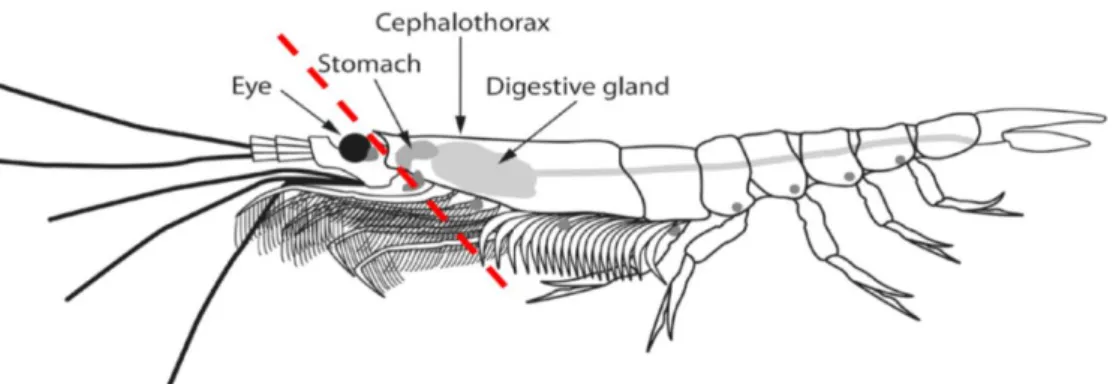
In a first step, the head was separated from the rest of the body. Therefore each frozen krill sample was stored on dry ice and the head was cut off with a scalpel in a skewed angle directly behind the eyes without damaging the stomach (Fig. 4).
Heads were stored in pre-chilled 1 ml RNAlaterTM-ICE Tissue Transition Solution
Table 1: Environmental data from August 10th, 11th, and 13th, 2016 – Data were taken in West Antarctica in the Bransfield Strait stratum (62°-64°S, 56°-62°W), between the South Shetland Islands and the Antarctic Peninsula at different stations in August 2016. UTC-4 = Coordinated Universal Time minus 4 hours, indicates the local time in Bransfield Strait, Antarctica at time of sampling.
*average chl a: in the upper 100 m
*average temperature: in the upper mixed layer (200 to 300 m depth)
*irradiance: calculated as in Mazzotta et al.,2010
2 Material and Methods
(Thermo Fisher Scientific, InvitrogenTM Ambion Life technologies, USA) overnight (at least 16 h) at -20°C in 2 ml EppendorfTM Safe-Lock Tubes (Eppendorf AG, Germany) to allow thawing with minimized RNA degradation. After cleaning heads from antennae, endopods, and chitin the remaining brain-eyestalks-retinae complexes (Fig. 5a) were retransferred into the 1 ml RNAlaterTM-ICE solution and kept at -20°C for later dissections of tissues.
2.4.2 Dissection of eyestalk and brain tissue
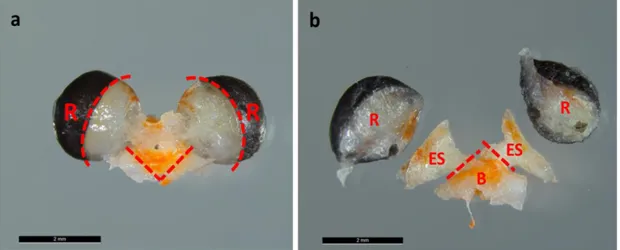
Putative circadian oscillators are assumed to be found in the head of crustacean in particular within the retinae of the compound eye, the eyestalks, and the brain (Strauss and Dircksen 2010; Fig. 5). Based on this assumption, we decided to measure clock gene expression in the eyestalks and in the brain of E. superba. We excluded the retinae because clean RNA extraction was not possible due to contaminations by visual pigments.
Figure 4: Separation of head from the rest of the body of E. superba – Head was cut off in a skewed angle behind the eyes without damaging the stomach. The dashed red line indicates the separation. Modified. [Reference: https://link.springer.com/chapter/10.5822/978-1-61091-854-1_1]
Figure 5: Schematic representation of circadian oscillators in crustacean head - Localization of the circadian oscillators in the head of a generic crustacean (modified after Strauss and Dircksen, 2010). Putative oscillators are indicated as small sinus waves within the retinae of the compound eye, the eyestalks, and the brain.
2 Material and Methods
Dissection of eyestalk and brain tissues was performed under a binocular microscope (Leica MZ125) with cooling chambers for Petri dishes keeping the samples chilled (~2°C). The brain-eyestalks-retinae complexes (Fig. 6a,b) were dissected into brain (B), eyestalks (ES), and retinae (R) by using tweezers and fine scissors. First, the retinae were separated from the eyestalks. It was cut as close as possible to the transition zone between retinae and eyestalks (see rounded dashed line near retinae, Fig. 6a), avoiding contaminations of the eyestalks by visual pigments from the retinae. Any remnants of pigments on the eyestalks were carefully removed prior to RNA extraction to avoid possible interferences during RNA concentration measurements. Hereafter, eyestalks (ES) were severed near the brain (B) (Fig. 6b) and chitin leftovers as well as irrelevant tissues were removed from the brains (see straight dashed line Fig. 6a). The separated retinae of the krill samples were stored in 500 µl RNAlater™-ICE Tissue Transition Solution and were not further used for this study. Dissected brain and eyestalk tissues were stored individually in 300 μl RNAlater™-ICE solution at -20°C for later RNA extraction.
2.5 RNA extraction
RNA of eyestalks and brain tissues was extracted using the Direct-zolTM RNA MicroPrep kit (Zymo Research, USA). Before tissue homogenization, 300 µl chilled TRIzolTM Reagent (Thermo Fisher Scientific, USA) was pipetted into 0.5 ml PrecellysTM tubes (Bertin Technologies S.A.S, France) containing 1.4 mm ceramic
Figure 6: Separation of E. superba head and dissection of tissues – a) Exemplary brain-eyestalks- retinae complex. Dashed red lines indicate the cut surfaces used to separate retinae (R) from eyestalks without contamination and to remove the excess tissues at the base of the brain. b) Exemplary brain-eyestalks complex with dissected retinae. Dashed red lines indicate the cut surfaces used to cut off the eyestalks (ES) from the brain (B). Binocular microscope pictures with a dimensional scaling of 2 mm.