Corresponding address: Centre for Earth Evolution and Dynamics (CEED), Department of Geosciences, University of Oslo, PO Box 1028, N-0315 Oslo, Norway
Supporting Information for ”A new tectono-magmatic model for the Lofoten/Vester˚alen Margin at the outer limit of the Iceland
Plume influence”
Asbjørn Johan Breivik
a,, Jan Inge Faleide
a, Rolf Mjelde
b, Ernst R. Flueh
c, Yoshio Murai
daCentre for Earth Evolution and Dynamics (CEED), Department of Geosciences, University of Oslo, Norway
bDepartment of Earth Science, University of Bergen, Norway
cIFM-Geomar, Leibniz-Institute for Marine Sciences, Kiel, Germany
dInstitute of Seismology and Volcanology, Hokkaido University, Sapporo, Japan
1. Introduction
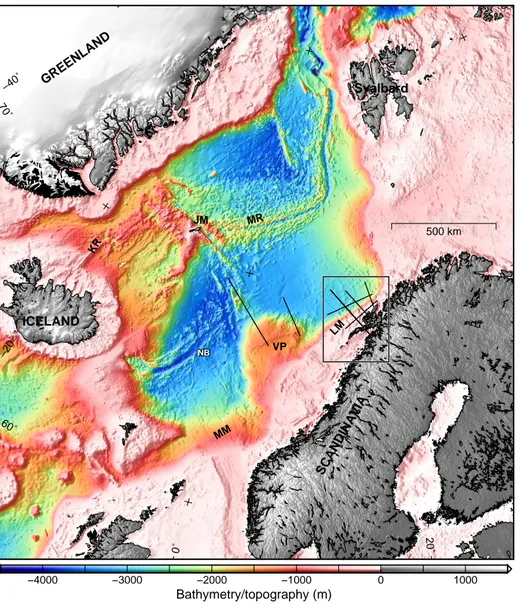
The supplementary material documents the complete wide-angle seismic data set, interpre- tation, ray tracing, and travel-time fit. A large map of the region is shown in Figure 1, while profile and instrument locations are shown in Figure 2. Large versions of the gravity and magnetic anomaly maps are in Figures 3-4. All seismic data and models are shown in Figures 5-20. Seismic phases constraining the crystalline crust are indicated for each data set: P
xsedimentary refraction, P
g1upper basement refraction, P
g2middle basement refraction, P
g3lower basement refraction, and P
g4lower crustal body refraction, P
nupper mantle refraction, P
CP top lower crustal body re- flection, P
GP various intra-basement reflections, and P
MP Moho reflection. The velocity model is repeated here in Figure 21.
Email addresses:a.j.breivik@geo.uio.no(Asbjørn Johan Breivik )
References
Berndt, C., Planke, S., Alvestad, E., Tsikalas, F., Rasmussen, T., 2001. Seismic volcanostratigraphy of the Norwegian Margin: constraints on tectonomagmatic break-up processes. J. Geol. Soc. 158, 413–426.
Jakobsson, M., Mayer, L. A., Coakley, B., Dowdeswell, J. A., Forbes, S., Fridman, B., Hodnesdal, H., Noormets, R., Pedersen, R., Rebesco, M., Schenke, H.-W., Zarayskaya, Y., Accettella, A. D., Armstrong, A., Anderson, R. M., Bienhoff, P., Camerlenghi, A., Church, I., Edwards, M., Gardner, J. V., Hall, J. K., Hell, B., Hestvik, O. B., Kristoffersen, Y., Marcussen, C., Mohammad, R., Mosher, D., Nghiem, S. V., Pedrosa, M. T., Travaglini, P. G., Weatherall, P., 2012. International Bathymetric Chart of the Arctic Ocean (IBCAO) Version 3.0. Geophys. Res.
Lett. 39 (L12609).
Olesen, O., Ebbing, J., Lundin, E., Mauring, E., Skilbrei, J. R., Torsvik, T. H., Hansen, E. K., Henningsen, T., Midbøe, P., Sand, M., 2007. An improved tectonic model for the Eocene opening of the Norwegian-Greenland Sea: Use of modern magnetic data. Mar. Petrol. Geol. 24, 53–66.
Olesen, O., Gellein, J., Gernigon, L., Kihle, O., Koziel, J., Lauritsen, T., Mogaard, J. O., Myklebust, R., Skilbrei, J. R., Usov, S., 2010. Magnetic anomaly map, Norway and adjacent areas, 1:3 million.
−40˚
−20˚
0˚
20˚
60˚
70˚
−40˚
−20˚
0˚
20˚
60˚
70˚
500 km JM MR
KR
NB
NB VP
LM
MM ICELAND
SCANDINAVIA GREENLAND
Svalbard
−4000 −3000 −2000 −1000 0 1000
Bathymetry/topography (m)
Figure 1: Bathymetry map with the location of the Euromargins 2003 OBS survey (lines inside box). VP: Vøring Plateau, JM: Jan Mayen, KR: Kolbeinsey Ridge, LM: Lofoten Margin, MM: Møre Margin, MR: Mohn Ridge, NB:
Norway Basin.
12˚ 14˚ 16˚
67˚
68˚
69˚
70˚
12˚ 14˚ 16˚
67˚
68˚
69˚
70˚
0 50
km
70 71 57
58
61 63
65 66
67 68
69 61
67
6 7 8
9 11 Profile 9−03
Profile 5−03
Profile 6−03
Profile 7−03
Profile 8−03
Lofoten
Vesterålen
Utrøst Ridge
Jennegga High
Vestfjorden Basin Ribban Basin
ELL?
OH?
OH?
−4000 −3500 −3000 −2500 −2000 −1500 −1000 −500 0 500 1000 1500 2000 Depth (m)
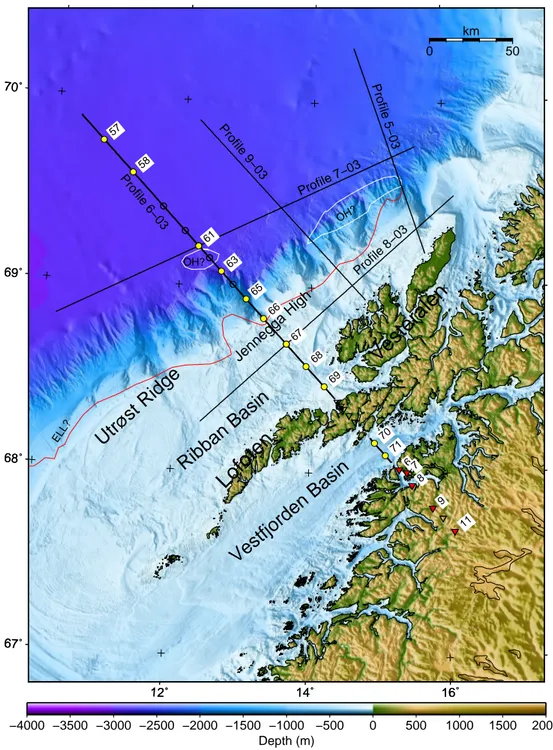
Figure 2: 200 m resolution topography and sidescan bathymetry based on 50 m resolution data from http://www.kartverket.no ( cKartverket) with Euromargins 2003 OBS lines. Deep ocean bathymetry is IBCAO v.3 (Jakobsson et al., 2012). OBS positions on Profile 6 (bold, black line) are shown with yellow-filled circles, and land stations with red-filled, inverted triangles. Unfilled symbols mark failed stations. Red line shows the proposed eastern limit of lava (ELL?), and white lines outer volcanic highs (OH?) from Berndt et al. (2001).
12˚ 14˚ 16˚ 18˚
67˚
68˚
69˚
70˚
12˚ 14˚ 16˚ 18˚
67˚
68˚
69˚
70˚
−100
−100
−100
−90
−90
−90
−80
−80
−80
−2500
−2000−1500−1000
−500
−500
0 100
km
70 71 57
58
61 63
65 66
67 68
69 61
67
6 7 8
9 11
Profile 9−03
Profile 5−03
Profile 6−03
Profile 7−03
Profile 8−03
Lofoten
Vesterålen
Utrøst Ridge
Jennegga High
Vestfjorden Basin Ribban Basin
TIB
SDR?
ELL?
OH?
OH?
−150 −125 −100 −75 −50 −25 0 25 50 75 100 125 150
F.A./Bouguer Gravity (mGal)
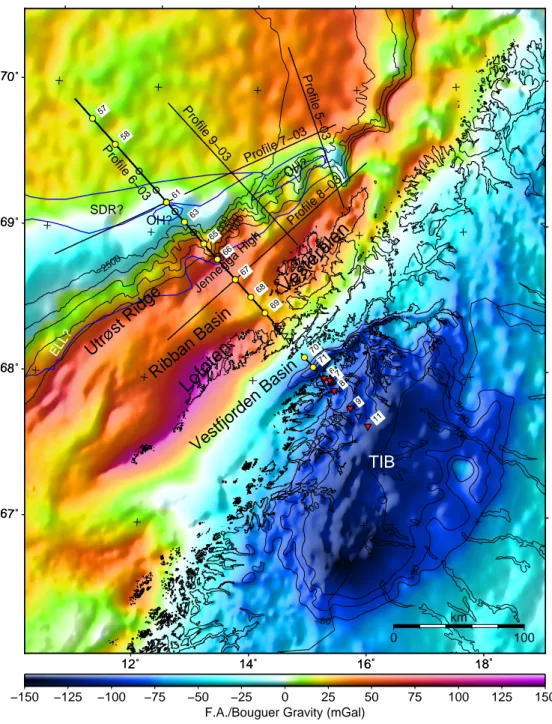
Figure 3: Free-air gravity (marine) and Bouguer gravity onshore with Euromargins 2003 OBS lines (Olesen et al., 2010). Swedish data cGeological Survey of Sweden. Onshore contours show gravity values of -80, -90, and -100 mGal. Offshore contours show depth values at 500 m intervals. OBS positions on Profile 6 (bold, black line) are shown with yellow-filled circles, and land stations with red-filled, inverted triangles. White lines show magmatic interpretation from Berndt et al. (2001); ELL?: Eastern limit lava?, OH?: Outer volcanic highs?, SDR?: Seaward dipping reflector sequence?, TIB: Trans-Scandinavian Igneous Belt body.
12˚ 14˚ 16˚ 18˚
67˚
68˚
69˚
70˚
12˚ 14˚ 16˚ 18˚
67˚
68˚
69˚
70˚
−2500
−2000−1500−1000
−500
−500
0 100
km
70 71 57
58
61 63
65 66
67 68
69 61
67
6 7 8
9 11
Profile 9−03
Profile 5−03
Profile 6−03
Profile 7−03
Profile 8−03
Lofoten
V es te rå le n Vesterålen
Utrøst Ridge
Jennegga High
Ve st fjo rd en B as in Vestfjorden Basin R ib ba n B as in
Ribban Basin
SDR?
ELL?
OH?
OH?
−1000 −500 0 500 1000 1500 2000 2500 3000
Magnetic anomalies (nT)
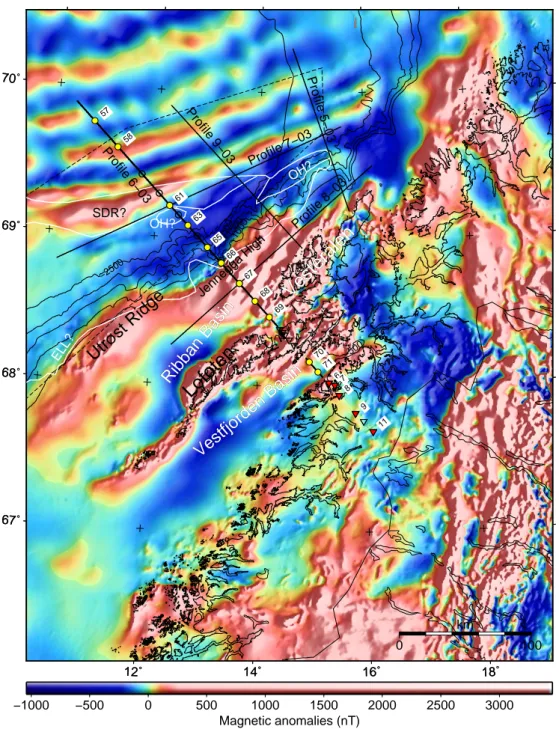
Figure 4: Regional magnetic anomalies (Olesen et al., 2007, 2010). Swedish data cGeological Survey of Sweden.
The new RAS-03 survey is indicated by the dashed line. Bathymetric contours at 500 m intervals are shown on top of both grids. Euromargins 2003 OBS lines are also shown, with OBS positions (yellow-filled circles) and land stations (red-filled, inverted triangles) on Profile 6-03. White lines show magmatic interpretation from Berndt et al.
(2001); ELL?: Eastern limit lava?, OH?: Outer volcanic highs?, SDR?: Seaward dipping reflector sequence?, TIB:
Trans-Scandinavian Igneous Belt body.
T -D/8.0 (s)
Distance (km)
Profile 6-03: OBS-57, vertical
0 1 2 3 4 5 6 7 8 9 10
0 10 20 30 40 50 60 70 80 90 100
T -D/8 (s) P
g3P
g1P
g2P
g2P
g1P
xP
n10 9 8 7 6 5 4 3 2 1 0
P
xProfile 6-03, OBS-57 Distance (km)
Depth (km)
0
40 35 30 25 20 15 10 5
0 50 100 150 200 250 300
NW Utrøst Ridge Lofoten SE
B
C A
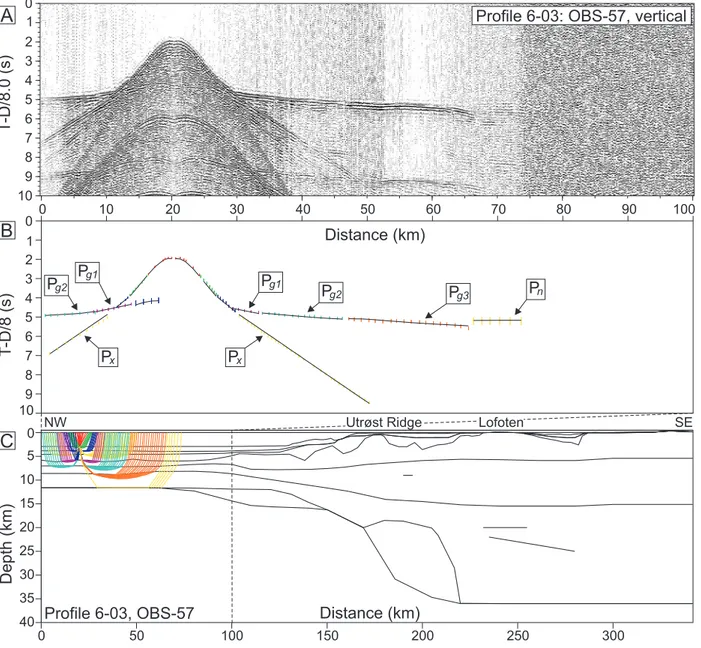
Figure 5: Data, interpretation, and ray tracing of OBS 57, Profile 6-03. A: OBS data, vertical component, offset- dependent scaling. B: Interpretation (vertical bars) and model prediction (solid lines). C: Ray tracing of the velocity model.
T -D/8.0 (s)
Distance (km)
Profile 6-03: OBS-58, vertical
0 1 2 3 4 5 6 7 8 9 10
0 20 40 60 80 100 120 140
P
MP
T -D/8 (s) P
g3P
g1P
g2P
g2P
g1P
xP
n10 9 8 7 6 5 4 3 2 1 0
P
xP
nP
MP
Profile 6-03, OBS-58 Distance (km)
Depth (km)
0
40 35 30 25 20 15 10 5
0 50 100 150 200 250 300
NW Utrøst Ridge Lofoten SE
B
C A
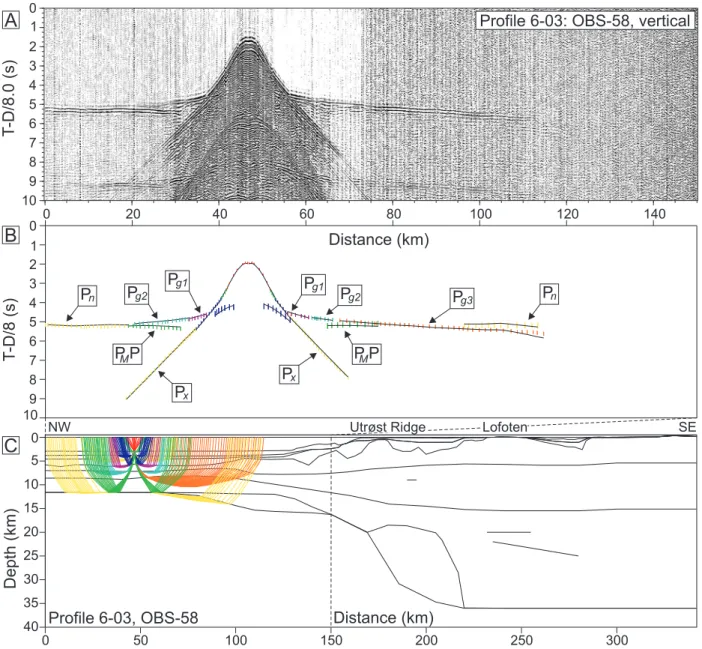
Figure 6: Data, interpretation, and ray tracing of OBS 58, Profile 6-03. A: OBS data, vertical component, offset- dependent scaling. B: Interpretation (vertical bars) and model prediction (solid lines). C: Ray tracing of the velocity model.
20 40 60 80 100 120 140 160 180 200 220 240 260 280
T -D/8.0 (s)
Distance (km)
Profile 6-03: OBS-61, vertical
0 1 2 3 4 5 6 7 8 9 10
0
P
MP
T -D/8 (s)
P
g3P
g1P
g2P
g2P
g1P
n10 9 8 7 6 5 4 3 2 1 0
P
nP
xP
MP P
nP
CP
Profile 6-03, OBS-61 Distance (km)
Depth (km)
0
40 35 30 25 20 15 10 5
0 50 100 150 200 250 300
NW Utrøst Ridge Lofoten SE
B
C A
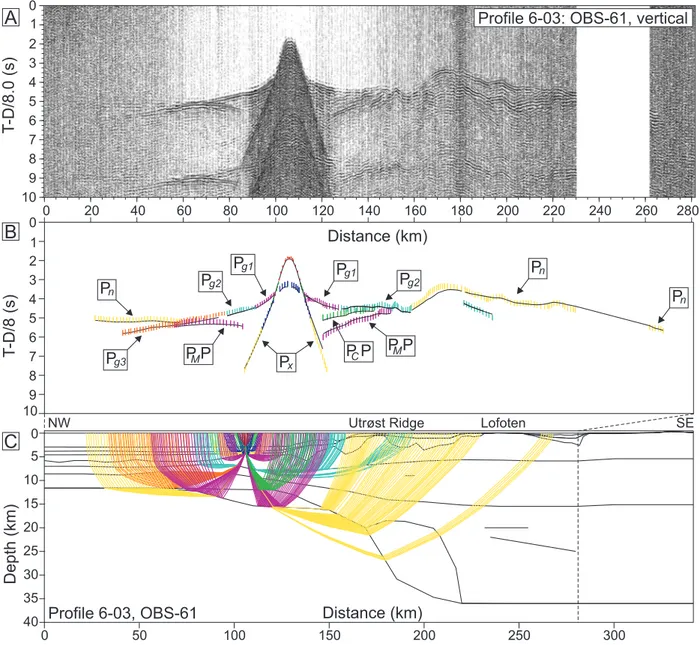
Figure 7: Data, interpretation, and ray tracing of OBS 61, Profile 6-03. A: OBS data, vertical component, offset- dependent scaling. B: Interpretation (vertical bars) and model prediction (solid lines). C: Ray tracing of the velocity model.
T -D/8.0 (s)
Distance (km)
Profile 6-03: OBS-63, vertical
0 1 2 3 4 5 6 7 8 9 10
60 80 100 120 140 160 180 200 220 240 260 280
P
CP P
nT -D/8 (s)
P
g1P
g2P
g2P
g1P
n10 9 8 7 6 5 4 3 2 1 0
P
nP
MP P
g3Profile 6-03, OBS-63 Distance (km)
Depth (km)
0
40 35 30 25 20 15 10 5
0 50 100 150 200 250 300
NW Utrøst Ridge Lofoten SE
B
C A
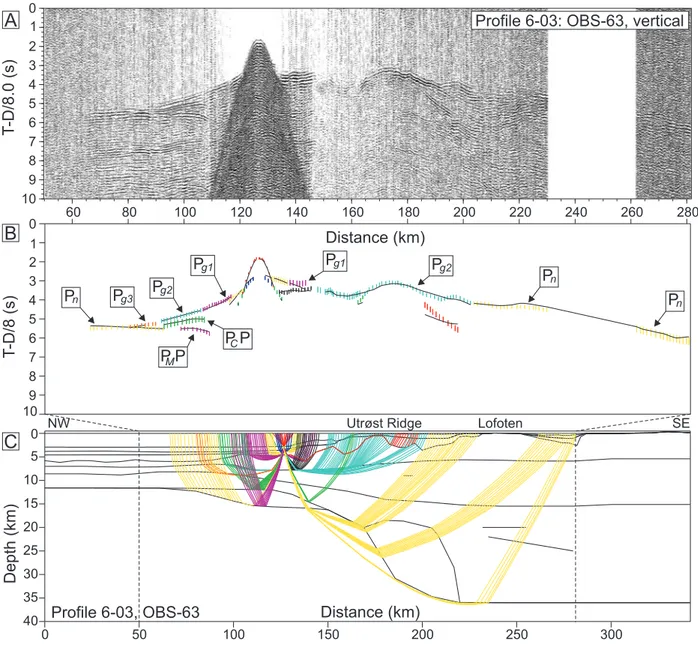
Figure 8: Data, interpretation, and ray tracing of OBS 63, Profile 6-03. A: OBS data, vertical component, offset- dependent scaling. B: Interpretation (vertical bars) and model prediction (solid lines). C: Ray tracing of the velocity model.
T -D/8.0 (s)
Distance (km)
Profile 6-03: OBS-65, vertical
0 1 2 3 4 5 6 7 8 9 10
60 80 100 120 140 160 180 200 220 240 260 280
T -D/8 (s)
P
g2P
g1P
g2P
g4P
g110 9 8 7 6 5 4 3 2 1 0
P
xP
g2P
CP
Profile 6-03, OBS-65 Distance (km)
Depth (km)
0
40 35 30 25 20 15 10 5
0 50 100 150 200 250 300
NW Utrøst Ridge Lofoten SE
B
C A
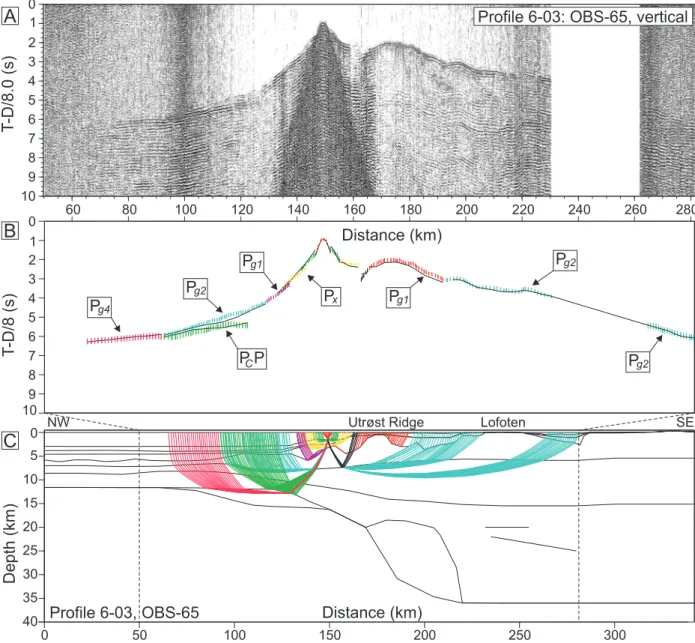
Figure 9: Data, interpretation, and ray tracing of OBS 65, Profile 6-03. A: OBS data, vertical component, offset- dependent scaling. B: Interpretation (vertical bars) and model prediction (solid lines). C: Ray tracing of the velocity model.
60 80 100 120 140 160 180 200 220 240 260 280
T -D/8.0 (s)
Distance (km)
Profile 6-03: OBS-66, vertical
0 1 2 3 4 5 6 7 8 9 10
T -D/8 (s)
P
g1P
g3P
g2P
g1P
n10 9 8 7 6 5 4 3 2 1 0
P
g1P
g4P
CP
P
GP
Profile 6-03, OBS-66 Distance (km)
Depth (km)
0
40 35 30 25 20 15 10 5
0 50 100 150 200 250 300
NW Utrøst Ridge Lofoten SE
B
C A
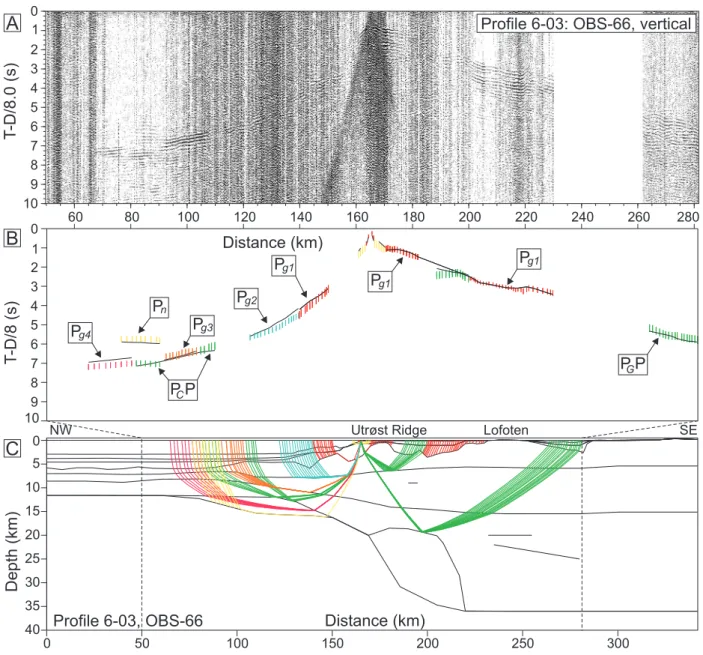
Figure 10: Data, interpretation, and ray tracing of OBS 66, Profile 6-03. A: OBS data, vertical component, offset- dependent scaling. B: Interpretation (vertical bars) and model prediction (solid lines). C: Ray tracing of the velocity model.
60 80 100 120 140 160 180 200 220 240 260 280
T -D/8.0 (s)
Distance (km)
Profile 6-03: OBS-67, vertical
0 1 2 3 4 5 6 7 8 9 10
T -D/8 (s)
P
g3P
g2P
g2P
g1P
n10 9 8 7 6 5 4 3 2 1 0
P
xP
g1P
g3P
GP
Profile 6-03, OBS-67 Distance (km)
Depth (km)
0
40 35 30 25 20 15 10 5
0 50 100 150 200 250 300
NW Utrøst Ridge Lofoten SE
B
C A
Figure 11: Data, interpretation, and ray tracing of OBS 67, Profile 6-03. A: OBS data, vertical component, offset- dependent scaling. B: Interpretation (vertical bars) and model prediction (solid lines). C: Ray tracing of the velocity model.
60 80 100 120 140 160 180 200 220 240 260 280
T -D/8.0 (s)
Distance (km) Profile 6-03: OBS-68, vertical
0 1 2 3 4 5 6 7 8 9 10
T -D/8 (s)
P
g3P
g1P
g2P
g1P
n10 9 8 7 6 5 4 3 2 1 0
P
xP
g2P
GP
Profile 6-03, OBS-68 Distance (km)
0
40 35 30 25 20 15 10 5
0 50 100 150 200 250 300
Depth (km)
NW Utrøst Ridge Lofoten SE
B
C A
Figure 12: Data, interpretation, and ray tracing of OBS 68, Profile 6-03. A: OBS data, vertical component, offset- dependent scaling. B: Interpretation (vertical bars) and model prediction (solid lines). C: Ray tracing of the velocity model.
60 80 100 120 140 160 180 200 220 240 260 280
T -D/8.0 (s)
Distance (km) Profile 6-03: OBS-69, vertical
0 1 2 3 4 5 6 7 8 9 10
T -D/8 (s) P
g3P
g1P
g2P
g2P
g1P
n10 9 8 7 6 5 4 3 2 1 0
P
xP
GP
Profile 6-03, OBS-69 Distance (km)
Depth (km)
0
40 35 30 25 20 15 10 5
0 50 100 150 200 250 300
NW Utrøst Ridge Lofoten SE
B
C A
Figure 13: Data, interpretation, and ray tracing of OBS 69, Profile 6-03. A: OBS data, vertical component, offset- dependent scaling. B: Interpretation (vertical bars) and model prediction (solid lines). C: Ray tracing of the velocity model.
60 80 100 120 140 160 180 200 220 240 260 280
T -D/8.0 (s)
Distance (km) Profile 6-03: OBH-70
0 1 2 3 4 5 6 7 8 9 10
T -D/8 (s)
P
g1P
g2P
g1P
xP
n10 9 8 7 6 5 4 3 2 1 0
P
MP P
GP
P
GP
Profile 6-03, OBH-70 Distance (km)
Depth (km)
0
40 35 30 25 20 15 10 5
0 50 100 150 200 250 300
NW Utrøst Ridge Lofoten SE
B
C A
Figure 14: Data, interpretation, and ray tracing of OBH 70, Profile 6-03. A: Hydrophone data, offset-dependent scaling. B: Interpretation (vertical bars) and model prediction (solid lines). C: Ray tracing of the velocity model.
60 80 100 120 140 160 180 200 220 240 260 280
T -D/8.0 (s)
Distance (km) Profile 6-03: OBS-71, vertical
0 1 2 3 4 5 6 7 8 9 10
T -D/8 (s)
P
g1P
g2P
xP
n10 9 8 7 6 5 4 3 2 1 0
P
g1P
GP
Profile 6-03, OBS-71 Distance (km)
Depth (km)
0
40 35 30 25 20 15 10 5
0 50 100 150 200 250 300
NW Utrøst Ridge Lofoten SE
B
C A
Figure 15: Data, interpretation, and ray tracing of OBS 71, Profile 6-03. A: OBS data, vertical component, offset- dependent scaling. B: Interpretation (vertical bars) and model prediction (solid lines). C: Ray tracing of the velocity model.
T -D/8.0 (s)
Distance (km) Profile 6-03: S-6, vertical
0 1 2 3 4 5 6 7 8 9 10
160 180 200 220 240 260 280
T -D/8 (s)
10 9 8 7 6 5 4 3 2 1 0
P
g1P
GP
Profile 6-03, S-6 Distance (km)
Depth (km)
0
40 35 30 25 20 15 10 5
0 50 100 150 200 250 300
NW Utrøst Ridge Lofoten SE
B
C A
Figure 16: Data, interpretation, and ray tracing of land seismometer 6, Profile 6-03. A: Seismometer data, vertical component, offset-dependent scaling. B: Interpretation (vertical bars) and model prediction (solid lines). C: Ray tracing of the velocity model.
60 80 100 120 140 160 180 200 220 240 260 280
T -D/8.0 (s)
Distance (km) Profile 6-03: S-7, vertical
0 1 2 3 4 5 6 7 8 9 10
T -D/8 (s)
P
g3P
g1P
g2P
n10 9 8 7 6 5 4 3 2 1 0
P
GP P
GP
P
GP
Profile 6-03, S-7 Distance (km)
Depth (km)
0
40 35 30 25 20 15 10 5
0 50 100 150 200 250 300
NW Utrøst Ridge Lofoten SE
B
C A
Figure 17: Data, interpretation, and ray tracing of land seismometer 7, Profile 6-03. A: Seismometer data, vertical component, offset-dependent scaling. B: Interpretation (vertical bars) and model prediction (solid lines). C: Ray tracing of the velocity model.
100 120 140 160 180 200 220 240 260 280
T -D/8.0 (s)
Distance (km) Profile 6-03: S-8, vertical
0 1 2 3 4 5 6 7 8 9 10
T -D/8 (s)
10 9 8 7 6 5 4 3 2 1 0
P
g3P
GP
P
g1Profile 6-03, S-8 Distance (km)
Depth (km)
0
40 35 30 25 20 15 10 5
0 50 100 150 200 250 300
NW Utrøst Ridge Lofoten SE
B
C A
Figure 18: Data, interpretation, and ray tracing of land seismometer 8, Profile 6-03. A: Seismometer data, vertical component, offset-dependent scaling. B: Interpretation (vertical bars) and model prediction (solid lines). C: Ray tracing of the velocity model.
100 120 140 160 180 200 220 240 260 280
T -D/8.0 (s)
Distance (km) Profile 6-03: S-9, vertical
0 1 2 3 4 5 6 7 8 9 10
T -D/8 (s) P
g3P
g110 9 8 7 6 5 4 3 2 1 0
P
MP P
GP
P
GP
Profile 6-03, S-9 Distance (km)
Depth (km)
0
40 35 30 25 20 15 10 5
0 50 100 150 200 250 300
NW Utrøst Ridge Lofoten SE
B
C A
Figure 19: Data, interpretation, and ray tracing of land seismometer 9, Profile 6-03. A: Seismometer data, vertical component, offset-dependent scaling. B: Interpretation (vertical bars) and model prediction (solid lines). C: Ray tracing of the velocity model.
160 180 200 220 240 260 280
T -D/8.0 (s)
Distance (km) Profile 6-03: S-11, vertical
0 1 2 3 4 5 6 7 8 9 10
T -D/8 (s)
10 9 8 7 6 5 4 3 2 1 0
P
GP P
GP
P
GP P
g3Profile 6-03, S-11 Distance (km)
Depth (km)
0 NW Utrøst Ridge Lofoten SE
40 35 30 25 20 15 10 5
0 50 100 150 200 250 300
B
C A
Figure 20: Data, interpretation, and ray tracing of land seismometer 11, Profile 6-03. A: Seismometer data, vertical component, offset-dependent scaling. B: Interpretation (vertical bars) and model prediction (solid lines). C: Ray tracing of the velocity model.
0 2 4 6 8 10 12 14 16 18 20 22 24 26 28 30 32 34 36 38
Depth (km)
0 25 50 75 100 125 150 175 200 225 250 275 300 325
Distance (km) 0
2 4 6 8 10 12 14 16 18 20 22 24 26 28 30 32 34 36 38
0 25 50 75 100 125 150 175 200 225 250 275 300 325
5
5
5 5
5.1
5.1
5.1 5.1
5.2 5.2
5.2 5.2
5.3 5.3
5.3 5.3
5.4
5.4
5.4 5.4
5.5
5.5
5.5
5.5
5.6
5.6
5.6
5.6
5.7
5.7
5.7
5.7
5.8
5.8
5.8
5.8
5.9
5.9
5.9
5.9
6
6
6
6
6
6.1
6.1
6.1
6.1
6.1 6.2
6.2
6.2 6.2
6.2 6.3
6.3
6.3 6.3
6.3 6.4
6.4 6.4
6.4 6.4
6.5
6.5 6.5
6.5 6.6 6.6
6.6 6.7
6.7
6.7 6.8
6.8
6.8 6.9
6.9 7
7 7.1
7.1 7.2
7.2 7.3
7.3 7.4
7.4 7.5
1.75 2.00 2.25 2.50 2.75 3.00 3.25 3.50 3.75 4.00 4.25 4.50 4.75 5.00 5.25 5.50 5.75 6.00 6.25 6.50 6.75 7.00 7.25 7.50 7.75 8.00 8.25
km s−1
P8 P7
57 58 61 63
65
66 67 68 69 70 71 6 7 8 9 11
Moho
Moho
Utrøst R. Ribban B. Lofoten Vestfjorden B.
COT
NW SE
Profile 6−03
−100
−50 0 50
mGal
22 23
24a (24b)
−400 0 400 800
nT
Figure 21: Gridded crustal velocity model of Profile 6-03, showing ray coverage. The OBS/H locations are numbered on the seafloor, and seismometers onshore. Hachures indicate the continent-ocean transition (COT). The magnetic (red solid line) and Free-air gravity (orange solid line) tracks collected along profile are shown above. The dashed blue line is extracted from the magnetic grid of Olesen et al. (2010).