Sonderforschungsbereich 754
‘Climate-Biogeochemistry Interactions in the Tropical Ocean’:
Organic matter fluxes and biogeochemical processes in the OMZ off Peru
Cruise No. M138
01 June – 03 July 2017
Callao (Peru) – Bahia Las Minas (Panama)
H. Bange, D. Arévalo-Martínez, A. Baker, L. Bristow,
K. Burmeister, C. Cisternas-Novoa, M. Fischer, T. Fischer, C. Frey, M. Gledhill, H. Hauss, H.-J. Hoving, C. Karthäuser, J. Meyer, F. Le Moigne, S. Lennartz, C. Löscher, M. Lohmann, M. Maßmig,
K. Nachtigall, A. Paul, B. Quack, C. Rohleder, F. Schütte, M. Sun, P. Tuchen, and R. Xie
Chief Scientist: Hermann W. Bange Institution: GEOMAR, Kiel, Germany
2017
Table of Contents
1 Summary / Zusammenfassung ... 2
2 Participants ... 3
3 Research Program... 5
4 Narrative of the Cruise ... 7
5 Preliminary Results... 9
5.1 Physical Oceanography ... 9
5.2 Nutrients and Oxygen...16
5.3 N compounds and trace gases...18
5.4 N2O Production...23
5.5 Microbial Nitrogen Transformations...25
5.6 Nitrogen Fixation ...27
5.7 Viral Lysis...30
5.9 Surface Drifting Sediment Traps ...31
5.10 Biological Carbon Pump...34
5.11 Dissolved Organic Matter, Cell Abundance and Extracellular Enzyme Rates ...37
5.12 Zooplankton Distribution and Migration ...39
5.13 Trace Metals and Organic Nutrients ...41
5.14 Water Column Geobiology ...47
5.15 Submersible Pump ...49
5.16 Aerosol Sampling...50
5.17 Halocarbons...52
5.18 Plastic/Microplastic Sampling ...56
6 Ship’s Meteorological Station...57
7 Station List...59
8 Data and Sample Storage and Availability ...64
9 Acknowledgments ...65
10 References...66
1 Summary / Zusammenfassung 1.1 Summary
The oxygen minimum zone (OMZ) in the eastern tropical South Pacific Ocean is tightly connected to the coastal upwelling system off Peru. The high biological productivity off Peru is therefore, driven by the complex interplay between the amount of nutrients recycled by remineralisation processes in the OMZ and the upwelling which brings these nutrients to the surface layer. However, surprisingly little is known about organic matter cycling and its effects on biogeochemical processes in the OMZ off Peru. To this end we conducted a first comprehensive study on the role of organic matter for the biogeochemical processes and the maintenance of the OMZ off Peru. M138 combined measurements of marine biogeochemistry, microbiology, physical oceanography and air chemistry with foci on (i) the efficiency of the biological pump, (ii) the nitrogen cycle processes in the OMZ, (iii) the ventilation of the OMZ as well as (iv) the air/sea gas exchange across the ocean/atmosphere interface and (v) aerosol deposition. The METEOR cruise M138 was performed as part of the third phase of the SFB754
‘Climate-Biogeochemistry Interactions in the Tropical Ocean’ (www.sfb754.de).
1.2 Zusammenfassung
Die Sauerstoffminimumzone (SMZ) im tropischen Südostpazifik ist eng mit dem Küstenauftrieb vor Peru verknüpft. Die hohe biologische Produktivität vor Peru wird deshalb durch das
komplexe Zusammenspiel von dem Ausmaß der Remineralisierung von Nährstoffen in der SMZ und dem Auftrieb, der diese Nährstoffe in die Oberflächenschicht bringt, getrieben. Jedoch ist überraschend wenig über die Rolle des Umsatzes (i.e. Remineralisierung) von organischem Material und dessen Einfluss auf die biogeochemischen Prozesse und Aufrechterhaltung der SMZ vor Peru bekannt. Für M138 haben wir Messungen von Biogeochemie, Mikrobiologie, phys. Ozeanographie und Luftchemie miteinander verknüpft. Besondere Schwerpunkte lagen dabei auf der Untersuchung der Effizienz der biologischen Pumpe, des Stickstoffkreislaufes in der SMZ, der Ventilation der SMZ sowie dem Austausch von Spurengasen über die
Ozean/Atmosphäre-Grenzschicht und der Aerosoldeposition. Die METEOR-Fahrt M138 ist Teil der dritten Phase des Sonderforschungsbereiches 754 ‘Wechselwirkungen von Klima und Biogeochemie im tropischen Ozean‘ (www.sfb754.de).
2 Participants
1 Arévalo-Martínez, Dr. Damian Chem. Oceanogr. Scientist GEOMAR 2 Bange, Prof. Dr. Hermann Chem. Oceanogr. Chief scientist GEOMAR
3 Bristow, Dr. Laura Microbiology Scientist MPI
4 Burmeister Kristin CTD PhD student GEOMAR
5 Cisternas-Novoa, Dr. Carolina Biol. Oceanogrpahy Scientist GEOMAR
6 Eck Lucas Nutrients, O2 Student Helper GEOMAR
7 Fischer Martin Microbiology PhD student Univ. Kiel
8 Fischer, Dr. Tim CTD Scientist GEOMAR
9 Frey, Dr. Claudia Microbiology Scientist Princeton Univ.
10 Gledhill, Dr. Martha Chem. Oceanogr. Scientist GEOMAR
11 Hauss, Dr. Helena Biol. Oceanogr. Scientist GEOMAR
12 Hoving, Dr. Henk-Jan Biol Ocenaogr. Scientist GEOMAR
13 Karthäuser Clarissa Microbiology PhD Student MPI
14 Laursen Erik Microbiology Technician SDU
15 Le Moigne, Dr. Frederic Biol. Oceanogr. Scientist GEOMAR
16 Lennartz Sinikka Nutrients, O2 PhD student GEOMAR
17 Lohmann Martina Nutrients, O2 Technician GEOMAR
18 Löscher, Dr. Carolin Microbiology Scientist SDU
19 Martens Wiebke CTD Technician GEOMAR
20 Maßmig Marie Biol. Oceanogr. PhD Student GEOMAR
21 Meyer, Dr. Judith Biol. Oceanogr. Scientist GEOMAR
22 Nachtigall Kerstin Nutrients, O2 Technician GEOMAR
23 Niemeyer Daniela Biol. Oceanogr. PhD student GEOMAR
24 Paul, Dr. Allanah Biol. Oceanogr. Scientist GEOMAR
25 Schütte, Dr. Florian CTD, glider Scientist GEOMAR
26 Sun Mingshuang Chem. Oceanogr. PhD Student GEOMAR
27 Tuchen Philipp CTD PhD Student GEOMAR
28 Witt René CTD, moorings Technician GEOMAR
29 Xie, Dr. Ruifang Chem. Oceanogr. Scientist GEOMAR
GEOMAR – GEOMAR Helmholtz Institute for Ocean Research, Kiel, Germany MPI – Max Planck Institute for Marine Microbiology, Bremen, Germany
SDU – University of Southern Denmark, Odense, Denmark Univ. Kiel – University of Kiel, Kiel, Gerrnany
Princeton Univ. – Princeton University, Princeton, NJ, USA
Group photo of the participants with devices typical for their work during M138
Standing in the back row (from left to right): Henk-Jan Hoving, Judith Meyer, Daniela Niemeyer, Carolin Löscher, Helena Hauss, Damian Arévalo Martínez, Carolina Cisternas Novoa, Allanah Paul, Laura Bristow, Wiebke Martens, Martin Fischer, Kerstin Nachtigall, Lucas Eck, Martha Gledhill, Martina Lohmann, Philipp Tuchen, Kristin Burmeister, Rene Witt and Hermann Bange. Front row (from left to right): Marie Maßmig, Claudia Frey, Clarissa Karthäuser, Frederic LeMoigne, Sinikka Lennartz, Ruifang Xie, Florian Schütte, Mingshuang Sun and Tim Fischer.
Email addresses (as of 18 Februay 2019)
1 Arévalo-M artínez, Dr. Damian darevalo@geomar.de
2 Bange, Prof. Dr. Hermann hbange@geomar.de
3 Bristow, Dr. Laura lbristow@biology.sdu.dk
4 Burmeister Kristin kburmeister@geomar.de
5 Cisternas-Novoa, Dr. Carolina ccisternas@geomar.de
6 Eck Lucas lucas.eck@gmx.de
7 Fischer M artin mfischer@ifam.uni-kiel.de
8 Fischer, Dr. Tim tfischer@geomar.de
9 Frey, Dr. Claudia claudia.frey@unibas.ch
10 Gledhill, Dr. M artha mgledhill@geomar.de
11 Hauss, Dr. Helena hhauss@geomar.de
12 Hoving, Dr. Henk-Jan hhoving@geomar.de
13 Karthäuser Clarissa ckarthae@mpi-bremen.de
14 Laursen Erik eriklaursen@biology.sdu.dk
15 Le M oigne, Dr. Frederic frederic.lemoigne@mio.osupytheas.fr
16 Lennartz Sinikka sinikka.lennartz@uol.de
17 Lohmann M artina martina.lohmann@gmx.net
18 Löscher, Dr. Carolin cloescher@biology.sdu.dk
19 M artens Wiebke wmartens@geomar.de
20 M aßmig M arie massmig@bafg.de
21 M eyer, Dr. Judith jumeyer@geomar.de
22 Nachtigall Kerstin knachtigall@geomar.de
23 Niemeyer Daniela dniemeyer@geomar.de
24 Paul, Dr. Allanah apaul@geomar.de
25 Schütte, Dr. Florian fschuette@geomar.de
26 Sun M ingshuang misun@geomar.de
27 Tuchen Franz Philipp ftuchen@geomar.de
28 Witt René rwitt@geomar.de
29 Xie, Dr. Ruifang rxie@geomar.de
3 Research Program 3.1 Objectives
The overall objective of M138 was
to conduct a comprehensive biogeochemical study on the role of organic matter for the biogeochemical processes and the maintenance of the oxygen minimum zone off Peru.
To this end we undertook a measurement campaign that covered the major aspects of organic matter cycling and its links to major nitrogen and carbon cycle processes in the water column off Peru. The specific goals of M138 were:
- to assess the distribution of particles and organic matter in the OMZ off Peru,
- to quantify particle/organic matter fluxes through the OMZ and decipher the role of zooplankton therein,
- to decipher the role of particles/organic matter availability for N2 fixation, N loss, N2O formation, microbiological diversity and activity,
- to assess the role of anoxia on particle remineralization rates and elemental stoichiometry, and
- to investigate the variability of the hydrodynamical forcing relevant for nutrient turnover.
3.2 Overview of the Research Program
The OMZ off Peru is one of the areas, where the effect of future deoxygenation is predicted to be most intense. Previous studies the SFB754 in the waters off Peru suggested a co-occurrence of oxic and anoxic biogeochemical key processes in the OMZ, which directly raised the question about the ecological niche enabling this. Moreover, the particular importance of particle abundances was further suggested by model studies which showed that particle-associated processes may regulate the OMZ’s biogeochemistry (including N cycle processes) in the Peruvian OMZ. Thus, several sub-projects of the SFB754 were involved in M138 in order to decipher and assess the importance of particles and organic matter dynamics for the biogeochemistry of the Peruvian OMZ. The results of M138, together with the results from the SFB754 cruises M135-M137 will shed light onto fundamental questions regarding particle- related nutrient budgets, processes and O2 dynamics. The list of major work packages (WP) of M138 is given below. For the details of the measurements during M138 see Section 5 - Preliminary Results.
o WP01 – N compounds, dissolved trace gases, N2O production PIs: H. Bange, GEOMAR; C. Frey, B. Ward, Princeton Univ.
o WP02 – Viral lysis
PI: R. Schmitz-Streit, CAU Kiel o WP03 – N cycle processes
PIs: G. Lavik and M. Kuypers, MPI Bremen o WP04 – N2 fixation
PI: U. Riebesell, GEOMAR
o WP05 – Physical oceanography PI: M. Dengler, GEOMAR
o WP06 – Bacterial activity and DOC PI: A. Engel, GEOMAR
o WP07 – Zooplankton, particle flux PI: R. Kiko, GEOMAR
o WP08 – Export fluxes and composition of sinking particles PI: A. Engel, GEOMAR
o WP09 – Trace metals, Th export flux and organic nutrients PIs: M. Gledhill and E. Achterberg, GEOMAR
o WP10 – Water column geobiology PI: C. Löscher, SDU, Odense, Denmark o WP11 – Halocarbons and aerosols
PIs: B. Quack, GEOMAR; A. Baker, Univ. East Anglia, Norwich, UK
3.3 Modification of the Original Proposal
The following points have been modified from the original proposal:
- Caused by the move of the co-proponent Dr. C. Löscher from CAU Kiel to University of Southern Denmark (SDU in Odense) we added the new WP10 ‘Water Column
Geobiology’ to address the new research topic of Dr. Löscher.
- Dr. Claudia Frey from the group of Prof. Bess Ward at Princeton University joined WP01. To this end the topic N2O production was added to WP01.
- WP02 was modified to focus on the importance of viral lysis on bacterial communities and particle dynamics in OMZ.
- Complementary atmospheric halocarbon (i.e. canister sampling) and aerosol (filter) sampling was added as a new WP11. Sampling during the cruise was done by H. Bange.
Trace gas and aerosol measurements will be performed in cooperation with B. Quack, GEOMAR, and Alex Baker, Univ. East Anglia, Norwich, UK.
- The Equatorial transect from 4°S 86°W to 2°N 86°Wwas added as an extension of the original cruise track. Therefore, the port of call at the end of the cruise was changed from Callao (Peru) to Bahia las Minas (Panama).
- The berths reserved for observers were not requested by the Peruvian Authorities.
Therefore, these berths were given to colleagues from the SFB754.
- During the cruise we noted a meso-scale eddy structure which was about to detach from the coast at around 15°S. In order to investigate the hydrographic and biogeochemical settings of an emerging eddy the original cruise track was modified to allow a high- resolution survey of the eddy structure.
3.4 Measures to Conduct a Responsible Marine Research
We strictly followed the DFG regulations summarized in the „Erklärung zu einer verantwortungsvollen Meeresforschung“ and the OSPAR Code „Code of Conduct for Responsible Marine Research in the Deep Seas and High Seas of the OSPAR Maritime Area” to avoid unnecessary environmental and ecosystem disturbances.
4 Narrative of the Cruise 4.1 Narrative
The scientific team of M138 (29 scientists from GEOMAR Kiel, Univ. Kiel, MPI Bremen, SDU Odense, DK, and Princeton Univ., USA) embarked on Meteor on 31 May 2017. Unfortunately, customs clearance of both the outgoing containers from M137 and the containers for M138 was delayed considerably. To this end, R/V Meteor left the port of Callao with a delay of about 10 hours on 01 June at 18:00h (LT). R/V Meteor headed northwest for a test station at 11°36’S 78°53’W on 2 June 14.00h (LT). This was followed by the Transect A towards the coast from 11°28’S 79°26’W to 10°40’S 78°5’W which consisted of four regular CTD/RO stations (#879 -
#882) and two 24h stations (#883 and #884). At station #882 we deployed a first drifting sediment trap array (which was unfortunately caught by fishermen after two days. The buoy of the trap was brought to Ancon by the fishermen). Transect A was followed by a transit to the south along the coast. Transect B (i.e., the so-called IMARPE transect along 12°S from 77°28’W to 78°30’W) consisting of CTD/RO stations #885 - #888 was started on 08 June. At station #888 we also deployed a second drifting sediment trap array. Transect B was followed by a transit to Transect C. This transect (from 12°55’S 78°42’W to 12°13’S to 77°26’W) consisted of four regular CTD/RO stations (#889 - #891, #894) and two 24h stations (#892 and #897). At station
#893 we recovered Glider IFM07. At station #895 and #896 we recovered Glider IFM09 and mooring KPO1180, respectively. From station #897 we went northwest to station #898 to recover the second drifting sediment trap array at 12°3’S 78°17’W on 13 June. The regular CTD/RO stations #899 to #903 formed Transect D on the shelf parallel to the coast south of Callao/Lima (14/15 June). This was followed by Transect E (#904 - #906, from 14°S 76°40’W to 14°17’S 77°10’W). Stations #904 and #906 were 24h stations. At station #906 we deployed a third drifting sediment trap array. From #906 we performed an ADCP transect to survey a mesoscale eddy structure (18/19 June). This was followed by the Transect F (‘eddy transect’, stations #907 - #916; from 15°26’S 75°26’W to 16°15’S 76°43’W). Stations #907 and #912 were 24h stations. This was followed by a transit to stations #917 and #918 which complement Transect E. At station #919 (on 23 June) we recovered the third drifting sediment trap array. The mooring KPO1183 was recovered at station #920 on 23 June). This was followed by a northward transit along coast. The moorings KPO1182 and KPO1183 were recovered at stations #921 (24 June) and #922 respectively (24 June). From station #922 we went to the Bay of Ancon to pick up the lost buoy of the first drifting sediment array. The last station off Peru was #923 (CTD calibration station) which was performed on 26 June during the northward transit to the Equator transect. Regular CTD/RO stations #924 - #936 formed the Equator transect from 4°S to 2°N along 85°50’W. The Equator transect was finished on 30 June and was followed by the transit to Balboa. We arrived in Balboa in the morning of 03 July. The passage through the Panama Canal
started on 03 July at 20:00h (LT). We arrived in the Port of Bahia Las Minas in the morning of 04 July. The scientific team of M138 disembarked from Meteor on 05 July 2017 at 12:00h (LT).
4.2 Cruise track
Filled red circles indicate locations of sampling stations. Filled blue circles indicate waypoints without sampling; white lines indicate EEZs.
Callao
5 Preliminary Results 5.1 Physical Oceanography
(K. Burmeister, T. Fischer, W. Martens, F. Schütte, F.P. Tuchen, R. Witt, P. Brandt, M. Dengler)
5.1.1 CTD and O2 measurements and calibration (T. Fischer)
During M138 117 profiles of pressure (p), temperature (T), conductivity (c) and oxygen (O2) were recorded. In the Peruvian upwelling regime, the CTD-O2 profiles ranged to 2000m or to the bottom, along the equator transect they ranged to 1000m. When additional sample water was needed, additional CTD casts at the same place were conducted which usually ranged to 500m.
We used a Seabird Electronics (SBE) 9plus system, attached to the water sampler carousel, and the latest Seabird Seasave software. The SBE underwater unit had two sensor sets: p #1162, T1
#4051, c1 #2512, O21 #2669, T2 #2120, c2 #3374, O22 #992. The two sensor sets worked properly during the entire cruise. The secondary sensor set was chosen for report, for being slightly less noisy. Conductivity was calibrated using a linear relation in p, T and c. This relation was obtained by fitting the according CTD salinity to 200 water samples, which were analyzed with a Guildline Autosal salinometer. Rms salinity misfit was 0.0013 after removal of 33% of bottle values. Oxygen was calibrated using a relation linear in T and O2, and quadratic in p.
Winkler titration of 400 bottle samples led to a relation with an rms misfit of 1 µmol/kg (33% of bottle values removed). Further sensors were attached to the carousel and recorded, but were not calibrated: a fluorescence and turbidity sensor (Wetlabs), and a Photosynthetically Active Radiation (PAR) sensor (Biospherical).
Preliminary results and outlook
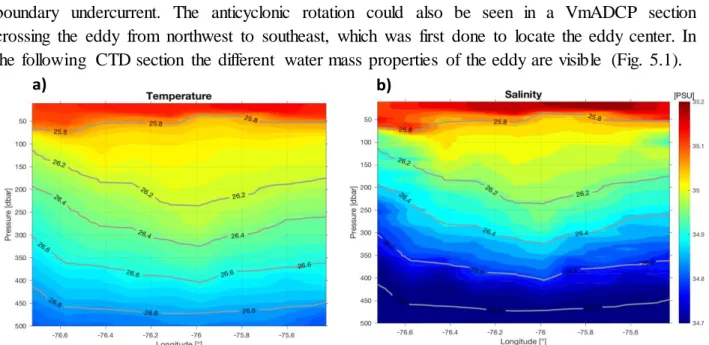
Among others one CTD section was done to investigate an interesting mesoscale variability feature west of the Peruvian coast. The anticyclonic eddy was detected with the help of satellite data. It was generated near shelf break of the Pervian coast, most likely due to instabilities of the boundary undercurrent. The anticyclonic rotation could also be seen in a VmADCP section crossing the eddy from northwest to southeast, which was first done to locate the eddy center. In the following CTD section the different water mass properties of the eddy are visible (Fig. 5.1).
Fig. 5.1: CTD section of a) temperature and b) salinity from 0 to 500m depth during the eddy crossing.
a) b)
5.1.2 Shipboard microstructure measurements (T. Fischer)
A MSS90-D microstructure profiler (#073) of Sea and Sun Technology was used to infer turbulent dissipation rate and diapycnal diffusivity, aiming at calculating diapycnal fluxes of several solutes including oxygen and nitrous oxide (N2O). The loosely tethered profiler was equipped with 3 airfoil shear sensors and a fast thermistor, as well as with a pressure, a conductivity, and a temperature sensor. Profiler sink velocity was adjusted to 0.6 m/s. In total 118 profiles to usually 200m depth were recorded at 37 ship stations, generally 3 microstructure profiles following a CTD cast. The system worked well throughout the cruise and there were no technical issues beyond maintenance.
5.1.3 Glider operations (F. Schütte)
During M138 two autonomous glider systems (IFM07 and IFM09) manufactured by Teledyne Webb Research were recovered. Both gliders were encompassed with a set of build-in sensors; a CTD, an Aanderaa optode to measure dissolved oxygen and a Wetlabs combined Chl-a fluorescence and turbidity sensor. Additional IFM09 was also equipped with a Rockland- Scientific-Microrider (MR 90). A Microrider is a microstructure profiler to infer turbulent dissipation rate and diapycnal diffusivity, the particularly aiming in this case was to quantifying the diapycnal flux of oxygen from the shelf in the OMZ. Two very fast temperature sensors were installed as well as two shear sensors. The recovery of IFM07 (IFM09) was done at 12° 32S 77°54W (12° 25S 77° 25W) on the 10th (11th) June. On both days the weather was cloudy with restricted visibility but only slightly disturbed by wind wave. The night before the recoveries the gliders where commanded to stop deep diving and to start shallow (100m) dives. 15 minutes before the recoveries both gliders were drifting on the surface. Both gliders were regularly sending its position and as such the recoveries worked out without any problem. Both Glider were only partly covered by biofouling, so good data is expected. The gliders were cleaned, opened and the memory cards (system & data) were removed, backed up and saved.
5.1.4 Vessel-mounted ADCP (K. Burmeister)
Underway-current measurements were performed continuously throughout the entire cruise using two vessel mounted ADCPs (VMADCPs): a 75kHz RDI Ocean Surveyor (OS75) mounted in the ship’s hull, and a 38kHz RDI Ocean Surveyor (OS38) placed in the moon pool. The OS38 was aligned to zero degrees (relative to the ship's center line) in order to reduce interference with the OS75, which was aligned to 45 degrees. The OS75 worked well throughout the cruise. Two configurations set up were used depending on the water depth. For a water depth deeper than 300m, the OS75 was configured with 100 bins of 8 m, pinging 25 times per minute. To ensure a data range up to 600 m, it was run in the less precise but more robust narrowband mode. In shallower water depth (<300 m), the configuration was set to 128 bins of 4 m, pinging 37.5 times per minute and the more precise but less robust broadband mode was used. The OS38 worked
well until June 16, 2017. As for the OS75, two configurations set ups were used depending on the water depth. For a water depth deeper than 300m, it was set up to 55 bins of 32 m, pinging 17 times per minute, with a range up to 1500 m. For a water depth shallower than 300m, the configuration was set to 80 bins of 16 m. The instrument ran in narrowband mode, as the broadband mode did not work. This was probably related to the problems that occurred after June 16, 2017. From June 16 to 17 the maximum depth range decreased to 1000 m and data gaps of 1/2 to 6 hours occurred before the OS38 broke down completely. After a thorough check of the OS38 the Meteor technicians found the error to be a short circuit in the watertight sealed main connector. Unfortunately this could not be repaired on board. During the entire cruise, the SEAPATH navigation data was of high quality. Post processing of the data was carried out separately for each instrument. Accounting for a time shift of the heading and position data recorded by the SEAPATH device relative to the raw OS data allowed for a significant reduction in the scatter of the calibration angles and amplitude factors.
Preliminary results and outlook
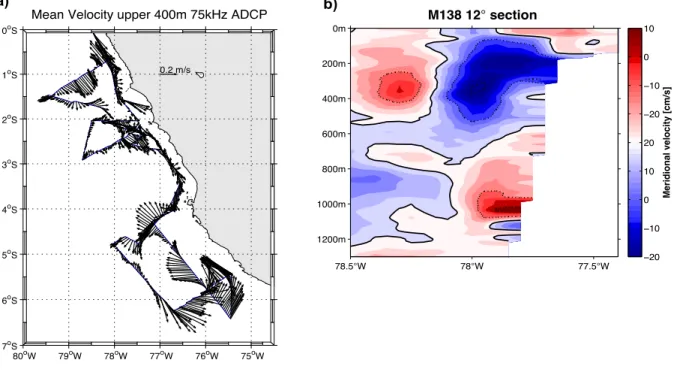
Several VMADCP transects perpendicular to the coast and one transect along the coast of Peru as well as two traditional transects in the Pacific, one along 12°S (IMARPE section) and one across the equator along 85°50'W were done. A first view on the preliminary processed VMADCP data of the transects of the coast of Peru shows on average the southward flowing peruvian undercurrent (see Fig. 5.2) which is modulated by mesoscale variability (in terms of velocities and directions) (see Fig. 5.2). The ADCP data will be further processed and analyzed ashore. In addition backscatter data will be used to identify zooplankton dial vertical migration patterns of the coast of Peru, complementary to Multinet, UVP and PELAGIOS data that were collected during this cruise.
Fig. 5.2: a) Alongtrack velocities of the upper 400 m off the coast of Peru measured by OS75 during M138. b) Meridional velocities along the IMARPE (12°S) sectio n measured by OS75 and OS38 from June 7-8, 2017. Red colours indicate northward velocities, blue colours indicate southward velocities. The southward flowing poleward directed boundary undercurrent is clearly visible in the upper 500m next to the shelf.
5.1.5 Underway RapidCast and UCTD measurements and calibration
(F. Schütte)
Additional to the CTD profiles a total of around 400 underway conductivity-temperature-depth (uCTD) profiles were taken during transits to increase the resolution and to observe near surface ocean variability of smaller time and spatial scales. The probes were lowered from the stern moving at speeds between 6 and 12kn from two different winch systems during the cruise. From the beginning of the cruise until the 12th June the underway RapidCast system was installed and allows continues and more less autonomous sampling in a yo-yo mode which results in a profile every 1-5 min for a depth of 30 to 125 m. Unfortunately on the 12th June technical problems with the RapidCast system appear. From profile to profile it became harder unwinding the whinch freely. We had to interrupt the measurements, because it was no longer possible to reach depths beyond 30m. A first diagnose shows that the motor of the winch has problems with its bearings.
From the 13th of June to the end of the cruise the uCTD system was installed on the starboard stern instead. These winch systems worked well until the end of the cruise. By operations with waves higher than two meters it was difficult with both systems to recover the probe without hitting the boat, even with the help of a pole. Three probes (s/n 54, 155 and 195) were used and worked well during the whole cruise. All of them are equipped with a temperature, conductivity and pressure sensor from SeaBird and records data with a frequency of 16 Hz. For calibration of the temperature and salinity measurements from the three probes sensors profiles were collected shortly after CTD stations (s/n 54 on CTD cast at ship station 915-3, s/n 155 on CTD cast 104 and s/n 195 on CTD cast 116). Additionally, the probes were attached to the CTD rosette (s/n 54 on CTD cast 103, s/n 155 on CTD cast 103 and s/n 195 on CTD cast 103) to identify possible pressure offsets. Ongoing calibration includes now thermal lag calculation, pressure offsets from CTD/O2 comparison and temporal sensor drifts determined from nearby CTD/O2 profiles and surface temperature and salinity measurements from the thermosalinograph.
Preliminary results and outlook
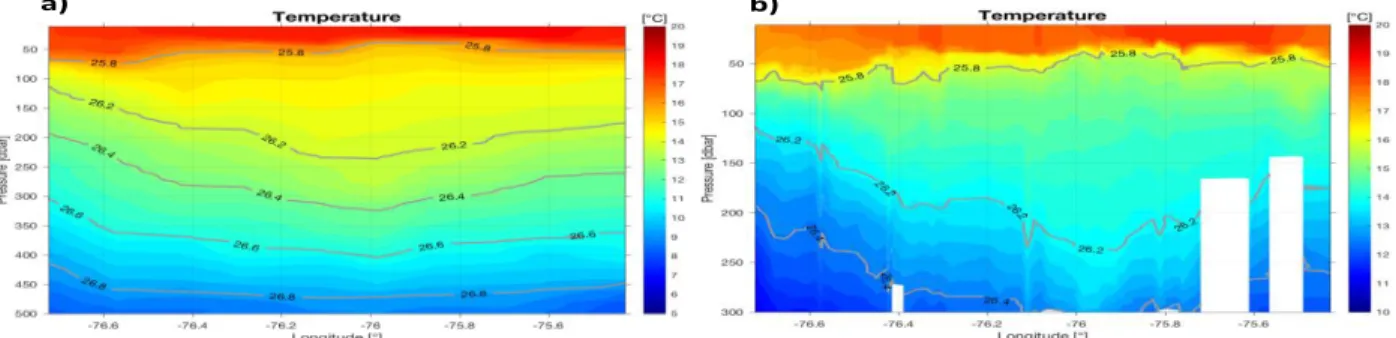
To increase the CTD resolution of the section through the anticyclonic mode water eddy uCTD profiles were conducted during steaming time in between the regular CTD stations. Fig. 5.3 shows the different view on the temperature sections ones conducted with the regular 10 CTD stations (a) and (b) with the additional 45 uCTD profiles in between. Due to the higher resolution small-scale variability and submesoscale processes are can be resolved.
Fig. 5.3: a) Temperature section through the anticyclonic mode water eddy based on 10 CTD profiles and b) the same temperature section with four times higher resolution based on the 10 CTD profiles and the additional 42 uCTD profiles.
a) b)
5.1.6 Thermosalinograph (F.P. Tuchen)
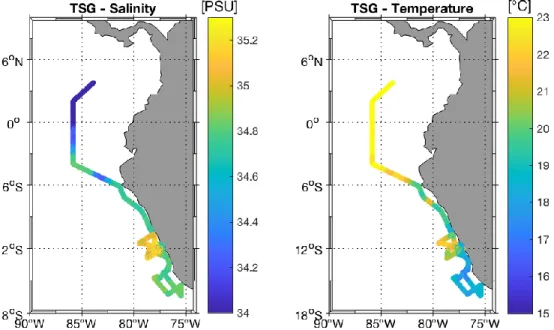
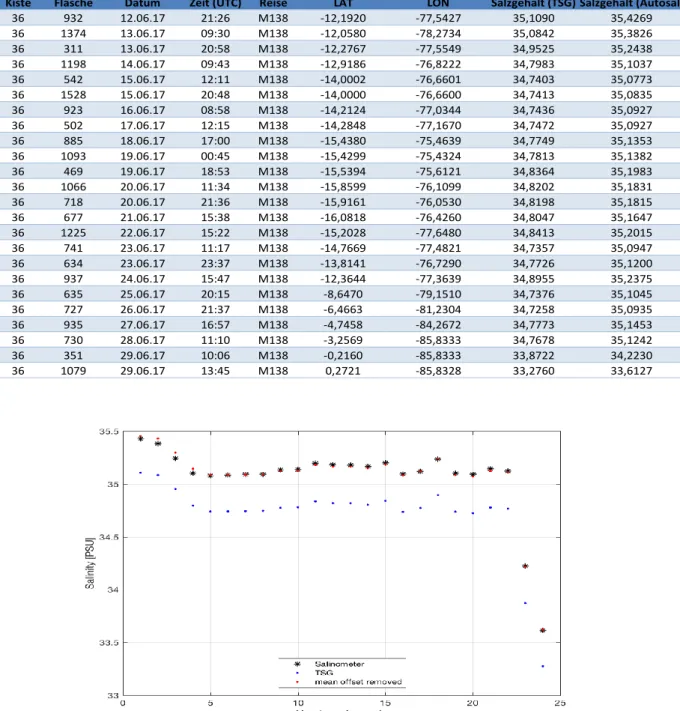
Underway measurements of sea surface temperature (SST) and sea surface salinity (SSS) are continuously done by the ship’s dual thermosalinograph. One is located at the starboard side (TSG1) while the other thermosalinograph’s inlet is at the portside (TSG2). In general, the system worked well throughout the cruise (see Fig. 5.4). During the extent of research cruise M138 a total of 24 water samples (see Tab. 5.1 for details) have been taken from the TSG system in order to measure the salinity of the probe with a Guildline AUTOSAL salinometer (GEOMAR AS7 was used during the cruise). Salinity measurements are used to quantify the offset and the drift of the TSG sensors.
Fig. 5.4: Uncalibrated salinity and temperature measurements from the ship’s TSG system until the 30th of June 2017.
The two external temperature sensors, T1sec from TSG1 and T2sec from TSG2, and both conductivity sensors (S1, S2) will be calibrated against the 5dbar values from the CTD/O2
profiles taken during the cruise. From the salinometer measurements a preliminary mean offset of 0.3461 PSU can be identified from the 24 water samples (see Fig. 5.5). During the cruise a few sudden decreases of salinity occurred, which are associated with the cleaning of the conductivity cells with freshwater.
Tab.5.1: List of samples which have been taken regularly during M138 from the sh ip’s TSG system.
Fig. 5.5: Comparison between salinity measurements from the TSG system and salinity values from the salinometer measurements.
METEOR - DBBH
Kiste 65
Kiste Flasche Datum Zeit (UTC) Reise LAT LON Salzgehalt (TSG) Salzgehalt (Autosal)
36 932 12.06.17 21:26 M138 -12,1920 -77,5427 35,1090 35,4269
36 1374 13.06.17 09:30 M138 -12,0580 -78,2734 35,0842 35,3826
36 311 13.06.17 20:58 M138 -12,2767 -77,5549 34,9525 35,2438
36 1198 14.06.17 09:43 M138 -12,9186 -76,8222 34,7983 35,1037
36 542 15.06.17 12:11 M138 -14,0002 -76,6601 34,7403 35,0773
36 1528 15.06.17 20:48 M138 -14,0000 -76,6600 34,7413 35,0835
36 923 16.06.17 08:58 M138 -14,2124 -77,0344 34,7436 35,0927
36 502 17.06.17 12:15 M138 -14,2848 -77,1670 34,7472 35,0927
36 885 18.06.17 17:00 M138 -15,4380 -75,4639 34,7749 35,1353
36 1093 19.06.17 00:45 M138 -15,4299 -75,4324 34,7813 35,1382
36 469 19.06.17 18:53 M138 -15,5394 -75,6121 34,8364 35,1983
36 1066 20.06.17 11:34 M138 -15,8599 -76,1099 34,8202 35,1831
36 718 20.06.17 21:36 M138 -15,9161 -76,0530 34,8198 35,1815
36 677 21.06.17 15:38 M138 -16,0818 -76,4260 34,8047 35,1647
36 1225 22.06.17 15:22 M138 -15,2028 -77,6480 34,8413 35,2015
36 741 23.06.17 11:17 M138 -14,7669 -77,4821 34,7357 35,0947
36 634 23.06.17 23:37 M138 -13,8141 -76,7290 34,7726 35,1200
36 937 24.06.17 15:47 M138 -12,3644 -77,3639 34,8955 35,2375
36 635 25.06.17 20:15 M138 -8,6470 -79,1510 34,7376 35,1045
36 727 26.06.17 21:37 M138 -6,4663 -81,2304 34,7258 35,0935
36 935 27.06.17 16:57 M138 -4,7458 -84,2672 34,7773 35,1453
36 730 28.06.17 11:10 M138 -3,2569 -85,8333 34,7678 35,1242
36 351 29.06.17 10:06 M138 -0,2160 -85,8333 33,8722 34,2230
36 1079 29.06.17 13:45 M138 0,2721 -85,8328 33,2760 33,6127
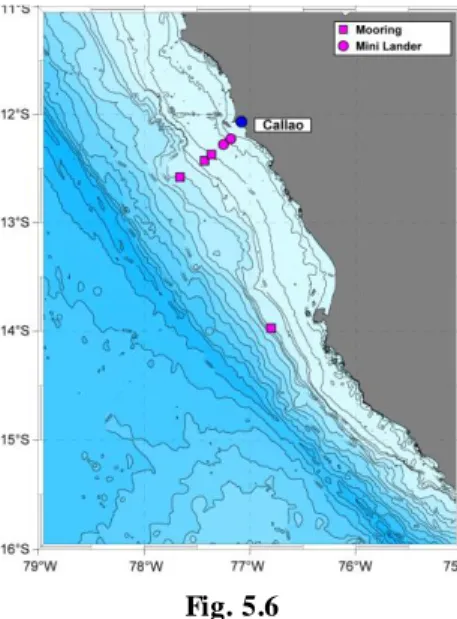
5.1.7 Mooring operations (F. Schütte, K. Burmeister)
Fig. 5.6 shows the exact positions of the different moorings recovered during M138.
Fig. 5.6
Tab. 5.2 shows the time and position of the mooring deployment and recovery. All moorings were recovered successfully.
Tab. 5.2
Mooring Date in 2017 / Time (UTC) Position Depth
deployed recovered Lat., °S Long., °W m
KPO 1180 21 April / 14:20 11 June / 14:22 12° 25.652’ 077°25.658’ 301 KPO 1181 19 April / 12:38 24 June / 15:45 12° 22.288’ 077° 21.779’ 203 KPO 1182 28 April / 17:08 24 June / 11:23 12° 34.732’ 077° 39.618’ 999 KPO 1183 14 April / 23:37 23 June / 20:40 13° 58.414’ 076° 47.942’ 990
Instrument performance
Overall the moored instruments recovered during M138 worked very successful. Tab. 5.3 shows the instrument performance for each mooring and sensor type (T - temperature; C - conductivity;
P - pressure; U,V- zonal, meridional velocity; O2 - oxygen) calculated as the percentage of maximum obtainable data. For the calculation of the instrument performance, every instrument was weighted homogeneously taking the following instrument types into account: MicroCAT (T, C, P), O2 -Logger (T, O2), ADCP (U, V), Aquadopp (P, U, V), moored profiler M-CTD MMP (T, C, U, V,P). Very good instrument performance was obtained for three of three MicroCATs (20s sampling interval) and one of one Aquadopp (1min sampling interval). Two of four ADCPs performed completely (1min and 5min pinging rate). One ADCP worked for 19 days until the battery was down due to a fast pinging rate of 10s. One ADCP stopped its measurements after 7 days (1 min pinging rate). The moored profiler and the O2-Logger worked for 2 complete days.
A summarized description over the performance of all instrument types is given in the following.
Details are shown in Tab. 5.3.
Tab. 5.3
Sensor type: T C P U,V O2
Mooring % % % % %
KPO_1180 4 4 52 52 4
KPO_1181 100 100 100 55
KPO_1182 100 100 100 100
KPO_1183 100 100 100 26
all moorings 76 76 88 58 4
Instrument calibration for MicroCATs
CTD cast calibrations were performed for all MicroCATs as post-deployment calibrations (CTD cast 103). 5 calibration stops were done over the whole profile range, each stop lasting 3 min in order to ensure equilibrium at the calibration points. The calibration of the MicroCATs will be completed after the cruise.
5.2 Nutrients and Oxygen 5.2.1 Nutrients
(K. Nachtigall, M. Lohmann)
Nutrients were measured on-board with a QuAAtro auto-analyzer from SEAL Analytical, (Serial number: 8003836) and a SEAL XY-2 Autosampler (Serial number: 5002A15014). The following methods from SEAL Analytical were used:
o Nitrite and Nitrate – Q-068-05 Rev 7; Nitrate is determined as nitrite after reduction on a cadmium coil. The nitrite is determined with a colorimetric metric method where sulphanilamide is forming a diazo compound.
o Phosphate – Q-064-05 Rev 4; this is the colorimetric method based on reaction with molybdate and antimony ions.
o Silicate – Q-066-05 Rev 3; this is the colorimetric method where a silico-molybdate complex is reduced to molybdenum blue.
o Ammonia – Holmes et al., 1999; this is a fluorometric method with ortho- Phthaldeialdehyde.
All together 1917 nutrient samples from 104 CTD casts were sampled during the cruise, of which 95 samples were taken as triplicates from varying depths. Furthermore, 113 samples were measured from 11 trace metal CTD casts, 24 single underway samples for the trace metal group and 72 samples from 7 Methane incubation experiments. For ammonia, 1183 samples were measured from 79 CTD casts. The precision of this method was calculated from all together 95 triplicates that were taken at most of the stations and determined to be: 0,024 µmol/L. Maximum sampling depths were different at every station and ranged between 4000m and 127m whereas the shallowest depths were about 5m to 15m below surface. The 14ml polyethylene sampling tubes and the respective caps were rinsed at least three times with the sampling water before the final sample was taken. The samples were measured directly after sampling with a max. delay of two hours or less. If the start of measurement was delayed for more than one hour, the samples
were stored meanwhile in the fridge. The precisions of the nutrient measurements were calculated from the triplicate samples taken at most of the stations and determined to be: 0.11 μmol/L for nitrate, 0,01 µmol/L for nitrite, 0.03 μmol/L for phosphate and 0.09 μmol/L for silicate. Additionally to the CTD samples, 23 bottles of Reference Material for Nutrients in Seawater (RMNS) from the General Environmental Technos (KANSO) Co., Ltd., Osaka/Japan, were measured as triplicates at least once a day, resulting in 57 measurements during the cruise.
The standard deviation of the measured replicates was determined to be 0.11 μmol/L for nitrate, 0.03 μmol/L for phosphate, 0,002 µmol/L for nitrite and 0.26 μmol/L for silicate. All measurements and data sets have been finished on board.
5.2.2 Oxygen
(S. Lennartz, L. Eck, M. Lohmann)
Observing and understanding the concentration of dissolved oxygen in the ocean is one of the key objectives of the SFB754. While the CTD system is capable to measure dissolved oxygen in the ocean at high vertical resolution, the sensors need to be carefully calibrated. Thus high quality reference observations are essential. During the whole cruise samples for the determination of dissolved oxygen after Winkler (1888) were taken from a total of 93 CTD casts with 100 ml WOCE bottles with well-defined volumes (calibrated flasks) to calibrate the oxygen sensors (SBE 43) and to support chemical and biological CTD data. Oxygen samples were always taken prior to all other parameters immediately after the CTD was fixed on deck. It was ensured that the sample bottles were flushed with at least 3 times its volume and the samples were free of air-bubbles. Maximum sampling depths were different at every station and ranged between 4000m and 127m whereas the shallowest depths were about 5m to 15m below surface.
The precision of the oxygen concentration measurements determined from the titration was 0.41 μmol/L (arithmetical average of all standard deviations, not respecting a few clear outliers) based on 103 replicate measurements with 3 replicates each. Standard measurements for the determination of the thiosulfate factor were carried out on a daily basis. In addition to that once a week a standard solution of Potassium Iodate from Wako (034-10251 CSK Standard Solution) was measured to support the quality of the own standard solution. The following reagents were used during this cruise:
sulfuric acid (50%)
zinc iodide starch solution (500 mL, Merck KGaA)
stock solution: sodium thiosulfate pentahydrate (49,5 g L-1); stock solution was diluted by a factor of 10 to create the working solution (0.02 mol L-1)
fixation solution: manganese(II)chloride (600 g L-1), sodium iodide (600 g L-1) and sodium hydroxide (320 g L-1)
standard solutions: potassium hydrogen diiodate (0,325 g∙L-1, homemade) and potassium iodate (CSK Standard Solution, 0.01 N, 300 mL, Wako Pure Chemical Industries, Ltd., Japan)
Titrations were performed within the WOCE bottles using a 20 mL Piston Burette (Nr. M 005684) TITRONIC universal from Schott Instruments. Dosing accuracy reported by the company is 0.15%, referred to the nominal volume, indicated as a measurement uncertainty with
a confidence level of 95%. The iodate standard was added with a 50 mL Piston Burette (Nr. M 001545) TITRONIC universal from Schott Instruments. 1 mL of the fixation solutions (NaI/NaOH and MnCl2) were dispensed with a high precision bottle-top dispenser (0.4-2.0 mL, Ceramus classic, Hirschmann). Note: Possible sampling, storing (air bubbles) or measuring failures were recorded. Results derived from those measurements were not considered in the data evaluation.
5.3 N compounds and trace gases
(D. Arévalo-Martínez, M. Sun, T. Fischer, A. Kock, T. Steinhoff, H. Bange) Background
Given the climatic relevance of marine-derived greenhouse gases (GHG), the investigation of their distribution and emissions from key oceanic regions is a crucial need in our efforts to better understand potential responses of the ocean and the overlying atmosphere to environmental changes such as warming and deoxygenation. Low-oxygen waters connected to coastal upwelling systems and the associated oxygen minimum zones (OMZ) are well-recognized strong sources of, for instance, N2O, CO2 and CH4 (Capone and Hutchins, 2013). Our main goals during the M138 cruise were: i) to assess the distribution of different GHG which are relevant for the biogeochemical cycling of carbon and nitrogen in the OMZ off Peru, and ii) to decipher the role of particles/organic matter availability for N2O and CH4 formation and consumption in the OMZ. In order to achieve these goals, we used a combination of continuous and discrete measurement methods as well as coordinated sampling in cooperation with participants of other working packages.
Continuous surface measurements
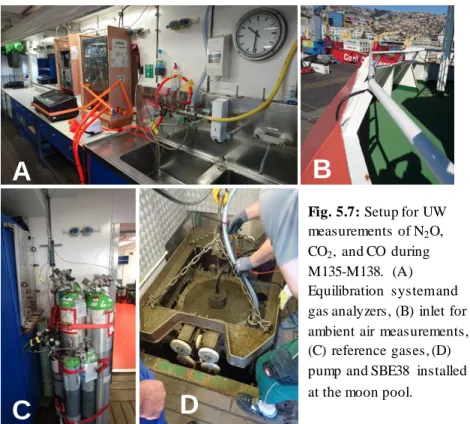
Continuous measurements of dissolved N2O, CO2 and CO in seawater were carried out by means of an autonomous equilibrator headspace setup (GO-System; General Oceanics, Inc.) coupled to an off-axis integrated cavity output spectroscopy analyzer (model DLT-100, Los Gatos Research, Inc.). The combined setup is shown in Fig. 5.7. Water was drawn into the system at ca.
3 L min-1 by using a LOWARA submersible pump installed in the ship’s moon pool at about 6 m depth . In order to correct for potential warming of the seawater between intake and equilibrator, the water temperature at the equilibrator was constantly monitored by means of a high accuracy digital thermometer (Fluke) and at the intake by a Seabird SBE38 thermometer. Ambient air measurements were carried out every six hours by drawing air into the system from a suction point located at the ship’s mast at about 30 m high. Control measurements and calibration procedures were performed every ~6 and 24 h respectively, by means of 3 standard gas mixtures (Deuste Steininger GmbH) bracketing the expected concentrations in this area.
The continuous system has been on board since the R/V METEOR cruise M135 and provided a unique record of the surface distribution of N2O, CO2 and CO during the autumn-winter period off Peru. Preliminary results from the M138 cruise are shown below.
Discrete sampling: Surface
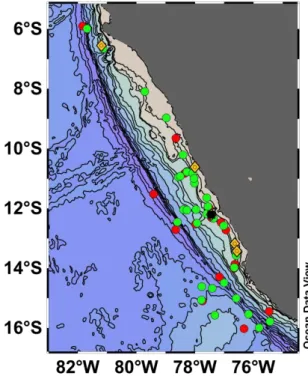
Discrete samples for N2O and CH4 measurements were collected daily (N2O) or in 6-12 h intervals (CH4) by sampling from the same water stream that fed the continuous setup (see above). For N2O, bubble-free triplicate samples were collected and immediately sealed by means of butyl stoppers and aluminum crimps. Subsequently a 10 mL headspace of helium and 50 µL of a saturated mercuric chloride (HgCl2) solution were added. After an equilibration period of at least 2 hours the headspace sample was measured by means of a gas chromatograph equipped with an electron capture detector (GC/ECD). The GC/ECD was calibrated on a daily basis using dilutions of one standard gas mixture (Deuste Steininger GmbH). Samples for CH4 analysis were preserved with HgCl2 and the measurements will be carried out at GEOMAR by means of an analytical system similar to that used for N2O during the cruise, but using a flame ionization detector (FID) instead of an ECD. DIC/TA samples were collected daily in 500 mL glass bottles, after which they were preserved to be measured at GEOMAR. DIC/TA data together with ancillary parameters will be used to compute final pCO2 values. The map in Fig. 5.8 shows the locations in which the surface samples were collected.
Fig. 5.7: Setup for UW measurements of N2O, CO2, and CO during M135-M138. (A) Equilibration system and gas analyzers, (B) inlet for ambient air measurements, (C) reference gases, (D) pump and SBE38 installed at the moon pool.
A
C
B
D
Fig. 5.8: Locations for discrete shallow sampling of trace gases during M138. Red dots = underway N2O, green dots
= underway CH4, yellow triangles = zodiac sampling, black square = pump profiler.
Discrete sampling: Depth profiles of N2O, hydroxylamine (NH2OH) and CH4
Sampling for N2O, NH2OH -an important intermediate in the nitrogen cycle-, and CH4 were performed in conjunction with several biological parameters and incubation work from other groups as well as with microstructure measurements. Samples were drawn directly from 10 L Niskin bottles mounted on a standard CTD/Rosette. Glass vials of 20 - 50 mL were used and the samples were treated as explained above. N2O samples were measured on board whereas CH4
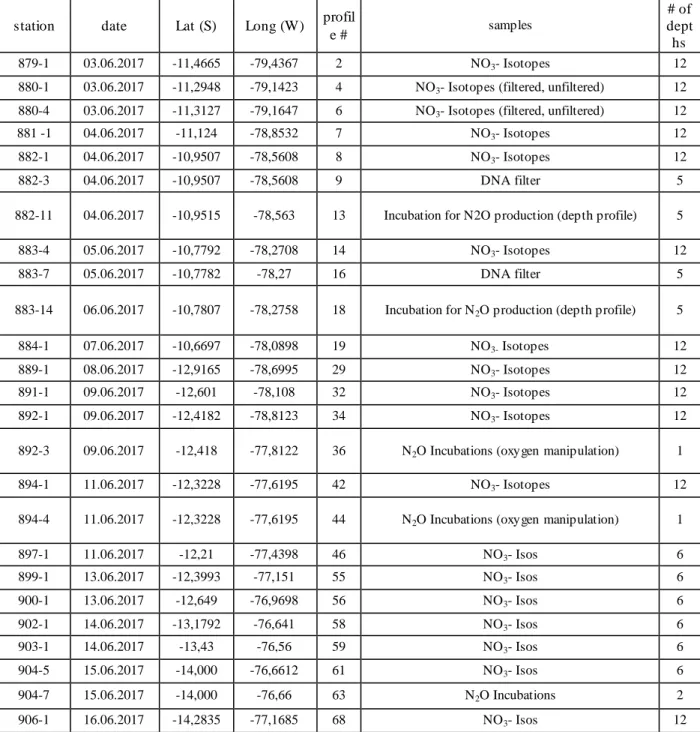
samples were only preserved and stored for posterior analysis in Kiel. Tab. 5.4 shows an overview of the sampling locations and depths during the cruise.
Tab. 5.4: Sampling locations for N2O and CH4 during M138 (depths may vary for each gas).
Station Position Depths [m]
879-1 11°28’S 78°26’W 5,10,15,30,50,55,65,75,100,200,300,350,400,600,800,1000,2000
882-11 10°57.05’S 78°33.64’W 5,15,25,30,75,100,150,200,220,260,300,350,400,500,600,700,800,900,1000 883-4 10°46.74’S 78°16.21’W 5,10,15,20,30,50,75,100,150,190,200,250,275,300
884-2 10°40.2’S 78°05.4’W 5,10,15,20,25,30,50,75,130
885-1 12°2.4’S 77°27.6’W 5,10,15,20,25,30,40,50,55,75,100,135 886-1 12°2.4’S 77°45’W 5,10,15,20,30,50,65,75,100,150,200,250
887-1 12°2.4’S 78°00’W 5,10,15,20,30,45,50,75,100,200,300,350,400,600,800,1000
888-1 12°2.4’S 78°30’W 5,10,15,20,30,50,60,75,100,150,200,300,350,400,600,800,1000,2000 889-1 12°55’S 78°42’W 5,10,20,50,75,100,200,270,300,400,600,800,1000
892-1 12°25.09’S 78°48.74’W 5,10,25,45,50,70,75,100,120,145,200,300,350,400,600,800,1000 894-1 12°18.40’S 77°37.27’W 5,10,15,30,40,50,75,100,120,200,300,375,400
897-1 12°12.6’S 77°26.4’W 5,10,15,20,30,35,75,100,150 899-1 12°24’S 77°09’W 5,10,12,15,20,50,75,100,127 900-1 12°38.4’S 76°58.2’W 5,10,15,16,20,40,50,75,100,150 901-1 12°53.4’S 76°49.2’W 5,10,15,20,25,30,50,75,100,145 902-1 13°10.8’S 76°38.4’W 5,10,15,20,25,40,50,75,100,120 903-2 13°25.8’S 76°33.6’W 5,10,12,15,20,50,75,100,120
904-5 14°0.0’S 76°39.6’W 5,8,10,15,20,30,50,75,100,200,300,375,400,bottom 905-1 14°7.1’S 76°52.14’W 5,10,15,20,25,30,50,75,100,200,300,400,600,800,1000 906-1 14°17.07’S 77°10.01’W 5,12,20,22,50,100,200,300,350,600,800,1000,2000
907-14 15°25.8’S 75°25.8’W 10,20,30,40,50,55,75,100,200,300,325,500 908-3 15°31.49’S 75°35.75’W 5,10,25,35,40,50,75,100,200,300,400,600,800 909-1 15°36.26’S 75°43.18’W 5,10,15,35,40,50,60,75,100,200,225,300,500,600 910-3 15°41.47’S 75°51.17’W 5,10,15,20,25,35,45,50,75,100,200,300,400,500,600,800 911-1 15°46.67’S 75°59.15’W 5,10,20,30,35,40,50,75,100,200,250,300,400,500,600
912-1 15°51.6’S 76°06.6’W 5,10,15,20,25,40,45,50,75,100,200,250,300,400,500,600,700,800 913-1 15°58.39’S 76°17.12’W 5,10,20,30,40,50,60,75,100,200,300,350,400,500,600
914-3 16°04.03’S 76°25.77’W 5,10,15,20,30,40,50,60,75,100,200,300,325,400,500,600,700,800 915-3 16°09.67’S 76°34.42’W 5,10,15,20,50,65,75,80,100,200,300,350,400,500,600
916-3 16°15.15’S 76°43.07’W 5,10,15,20,40,50,60,75,100,200,300,350,400,600,800 917-1 14°46’S 78°01.98’W 5,15,30,75,100,200,300,600,800
918-1 14°37’S 77°45.8’W 12,22,42,52,62,75,82,102,202,302,312,402,602,802 924-1 04°00’S 85°50.0’W 20,40,50,75,100,150,200,250,300,350,400,600,800 926-1 03°00’S 85°50’W 20,40,50,75,100,150,200,250,300,350,400,600,800 928-1 02°00’S 85°50’W 20,40,50,75,100,150,200,250,300,350,400,600,800 930-1 01°00’S 85°50’W 20,40,50,75,100,150,200,250,300,350,400,600,800 932-1 00°00’ 85°50’W 20,40,50,75,100,150,200,250,300,350,400,600,800 934-1 01°00’N 85°50’W 20,40,50,75,100,150,200,250,300,350,400,600,800 936-1 02°00’N 85°50’W 20,40,50,75,100,150,200,250,300,350,400,600,800
In order to investigate near-surface gradients of N2O off the Peruvian coast, five detailed surveys of the upper 10 m of the water column were carried out in selected stations on board of a zodiac.
Sampling was carried out as for the conventional depths profiles but by using either a single Niskin bottle or a small submersible pump which could be lowered to the upper 15 - 150 cm of the water column. Additionally, we collected samples for depth profiles of N2O and NH2OH by using a continuous pump profiler developed by S. Lennartz (GEOMAR); see Section 5.16.
Incubation experiments for methane (CH4) production
Methane (CH4), the most abundant hydrocarbon in the atmosphere, plays an important role in regulating the Earth's radiation balance and atmospheric chemistry in the troposphere. Although the coastal upwelling area off Peru is one of the most biologically productive regions of the world’s ocean, with a large and persistent OMZ, the emissions as well as the transfer mechanisms (production and consumption) of CH4 have not been quantified so far. To this end, incubation experiments were conducted in addition to the CTD/Rosette sampling. For this, three different water types were used: surface seawater from a nearshore station (885-3; 5 m), surface seawater from an offshore station (888-3; 5 m) and seawater from the OMZ (904; 300 m). This allowed comparing the different CH4 transfer processes under varying environmental regimes. In order to determine the potential CH4 production or consumption rate off Peru, two inhibitors were used during the incubations: 2-bromoethanesulfonate (BES) (for inhibiting CH4 production) and molybdate (for blocking CH4 consumption). Different treatments were setup by adding DMSP, DMSO, trimethylamine and methylphosphonic acid in order to test the possible correlation between CH4 production and the microbial degradation of these methyl-rich organic phosphorus or sulfur compounds, which have been reported as possible precursors of CH4
through methylotrophic methanogenesis. The samples will be processed at GEOMAR in Kiel.
Planned measurements and time line
Analysis of samples for DIC/TA as well as for CH4 concentrations in depth profiles and incubations will take place at the Chemical Oceanography Department of GEOMAR. The measurements are expected to be completed within nine months after the end of the cruise. Data
analysis for the N2O measurements performed on board is expected to be finalized within eight months after the end of the cruise. The samples for determination of N2O concentrations in the water column across the 85°W section will be analyzed in Kiel within the context of a Bachelor thesis (over the following six months). Data analysis of continuous surface measurements of N2O, CO2 and CO is expected to be completed within six months after the end of the cruise.
Preliminary results
Underway measurements of N2O, CO2 and CO in surface waters were conducted during 30 days.
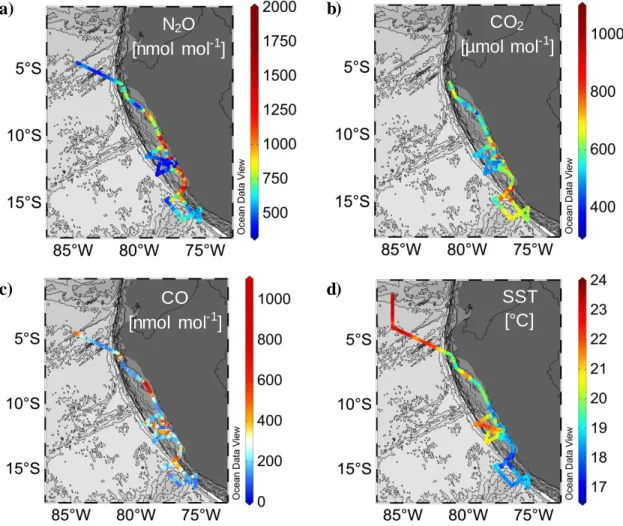
Fig. 5.9 shows the distribution of these three gases along the cruise track, as well as the sea surface temperature (SST) which was recorded simultaneously.
Fig. 5.9: Preliminary results of continuous measurements of dissolved N2O (a), CO2 (b) and CO (c) during M138.
Along-track SST as measured by the ship’s thermosalinograph is shown in (d).
Results from continuous measurements show a strong source of N2O and CO2 from surface waters in the Peruvian upwelling, particularly in the near-coastal area between 9°S and 16°S where seawater values surpassed atmospheric equilibrium (~329 ppb for N2O und ~ 408 ppm for CO2) by about one order of magnitude (Fig. 5.9). In agreement with past surveys which took place during the M91 and the SO-243 cruises (December 2012 and October 2015, respectively) the highest N2O and CO2 values were consistent with the location of the upwelling centres off Chimbote, Callao and Pisco. Episodic undersaturation of CO2 was observed at discrete locations along the coast, suggesting strong biological drawdown in response to enhanced primary production after upwelling events. Likewise, observations show that the coastal waters off Peru were a net source of CO to the atmosphere. Thus, despite the clearly dominant
a) b)
c) d)
N2O [nmol mol-1]
CO2
[µmol mol-1]
CO [nmol mol-1]
SST [°C]