The Expedition SO261
of the Research Vessel SONNE
to the Atacama Trench in the Pacific Ocean in 2018
Edited by
Frank Wenzhöfer
with contributions of the participants
Berichte
zur Polar- und Meeresforschung
Reports on Polar and Marine Research
729
2019
Die Berichte zur Polar- und Meeresforschung werden vom Alfred-Wegener-Institut, Helmholtz-Zentrum für Polar- und Meeresforschung (AWI) in Bremerhaven, Deutschland, in Fortsetzung der vormaligen Berichte zur Polarforschung herausgegeben. Sie erscheinen in unregelmäßiger Abfolge.
Die Berichte zur Polar- und Meeresforschung ent- halten Darstellungen und Ergebnisse der vom AWI selbst oder mit seiner Unterstützung durchgeführten Forschungsarbeiten in den Polargebieten und in den Meeren.
Die Publikationen umfassen Expeditionsberichte der vom AWI betriebenen Schiffe, Flugzeuge und Statio- nen, Forschungsergebnisse (inkl. Dissertationen) des Instituts und des Archivs für deutsche Polarforschung, sowie Abstracts und Proceedings von nationalen und internationalen Tagungen und Workshops des AWI.
Die Beiträge geben nicht notwendigerweise die Auf- fassung des AWI wider.
The Reports on Polar and Marine Research are issued by the Alfred Wegener Institute, Helmholtz Centre for Polar and Marine Research (AWI) in Bremerhaven, Germany, succeeding the former Reports on Polar Research. They are published at irregular intervals.
The Reports on Polar and Marine Research contain presentations and results of research activities in polar regions and in the seas either carried out by the AWI or with its support.
Publications comprise expedition reports of the ships, aircrafts, and stations operated by the AWI, research results (incl. dissertations) of the Institute and the Archiv für deutsche Polarforschung, as well as abstracts and proceedings of national and international conferences and workshops of the AWI.
The papers contained in the Reports do not necessarily reflect the opinion of the AWI.
Herausgeber
Dr. Horst Bornemann
Redaktionelle Bearbeitung und Layout Birgit Reimann
Editor
Dr. Horst Bornemann Editorial editing and layout Birgit Reimann
Alfred-Wegener-Institut
Helmholtz-Zentrum für Polar- und Meeresforschung Am Handelshafen 12
27570 Bremerhaven Germany
www.awi.de www.reports.awi.de
Titel: Bergung des Hadal-Landers in der Nacht (Foto: Kazumasa Oguri, JAMSTEC, Japan) Cover: Recovery of the hadal lander system during night (Photo: Kazumasa Oguri, JAMSTEC, Japan)
Alfred-Wegener-Institut
Helmholtz-Zentrum für Polar- und Meeresforschung Am Handelshafen 12
27570 Bremerhaven Germany
www.awi.de www.reports.awi.de
Der Erstautor bzw. herausgebende Autor eines Ban- des der Berichte zur Polar- und Meeresforschung versichert, dass er über alle Rechte am Werk verfügt und überträgt sämtliche Rechte auch im Namen sei- ner Koautoren an das AWI. Ein einfaches Nutzungs- recht verbleibt, wenn nicht anders angegeben, beim Autor (bei den Autoren). Das AWI beansprucht die Publikation der eingereichten Manuskripte über sein Repositorium ePIC (electronic Publication Information Center, s. Innenseite am Rückdeckel) mit optionalem print-on-demand.
The first or editing author of an issue of Reports on Polar and Marine Research ensures that he possesses all rights of the opus, and transfers all rights to the AWI, including those associated with the co-authors. The non-exclusive right of use (einfaches Nutzungsrecht) remains with the author unless stated otherwise.
The AWI reserves the right to publish the submitted articles in its repository ePIC (electronic Publication Information Center, see inside page of verso) with the option to "print-on-demand".
Please cite or link this publication using the identifiers
http://hdl.handle.net/10013/epic.68ace82d-d70c-49f4-ab1f-d0e811907fff and https://doi.org/10.2312/BzPM_0729_2019
The Expedition SO261
of the Research Vessel SONNE
to the Atacama Trench in the Pacific Ocean in 2018
Edited by
Frank Wenzhöfer
with contributions of the participants
RV SONNE SO261
Cruise Report / Fahrtbericht
San Antonio (Chile) 02.03.2018 Guayaquil (Ecuador) 02.04.2018
SO261 HADES
Frank Wenzhöfer
Max Planck Institute for Marine Microbiology Alfred Wegener Institute Helmholtz Center
for Polar and Marine Research
2018
1. Cruise summary / Zusammenfassung 3
1.1 Cruise summary 3
1.2 Zusammenfassung 3
2. Participants / Fahrtteilnehmer 4
2.1 Scientific Party / Wissenschaftliche Fahrtteilnehmer 4
2.2 Crew / Mannschaft 5
3. Narrative of the cruise / Ablauf der Forschungsfahrt 7 4. Aims of the cruise / Zielsetzung der Forschungsfahrt 10
5. Agenda of the cruise / Programm der Forschungsfahrt 11 6. Settings of the working area / Beschreibung des Arbeitsgebietes 13 7. Work details and first results / Beschreibung der Arbeiten im Detail
einschließlich erster Ergebnisse 15
7.1 CTD-O/Rosette System (CTD) 15
7.2 Multi Corer (MUC) 16
7.3 Gravity Corer (GC) 18
7.4 Hadal-Rosette 19
7.5 Lander Systems 20
7.5.1 Flux-Lander 20
7.5.2 Hadal Profiler-Lander 21
7.5.3 Hadal Sediment-Lander 22
7.5.4 Camera Lander 23
7.5.5 Reiver 25
7.5.6 Nano-Lander 27
7.6 Ocean Floor Observation and Bathymetry System (OFOBS) 31
7.7 MOCNESS 37
7.8 Multinet 37
7.9 Bio-Geochemical Analyses 38
7.11 In situ and lab flux and process measurements 45
7.12 Biodiversity 47
7.13 Microbiology and Virology 50
7.14 Meiofauna 53
7.14.1 Metazoans meiofauna 53
7.14.2 Foraminifera 55
7.15 Megafauna 59
7.16 Zooplankton 62
7.17 Physical Oceanography 64
7.18 Pelagic Microbiology 65
7.19 Pelagic Carbon Geochemistry 65
7.20 Particle and deposition dynamics 67
7.21 Sediment and geological characterization 71
7.22 Distribution of pollutions in sediments 76
8. Acknowledgements / Danksagung 77
9. References 77
10. Appendices / Anhänge 78
A.1 Participating Institutions / Liste der teilnehmenden Institutionen 78
A.2 Station List / Stationsliste 81
A.3 Multicorer sample distribution 90
A.4 Water sample distribution from CTD/Rosette 95
A.5 Water samples from Hadal-Rosette 105
F Wenzhöfer
1.1 Cruise summary
The scientific work during SO261 was related to study hadal ecosystems, which are one of the most extreme environments of the oceans, and was part of the ERC project HADES. The main goal was to get new understanding of biogeochemical processing and community structure of the Atacama hadal trench system which is underlying highly productive surface waters.
The integrated multidisciplinary investigations were carried out at 6 sites along the trench axis from 24° to 20° S and will be compared to 3 abyssal reference sites next to the trench.
The key focus of the investigations was on benthic biogeochemical and biological sampling and observations, including the composition of the benthic communities (all size classes) as well as ecosystem functions (e.g. remineralization rates). Additionally, observations of the physicochemical characteristics of the water column and biological sampling from the surface to hadal depth were performed. A large proportion of the work was based on autonomous hadal in situ technologies. Additional, traditional instruments (like MUC, gravity corer, CTD-Rosette and MOCNESS net) were used to collect samples from all water depth. The result will add to our database on microbial carbon mineralization in hadal settings and allow for comparison between hadal environments experiencing different regimes of organic carbon supply. Using this multidisciplinary, concerted and quantitative approach in comparing carbon and nutrient fluxes as well as the connection, composition and structure of hadal communities we will be able to get new knowledge on eutrophic trench ecosystems and deep sea ecosystems in general.
1.2 Zusammenfassung
Die wissenschaftlichen Arbeiten der Expedition SO261 tragen zur Untersuchung von hadalen Ökosystemen, einem der extremsten Lebensräume in unseren Ozeanen bei. Sie sind Teil des ERC Projekts HADES. Ziel ist es neue Erkenntnisse zu biogeochemischen Prozessen und Lebensgemeinschaften im Atacama Tiefseegraben zu erlangen, der in einem der produktivsten Ozeangebiete liegt. Die multidisziplinären Untersuchungen wurden an 6 Stationen am Meeresboden des Tiefseegrabens, entlang eines Transekts von 24° bis 20°S, durchgeführt und werden mit 3 benachbarten abyssalen Referenzstationen verglichen. Der Fokus der Forschungen lag bei der Zusammensetzung benthischer Lebensgemeinschaften aller Größenklassen von Organismen sowie auf ihren Ökosystemfunktionen (z.B. biogeochemsicher Prozesse und Stoffumsatz). Zusätzlich wurde die gesamte Wassersäule biologisch beprobt und ihre physikochemischen Merkmale charakterisiert. Ein großer Teil der Arbeiten wurde mit autonomen hadalen Messsystemen durchgeführt. Zusätzlich wurden traditionelle Technologien (wie MUC, Schwerelot, CTD/Rosette, MOCNESS Netz) eingesetzt, um in allen Wassertiefen Proben zu erhalten. Die Ergebnisse werden die Datenbasis für Mineralisationsprozesse in hadalen Ökosystem erweitern und den Vergleich mit anderen Tiefseegräben in unterschiedlichen biogeochemischen Provinzen ermöglichen. Die multidisziplinären Untersuchungen helfen die biogeochemischen Prozesse sowie die Zusammensetzung der Lebensgemeinschaften in hadalen Tiefseegräben sowie Tiefseeökosystemen im Allgemeinen besser zu verstehen.
2. PARTICIPANTS / FAHRTTEILNEHMER
2.1 Principal Investigator / Projektleiter
Frank Wenzhöfer Fahrtleiter / Chief Scientist MPI/AWI
2.1 Scientific Party / Wissenschaftliche Fahrtteilnehmer
Ronnie N Glud Biogeochemistry/Lander SDU
Morten Larsen Biogeochemistry/Lander SDU
Anni Glud Sensors SDU
Manfred Schlösser Isotops AWI
Bo Thamdrup Biogeochemistry SDU
Clemens Schauberger Molecular Microbiology SDU
Axel Nordhausen Lander MPI
Volker Asendorf Lander MPI
Autun Purser OFOBS/Macrofauna AWI
Laura Hehemann OFOBS/Bathymetry AWI
Ulrich Hoge OFOBS AWI
Robert Turnewitsch Radionuclides SAMS
Kazumasa Oguri Ultra-Camera JAMSTEC
Matthias Zabel Geochemistry UB/Marum
Pei-Chuan Chuang Geochemistry UB/Marum
Emmanuel Okuma Geochemistry UB/Marum
Alan Jamieson Megafauna NCU
Thomas Linley Megafauna NCU
Stewart Heather Geology/Bathymetry BGS
Mackenzie Gerringer Megafauna UW
Osvaldo Ulloa Pelagic Microbiology UDEC/IMO
Nadin Ramirez Pelagic Microbiology UDEC
Edgart Rafael Flores Pelagic Microbiology UDEC
Igor Fernandez Zooplankton IMO
Gadiel Alarcon Nanolander IMO
Ruben Escribano Moccness/Zooplankton UDEC/IMO
Daniel Toledo Zooplankton IMO
Lorena Arias Carbon Geochemistry IMO
Wolfgang Schneider Phys. Oceanography UDEC
Eduardo Navarro Phys. Oceanography UDEC
Sophie Arnaud-Hoand eDNA Ifremer
Blandine Touche eDNA Ifremer
Daniela Zeppilli Meio- & Marcofauna Ifremer
Miriam Brand Meio- & Marcofauna Ifremer
Xinxin Li Org. Biogeochemistry SUSTech
Xin Zhao Org. Biogeochemistry SUSTech
Logan Peoples Microbial genetics Scripps
Dennis Romero Foraminifera IMARPE
Figueroa Yanara Observer
2.2 Crew / Schiffsbesatzung
Lutz Mallon Master / Kapitän
Jens Göbel Chief Mate / Ltd. Nautischer Offizier Dieter Hermesmeyer Chief Engineer / Ltd. Technischer Offizier Lars Hoffsommer 1st Mate / 1. Nautischer Offizier
Ulrich Büchele 2nd Mate / 2. Nautischer Offizier
Anke Walter Surgeon / Schiffsarzt
Stefan Kasten 2nd Engineer / 2. Technischer Offizier Steffen Genschow 2nd Engineer / 2. Technischer Offizier
Hermann Pregler System Operator / Elektroniker (WTD) Stefan Meinecke System Operator / System-Manager (WTD) Patrick Adam Electrician / Elektriker
Deniz Yaylagül Motorman / Motorenwärter Johannes Fokken Motorman / Motorenwärter Matyas Talpai Motorman / Motorenwärter Thorsten Bierstedt Boatswain / Bootsmann
Reno Ross A.B. / Schiffsmechaniker (Deck) Dennis Vogel A.B. / Schiffsmechaniker (Deck) Torsten Kuszona A.B. / Schiffsmechaniker (Deck) Oliver Eidam A.B. / Schiffsmechaniker (Deck) Benjamin Brüdigam A.B. / Schiffsmechaniker (Deck) Ingo Fricke A.B. / Schiffsmechaniker (Deck) Frank Heibeck A.B. / Schiffsmechaniker (Deck) Volker Blohm Fitter / Deckschlosser
Andre Garnitz Cook / Koch
Frank Wienkamp Cooksmate / Kochsmaat
Alex Vogt Steward / Steward
Maik Steep Steward / Steward
Sven Kröger Steward / Steward
Bernardo Carolino Steward / Steward
FORSCHUNGSFAHRT
F Wenzhöfer
The cruise SO261 started on the 2nd of March 2018 in San Antonio (Chile) with the goal to investigate the Atacama Trench, located off the coast of Chile (Fig. 3.1). It is one of the deepest ocean trenches in the world and has a maximum depth of 8065m.
Figure 3.1 Cruise track by RV SONNE during SO261
An international team of 40 scientist from 17 different nations (Fig. 3.2) was on board to study the biogeochemical processes and biology from the water surface down to the seafloor of the trench system.
In the evening of March 4 we reached our first site at 2550m water depth, which we used as reference to compare to the later deep trench sites. We started the research program with the deployment of a bottom lander system (‘Reiver’) capable to take images of the seafloor.
We used this information to get a fist impression of the seafloor and to decide if our other instruments can be deployed there. Images from this 2500-site showed a nice plain seafloor ideal to perform our further measurements. Our station work at the shallow site 1 was completed with sediment sampling and in situ flux measurements. We then moved to the first trench site (site 6; S 24° 15.96’ W 71° 25.38’at 7830m water depth) at the southern end of our working area (Fig.3.1). At March 6 we started the sampling program with a camera-lander (Reiver) deployment to get some pictures of the seabed for evaluating lander configurations. During the lander deployment we collected water samples down to 6000m at intervals of 1000m for various analyses of geochemical and biological parameter. During the night, an OFOBS (Ocean Floor Observation and Bathymetry System) transect of the seaward trench slope was performed to get some impressions of the change in seafloor structure, habitats and fauna with depth. We observed several cliffs and areas of bare rock seafloor but also basins with sediment cover and abundant benthic organisms. The most abundant animal types included various holothurians, some of which were very colourful and also surprisingly good at rock climbing, with several spotted on narrow ledges on the sides of steep cliffs. During a second transect further north similar geological structures were observed, but also large fields of broken rock boulders were flown over, and sediments which were quite brown in appearance, perhaps indicting a different composition to those observed during the first dive. Our trench program was then continued with the deployment of several lander systems: Nano-Lander, Profiler-Lander and 2 Camera- /fish trap-Lander. During the time the lander systems performed their measurements at the trench bottom an intensive sediment sampling program was accomplished followed by water sampling from hadal depth (>6000m) using the Hadal-Rosette system, which is winched down to the trench bottom. The mounted Niskin bottles are triggered autonomously by a pressure sensor at defined water depth. The MOCNESS net was deployed during our transit from site 6 to site 5 (S 23° 49.02‘ W 71° 22.32‘), our second trench site at 7890m water depth (Fig. 3.1). It collected a depth-integrated zooplankton and fish sample on its way down to a maximum depth of 4200m, but it failed to open and close on its way up. After arriving at site 5 on March 10 our general set up of instrument operations was performed: Reiver-Camera-Lander, CTD/Rosette water sampling 6000m, Nano-Lander, Profiler-Lander, Sediment-Lander, Camera/fish trap-Lander 1
& 2, Hadal-Rosette, MUC and gravity corer. We finished our Lander program at our second site at 7890m with the successful recovery of all our lander systems in the morning of Monday March 12. Some of these lander systems are used to perform measurements directly at the seafloor. They are part of our subproject to quantify and characterize the diagenesis along the trench axis versus the abyssal plain. Recent investigations have shown that hadal trenches act as hotspots for deposition and turnover of organic material and therefore are more important for regional element cycling than previously anticipated. The activity is presumably driven by specialized microbial communities that are adapted to the extreme hydrostatic pressures in the trench – communities that are unknown to science. The Atacama Trench is underlying one of the most productive water columns in the world and is situated in a very seismic active region - we thus hypothesize that this trench in particular, due to elevated delivery of food, will host enhanced diagenetic activity. Our next targeted site was Richards Deep (site 4), the deepest point in the Atacama Trench with a water depth of 8065m. Here we performed an intensive water column and seafloor program for almost three days. The last gears recovered were the two camera-baited-trap lander systems to study hadal fishes. During our transit from Richards Deep to our next trench station (site 3 at 7994m) further north we used the MOCNESS net
to collect zooplankton. In the morning of March 16, the 14-hour deployment brought huge amounts of samples to the surface. All nets worked perfectly and the samples will be used to discriminate the zooplankton communities collected in different water depth (5000-4000m, 4000-3000m, 3000-2000m, 2000-1000m, 1000-0m). On March 19 we started our usual station program at another reference site (4000m water depth) with the Reiver camera system to get pictures of the seafloor, subsequently the other instruments followed. After retrieving all instruments back on deck and checking the first data a clear difference between hadal and abyssal sites could be observed. This was most obvious when looking at the in situ oxygen microprofiles. Here an oxygen penetration depth of > 20 cm could be observed at the 4000m site which is 4-times deeper than at the hadal sites. So, this is the first evidence that sediments at the bottom of the Atacama Trench show elevated rates of organic matter mineralization. On our expedition along the Atacama Trench we continued the work with the fifth hadal station further north at 21° 46.86’ S with our entire sampling program. Our sampling activities were finished with the third MOCCNESS net haul, sampling zooplankton at different water depth.
We continued our station work with another hadal site further north to finish our transect of sampling sites along the trench axis. On Tuesday 26 we reached our northern most site.
During the next two days we performed our water column and sediment sampling at this site and deployed our different lander system for the last time at hadal depth. In total we have investigated the Atacama-Trench axis along a ca 450 km long transect (Fig. 3.1). This allows us to assess the biological activity in the hadal Atacama Trench sediment and to evaluate local variability in the benthic mineralization activity and microbial processes in one of the deepest trenches on Earth. On March 28 we completed our work at the northern reference site at 4050m water depth with the recovery of our lander systems. In total we have managed to sample, besides the hadal sites, at three reference sites; two in the south of our transect and one in the north (Fig. 3.1). In the evening of March 28 we left our working area towards Guayaquil. During the four days of transit we were able to finalize all onboard analyses. In the morning of April 2 we entered the port in Guayaquil. Overall So261 was a very successful expedition bringing 40 scientists (Fig. 3.2) from 17 nations together to work concerted on the diversity and functioning of the Atacama Trench ecosystems. Using this multidisciplinary approach in comparing carbon and nutrient fluxes, the connection, composition and structure of communities from the water column to the seafloor using novel methods and technologies, we will provide novel insight on the Atacama trench and hadal ecosystems in general.
4. AIMS OF THE CRUISE / ZIELSETZUNG DER FORSCHUNGSFAHRT
RN Glud, F Wenzhöfer
Hadal trenches are some of the most remote, extreme, and scantly explored habitats on Earth – yet recent investigations have shown that trenched are hotspots for deposition and mineralization of organic material. The intensified biological activity in the trenches is believed to mainly be mediated by microbial communities adapted to the extreme hydrostatic pressure, but these largely remain unknown to science. In 2016 an advanced ERC grant – HADES- ERC – was awarded to among other things explore three large hadal trench systems in the Pacific; The Kermadec, the Japan and the Atacama trenches by the use of novel in situ instrumentation. These trenches were selected as they are underlying water columns of very different productivity - from the oligotrophic Kermadec trench to the eutrophic Atacama trench.
Voyage So261 is the second large expedition in the HADES-ERC project and aimed to explore biogeochemistry, microbiology and biology of the Atacama trench. The multidisciplinary but integrated team of 40 scientist and technicians include biogeochemist, geologists, biologist, molecular biologists and oceanographers covering research topics from virology to fish ecology.
The overall aim of the expedition is to understand material transport, particle deposition, benthic and pelagic biogeochemistry and ecology of the trench system but also to identify key organisms responsible for the processing of material in the trench. The insight will expand our present knowledge on deep sea biogeochemical functions, by including one of the most extreme and potentially most active hadal environments in our quantitative and conceptual understanding of the global ocean.
Specific questions addressed during this cruise were:
- What are the sedimentary processes sustaining the hadal community in the Atacama Trench?
- How do abundance, diversity and community structure of microorganisms, meio- and macrofauna organisms in the Atacama Trench differ from those in less productive trenches and nearby abyssal and shelf sites?
- What are the general biogeochemical characteristics of the surface and deep sediment, bottom water and water column in the euthrophic Atacama Trench?
- Which mineralization pathways are responsible for the organic matter break down in the eutrophic Atacama Trench?
- How efficient are microbial communities operating at extreme hydrostatic pressures in mineralizing organic material as compared to their shallower counterparts? And to what extent do specialized unknown extremophile microbial communities mediate these processes?
FORSCHUNGSFAHRT
F Wenzhöfer, RN Glud
The major goal of this expedition was to get a better understanding in biogeochemical processes and community structure of the Atacama trench system in highly productive surface waters. Detailed understanding of benthic biogeochemistry requires insight to the processes conveying sediment deposition, the nature of settling material, and the aerobic and anaerobic microbial-driven mineralization processes in the seafloor, all of which was explored during the cruise.
During the expedition, we performed lander deployments together with sediment and water sampling in the Atacama Trench system as well as adjacent abyssal and bathyal sites off Chile (Fig. 3.1 and 6.1). The sites were located within an area between 20° – 25° S and 70° - 73°W, and comprise a depth zone of 2500 – 8065m. The aim was to investigate several hadal stations along the Atacama Trench axis and 2 depth transects with stations at ca 6000 and 3000m. Originally it was also planned to visit 3 stations at 1000m at the continental shelf off Chile. However, it was not possible to get working permission to work in Chilean waters. For the visited sites the major aim was to address ecosystem functions such as benthic respiration, remineralization and nutrient transport, bacterial productivity, microbial as well as meio- and macrofauna biodiversity in the eutrophic Atacama Trench and to compare them with data from adjacent abyssal and bathyal sites.
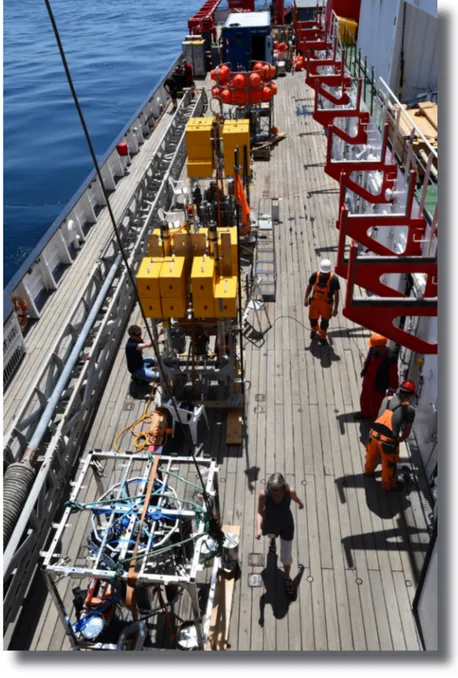
We performed in situ measurements using a variety of autonomous lander systems (Fig. 5.1):
Ultra-deep lander for in situ microprofiling and injection were used to investigate benthic fluxes and mineralization rates, a Nano-lander to study the bottom water microorganisms and camera lander systems to survey the faunal distribution. Preliminary inspections of photo and video footage from the stationary and towed camera systems provided a first characterization of the benthic fauna community and seafloor characteristics and were used to identify sites for further studies. The main focus of the cruise was to perform in situ studies on benthic process rates, including benthic fluxes and pore water concentration profiles of O2, NO3 and H2S. Multicorer and gravity corer samples were used to investigate the biodiversity of all taxonomic size classes of the benthic communities. Sediment samples were analyzed for their porosity, vertical gradients of nutrients, Corg contents, C/N ratios, biomarker, phytodetrital pigments, carbonates, and other geochemical parameters, to characterize the geochemical environment of the upper sediment layers. Surface sediments were also examined under sedimentological criteria, in order to assess delivery areas of the sediments. Other sediment samples retrieved by the MUC will be used to analyze virus abundance, bacterial cell numbers, RNA, DNA, all to characterize the benthic communities. At selected sites we used the gravity core (GC) to retrieve longer sediment cores for pore water chemistry and deep biosphere community structure analyzes.
A major component of our work was the evaluation of spatial distribution patterns in all size classes of benthic organisms including macro- and megafauna using video- and photo-footage.
Towed and stationary camera systems were used for detailed characterizations of the seafloor habitat and quantitative fauna surveys. Combined CTD measurements and water sampling were carried out to characterize the hydrographic conditions and community structure in the
with an Underwater Vision Profiler (UVP), sensors for conductivity, temperature, fluorescence, and 333µm nets for stratified samples. The UVP device will provide profiles of particle size distribution in the entire water column; while net samples will be split in fractions to examine live animals, animals for DNA analysis, and fixed samples for further taxonomic analysis.
Figure 5.1 Different lander systems on the deck of RV SONNE for investigating the Atacama trench system (Foto: F. Wenzhöfer)
DES ARBEITSGEBIETES
F Wenzhöfer, RN Glud
The Atacama Trench (the southern part of the Peru–Chile Trench), is one of the 27 globally existing hadal trenches, located in the eastern Pacific Ocean, about 160 kilometers off the coast of Chile. It is approx. 3700 kilometers long (entire Peru-Chile Trench 5900km) with a mean width of 100 kilometers (covering an area of ca 590,000 square kilometers). The trench delineates the boundary between the subducting Nazca Plate and the overriding South American Plate. The Atacama Trench is underlying the most productive ocean in the world and therefore it represents an extreme end-member with massive deposition of material degraded at highly elevated pressure (Jamieson 2015; Danovaro et al 2003).
We investigated 6 hadal sites and 3 abyssal sites (reference sites) along a 444km long transect stretching from 23° 49.0’ to 20° 19.1’ S (Fig. 6.1 and 6.2; Tab. 6.1). Site 1 at 2560m water depth severed as test sites for the in situ instruments.
8 7
3 4
5 1
2 10 9
Figure 6.1 Station map of the investigated sites
Table 6.1 Position and water depths of all sites
Site Lat Long Water depth (m)
1 23° 48.72’ S 70° 50.04’ W 2560
2 21° 46.86’ S 71° 12.48’ W 7994
3 23° 02.94’ S 71° 18.12’ W 7915
4 23° 21.78’ S 71° 20.60’ W 8085
5 23° 49.02’ S 71° 22.32’ W 7770
6 24° 15.96’ S 71° 25.38’ W 7720
7 22° 56.22’ S 71° 37.08’ W 5500
8 22° 56.40’ S 72° 08.76’ W 4000
9 20° 19.97’ S 70° 58.70’ W 4050
10 20° 19.14’ S 71° 17.46’ W 7770
Figure 6.2 Relative distance of the sites investigated
DER ARBEITEN IM DETAIL EINSCHLIESSLICH ERSTER ERGEBNISSE
7.1 CTD-O/Rosette System
W Schneider Gear description
The onboard CTD (Conductivity-Temperature-Depth) of RV Sonne is a Sea-Bird Electronics Inc.
SBE 911plus system (Fig. 7.1.1). The unit is equipped with duplicate sensors for temperature (SBE3plus) and conductivity (SBE4C), a pressure sensor (Digiquartz 410K-134) and is connected to a SBE 32 carousel water sampler with 24 12-liter Niskin bottles. Additionally, an altimeter (Benthos PSA-916), Fluorescence/Turbidity sensor (WETLabs FLNTU), a PAR sensor (QCP2300-HP) and two dissolved oxygen sensors (SBE43) are mounted. The computation of oxygen concentration requires temperature, salinity and pressure which are measured by the CTD system.
Figure 7.1.1 CTD deployment (Foto: L.
Hehemann)
Sampling/subsampling
During SO261 a total of 17 CTD casts (Tab. 7.1.1) were performed to collect water samples to monitor the distribution of the Oxygen-Minimum Zone (OMZ) in the investigation area.
Table 7.1.1 List of CTD casts
Site/St. #Date (2018) Filename Depth/CTD Comments
==============================================================
Site 1 S: 23° 48.72’ W: 70° 50.04‘
01/002 05-03 SO261_01_002 2544/2500 m Down only 01/007 06-03 SO261_01_007 2548/2400 m
01/011 06-03 SO261_01_011 2567/1000 m
++++++++++++++++++++++++++++++++++++++++++++++++++++++++++++++
Site 6 S: 24° 15.96’ W: 71° 25.38’
06/013 06-03 SO261_06_013 7834/6000 m 06/024 09-03 SO261_06_024 7835/6000 m
++++++++++++++++++++++++++++++++++++++++++++++++++++++++++++++
Site 5 S: 23° 49.02’ W: 71° 22.32’
05/028 10-03 SO261_05_028 7886/6000 m
++++++++++++++++++++++++++++++++++++++++++++++++++++++++++++++
Site 4 S: 23° 21.78’ W: 71° 20.60’
04/039 12-03 SO261_04_039 8062/6000 m 04/041 13-03 SO261_04_041 8064/6000 m 04/054 15-03 SO261_04_054 8065/6000 m
++++++++++++++++++++++++++++++++++++++++++++++++++++++++++++++
Site 3 S: 23° 02.94’ W: 71° 18.12’
03/057 16-03 SO261_03_057 7994/6000 m
++++++++++++++++++++++++++++++++++++++++++++++++++++++++++++++
Site 7 S: 22° 56.22’ W: 71° 37.08’
07/074 19-03 SO261_07_074 5539/5400 m
++++++++++++++++++++++++++++++++++++++++++++++++++++++++++++++
Site 8 S: 22° 56.40’ W: 72° 08.76’
08/080 21-03 SO261_08_080 4115/4000 m
++++++++++++++++++++++++++++++++++++++++++++++++++++++++++++++
Site 2 S: 21° 46.86’ W: 71° 12.48’
02/082 22-03 SO261_02_082 7848/6000 m 02/089 22-03 SO261_02_089 7909/6000 m 02/095 24-03 SO261_02_095 7883/6000 m
++++++++++++++++++++++++++++++++++++++++++++++++++++++++++++++
Site 10 S: 20° 19.14’ W: 71° 17.46’
10/100 26-03 SO261_10_100 7742/6000 m
++++++++++++++++++++++++++++++++++++++++++++++++++++++++++++++
Site 9 S: 20° 19.97’ W: 70° 58.70’
09/110 28-03 SO261_09_110 4020/3997 m
++++++++++++++++++++++++++++++++++++++++++++++++++++++++++++++
7.2 Multi Corer (MUC)
M Zabel Gear description
The coring device suited best for the sampling of undisturbed surface sediments including overlying bottom water is the multicorer (MUC; Fig. 7.2.1). The MUC used during the cruise was equipped with twelve large plastic tubes, each of 60 cm length and 9, 5 cm in diameter, respectively.
Figure 7.2.1 Recovery of the MUC (A) and sediment cores from 8063m water depth (Fotos:
M. Schlösser)
The weight of the MUC was chosen so that the bottom contact of the device was still clearly recognizable by the rope tension even at great water depth (Fig. 7.2.2).
Figure 7.2.2 Rope tension during first MUC deployment at Site 4 (Station SO261-48;
A B
Sampling/subsampling
On each station the MUC was deployed twice to fulfill all scientific inquiries (cf. Tab. 7.9.1 and Station list). In total the MUC was deployed 18 times with great success. Depending on the sediment composition, the recovery of the multicorer cores varied between 25 and 48 cm.
We finished the station work with 214 cores with surface sediments. Only two single tubes were lost due to a broken flap. Depending on the visual sediment characteristics (accessible through Reiver deployments; cf. section 7.5.5), the hive and veer velocities varied between 0,5–1,0 m/s. For details of subsampling, please see research specific sections from 7.9.
7.3 Gravity Corer (GC)
M Zabel Gear description
During this cruise we used a classical gravity corer (GC; Fig. 7.3.1), which consists of an upper weight of 1,5 t, steel pipes of 6 – 12 m length with internal, exchangeable plastic tubes and a core catcher. The hive and veer velocities varied between 1,0–1,2 m/s. In total, the device was deployed 9 times. In the center of the trench (Sites 2-6 and 8) we could recover 7 sediment cores with lengths of 3,4–6,3 m. At the abyssal plain sites (7) a sediment core of 8,6 m lengths could be recovered. The total length of all sediment cores recovered during expedition SO261 is 38,5 m.
Figure 7.3.1 Recovery of the Gravity Corer (GC) (Foto: N. Ramirez)
Sampling/subsampling
Once on deck, the plastic liners were pulled out of the steel pipe, sliced into 1 m segments and transported to a cool lab until they were processed (cf. section 7.9). Already on deck, syringe (headspace) samples were taken from the bottom of each core and from the lower ends of all segments for analyses of methane at MARUM.
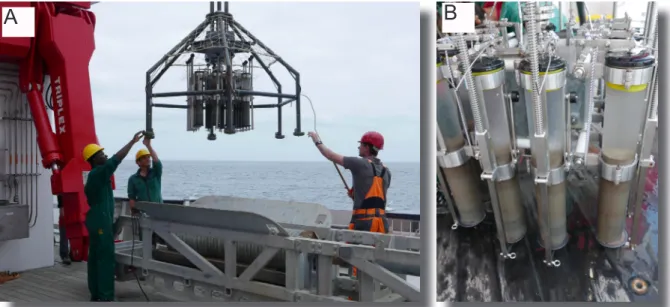
7.4 Hadal-Rosette
M Larsen, RN Glud, C Schauberger
The hadal rosette consist of 6 x12L Niskin-bottles and 4-6 x 7L Niskin-bottles mounted in an outer frame (Fig 7.4.1). The bottles are released pairwise when the instrument reach a pre-programmed hydrostatic pressure while being lowered by the oceanographic winch. The frame was loaded with additional ballast weights (ie ~ 400Kg) to enable fast lowering of the instrument by the winch system. Bottles can either be released on the descend or the ascend.
At this cruise the targeted depth ranged from 6500m to 7700m water depth. Samples were shared and used for a wide range of analysis by different cruise participants (see sections below and the appendix on tabulated samples).
The instrument also hosted two sets of 50ml syringes – each set with five individual syringes. As for the bottles the syringes could be released and sample water once a given pre-programmed hydrostatic pressure was reached. Some syringes were pre-spiked with fixatives and the samples were used to assess the importance of in situ fixation versus on-board fixation when quantifying cell abundance and Virus Like Particle (VLP) abundance in water samples (see 7.13).
Figure 7.4.1 Sampling water from the Hadal-Rosette (Foto: M. Gerringer)
In addition, the frame of the rosette was used as a vehicle for different accessory equipment such as the hadal CTD (when the nano-lander not was deployed), hadal ranged O2 sensing optodes (see section 7.5.5), pressure retaining water sampler (see section 7.13) and cameras to inspect instrument performance.
The hadal rosette was deployed 16 times during the cruise – 15 deployments were successful.
7.5 Lander Systems 7.5.1 Flux-Lander
F Wenzhöfer, A Nordhausen, V Asendorf, RN Glud
The MPI-Benthic-Lander-System (Fig. 7.5.1.1) was used to quantify benthic exchange and mineralization rates in situ at the reference sites. The Lander system was equipped with three benthic chamber modules and a two-axis Microprofiler (vertical profiling and lateral translation). The benthic chambers were used to measure total oxygen uptake (TOU) and dissolved inorganic carbon (DIC) as well as nutrient exchange of the sediment integrating all relevant solute transport processes (diffusion, advection and fauna-mediated transport) and an area of 400cm2.
Figure 7.5.1.1 Deployment of the Benthic-Lander-System at an abyssal site (Foto: N.
Ramirez)
During the deployment an oxygen optode measured changes in oxygen concentration and 7 syringes took water samples at pre-programmed time intervals for analyses of DIC and nutrients. Furthermore, the enclosed sediments were retrieved and sampled on board for total organic carbon (TOC) and photopigment content, and for abundances of microorganisms and fauna. The X-Y microprofiler was used to quantify diffusive oxygen uptake (DOU), which is generally assigned to microbial respiration. Each microprofiler was equipped with a total of eleven microsensors measuring vertical distributions of oxygen (6 sensors), pH (2), NOx (2), and resistivity (1). Measurements across the water-sediment interface and within the upper sediment layer were performed with a vertical resolution of 150µm and extending over a total length of 15-25cm. During the deployments the microprofiler performed five vertical profiles.
The profiling unit was translated laterally by 9cm between replicate profiles to avoid profiling of the same sediment patch.
7.5.2 Hadal Profiler-Lander
RN Glud, M Larsen, F Wenzhöfer, A Glud, A Nordhausen, V Asendorf
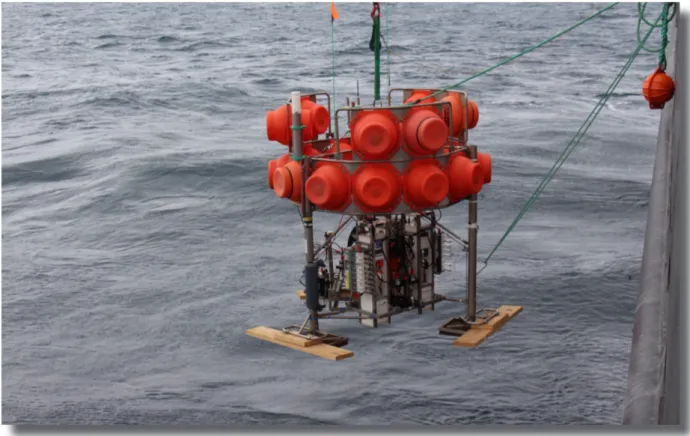
The autonomous profiler-Lander is about 3.2 m high and has an overall weight of 1 ton in air (Fig. 7.5.2.1). The buoyancy (~-250kg) is ensured by syntactic foam while the ballast (~200kg) consists of small iron beads loaded in 4 metal buckets. The instrument is released from the ship by a “slip-hook” and sink to the seabed at roughly 45m min-1. Once at the seabed the instrument completes a pre-programmed measuring cycle lasting 12-40 h depending on time availability, Once the program is completed, the ballast is released acoustically by a hydrophone from the surface or by a burn-wire system that is included in the lander design as a safety release mechanism. On average the instrument ascends by ~45m min-1 and once at the surface it can be tracked and located by radio and at night time by a blinking flash.
Figure 7.5.2.1 Recovery of the hadal Profiler-Lander (A) and mounted electrodes (B) (Fotos:
M. Schlösser)
The central electronic cylinder contained 10 electrochemical microsensors. During this voyage we applied 1 resistivity sensor and 9 O2 microsensors of which two occasionally where exchanged with NO biosensors. The central cylinder was mounted in an elevator that could
A B
moved horizontally in larger steps. During this campaign the electronic cylinder was typically moved vertically at 0.1mm resolution for 10cm, and subsequently an additional 10-20cm at 0.15mm resolution where after the sensors were moved back to the start position. The horizontal movement were either 12 or 6cm and initiated after each vertical profile. The number of vertical profiles ranged between 2 to 8 depending on available bottom time and if NO3- sensors were mounted or not (NO3- sensors have a longer response time and require a longer equilibration time at each depth). Data was stored in the central cylinder and downloaded after the instrument had been recovered. The lander was further more equipped with one Niskin bottle for sampling bottom water for sensor calibration and occasionally with a camera to monitor instrument performance.
The profling lander was deployed 8 times and provided between ~5 to ~70 profiles at each site depending on bottom time and the performance and breaking of individual sensors.
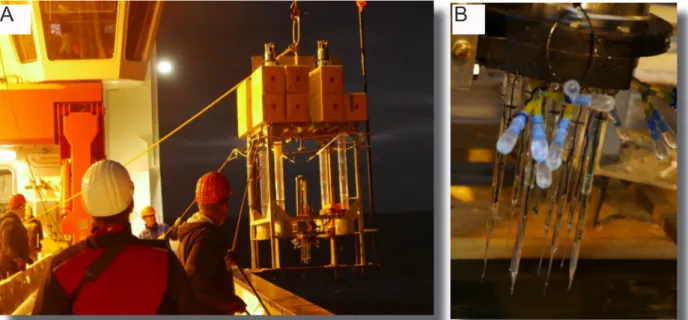
7.5.3 Hadal Sediment-Lander
M Larsen, B Thamdrup, RN Glud, F Wenzhöfer
The sediment lander is also autonomous and is equipped with syntactic foam, ballast and a ballast release system as the profiling lander – and roughly descend at the same speed (Fig. 7.5.3.1), However, this instrument is designed to i) collect six sediment cores and ii) to vertically inject various tracers in the sediment for in situ incubations. During this cruise we injected 15NO3-, 15NO2- and 15NH4+ to quantify key processes in the benthic nitrogen cycle. At some stations we also injected Br- as an inert tracer for documenting the ability to evenly inject tracers in the sediment and explore to what extent lander recovery and core handling could displace tracer. About 250ml was injected at the respective deployments.
Figure 7.5.3.1 Deployment of the hadal Sediment-Lander (A) and retrieved sediment core (B) (Fotos: M. Schlösser)
A B
During a successful deployment, the tracers are injected in each core at a regular time interval of 2-6 hours (depending on bottom time). The needles are fixed in the lid and a volume of 250ml is injected at a vertical resolution of 0.75cm. In each core we can apply 1 to 3 needles for vertical injection over 10-20cm depending on the sediment penetration depth of the core liners. After injection the sediment cores are retracted into the bottom water for incubation until the end of the program. At this point in time the ballast is released and after an ascend at ~50 m min-1 the instrument is recovered as for the profiling lander.
The overall idea of this measuring procedure is that all cores will be exposed to changes in hydrostatic pressure and transient heating and thus process measurements in the respective cores will be affected in the same way by any potential recovery artefacts. However, any gradual increase in labelled products during the in situ incubation will reflect the actual in situ process rate. Upon recovery the sediment cores are taken into the cool lab to be sections at in situ temperature. Subsamples and pore water is extracted and fixed for later analysis.
The sediment lander was deployed at seven sites but on most initial trials only a few or none of the liners retracted the sediment when driven out of the seabed. At the last two deployments core catchers were installed in all liners and sediment recovery was 100% successful for these two deployments. The surface of the sediment appeared disturbed by the catchers but the subsurface sediment appeared intact. The recovered sediment was sectioned and fixed and now await analysis at SDU.
7.5.4 Camera Lander
A Jamieson, T Linley, H Stewart, M Gerringer Gear description
The camera landers (Fig. 7.5.4.1) are two identical hadal-rated baited camera system that comprise a delivery system of one acoustic release (Oceano 2500 Ti-Deep; IXSEA France), seven 17” glass spheres (Vitrovex; Nautilus Marine, Germany) on 50 m long mooring, and a 120kg steel ballast weight. The scientific payload comprised a bespoke HD video and still camera with LED illumination, powered by a 12V lead acid battery (SeaBattery; DSPL, US).
The landers also recorded pressure and temperature (RBR Duet; RBR Ltd, UK). Physical samples were recovered using two different types of traps. The first was a large fish trap, 1 x 0.4 x 0.4m in size, fitted with 1 cm gauge netting. The seconds was a 1m long by 180mm diameter polycarbonate funnel trap. Both traps were set to sit directly on the seafloor and were baited with locally sourced fish (Scombridae). The landers were deployed from the aft and descended at ~45 m/min and once ballast was released by acoustic command, surfaced at ~50m/min.
Sampling/subsampling
The camera landers were deployed 18 times across the entire depth range of the trench (2500- 8052m; Tab. 7.5.4.1). Every deployment was successful and ~335 gigabytes of video and image data were collected. These data were downloaded and backed up after every dive.
The physical samples were immediately put on ice and transported to the cold room where the majority of amphipod samples were preserved in Ethanol while some were preserved and frozen in RNA later for genetic work. The fish were preserved in formalin.
Table 7.5.4.1 Camera lander deployments.
Station Date Gear Latitude Longitude Depth (m)
05 05-Mar C-1 -23.816 -70.835 2543
06 05-Mar C-2 -23.821 -70.8361 2537
17 07-Mar C-1 -24.275 -71.4231 7782
18 07-Mar C-2 -24.28 -71.4232 7834
31 10-Mar C-1 -23.829 -71.3463 7608
32 10-Mar C-2 -23.833 -71.3439 7493
45 13-Mar C-2 -23.3796 -71.3447 8052
46 13-Mar C-1 -23.3731 -71.393 7204
60 16-Mar C-1 -23.05 -71.2507 7139
61 16-Mar C-2 -23.0503 -71.2332 6974
72 19-Mar C-1 -22.9491 -71.62 5563
73 19-Mar C-2 -22.938 -71.6781 4974
87 22-Mar C-1 -21.7416 -71.2578 6714
88 22-Mar C-2 -21.7203 -71.2636 6520
103 25-Mar C-1 -20.3435 -71.1214 5920
104 25-Mar C-2 -20.3435 -71.1304 6025
113 27-Mar C-1 -20.3424 -70.9901 4051
114 27-Mar C-2 -20.3469 -70.9901 4100
Figure 7.5.4.1 One of the camera landers being deployment from the stern of Sonne on SO261 (Foto: T. Linley)
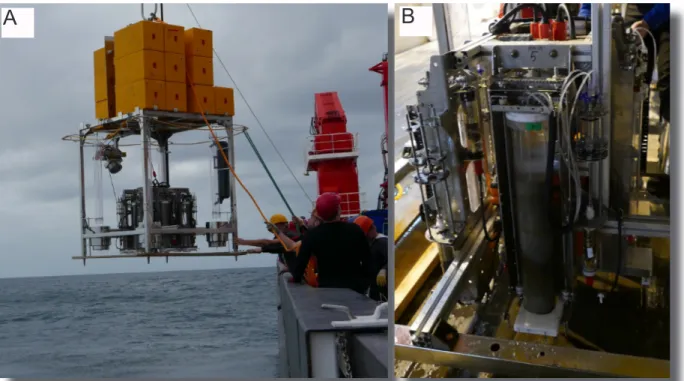
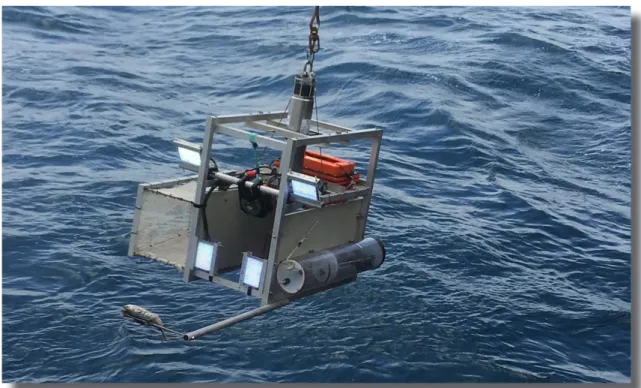
7.5.5 Reiver
A Jamieson, K Oguri, T Linley Gear description
The Reiver is a system that free falls to the seafloor to capture a rapid assessment of the seafloor substrate prior to the deployment of the larger profiling and sediment landers. The objective is assessed whether the seafloor is suitable for these more substrate sensitive systems. The Reiver therefore often only remains on the seafloor for <1h prior to release by acoustic command. As the substrate and geological complexity of the trench is unknown, the Reiver was rigged in such a way that a 120kg ballast weight was suspended below the camera, just maintaining the system above any uneven ground.
The Reiver was typically the first system to deployed at each site and soon as the cameras were back on board, the imagery was downloaded, viewed and decision was made whether or not continue at that locations. In all but one site, the seafloor was considered suitable and work began (Fig. 7.5.5.3).
There were two types of Reiver used on SO261, at depths less than 6000m an abyssal system (Reiver 1) was used and at depth >6000m, a hadal system was used (Reiver 2; see Table 7.5.5.1)
Abyssal camera
On the abyssal stations the Reiver was equipped with an HD video camera of a bespoke design mounted in such a way that the ballast weight was suspended 2m below the camera (Fig. 7.5.5.1). The abyssal system also included a current meter with CTD sensors (SeaGuard;
Aanderaa, Norway). The abyssal system descended at 55 m/min and surface at ~65 m/min. It was programmed to film for 30 seconds every minute.
Figure 7.5.5.1 The Abyssal Reiver 1 (Fotos: A. Jamieson)
Table 7.5.5.1 Reiver 1 and 2 deployments
Station Date Gear Latitude Longitude Depth (m)
01 05-Mar Reiver 1 -23.812 -70.8342 2552
12 06-Mar Reiver 2 -24.266 -71.423 7842
27 10-Mar Reiver 2 -23.817 -71.372 7893
38 13-Mar Reiver 2 -23.3627 -71.3433 8064
56 16-Mar Reiver 2 -23.0494 -71.3021 7990
68 19-Mar Reiver 1 -22.9378 -71.618 5476
79 21-Mar Reiver 1 -22.9413 -72.1459 3995
81 21-Mar Reiver 2 -21.781 -71.2079 7915
99 25-Mar Reiver 2 -20.3191 -71.291 7741
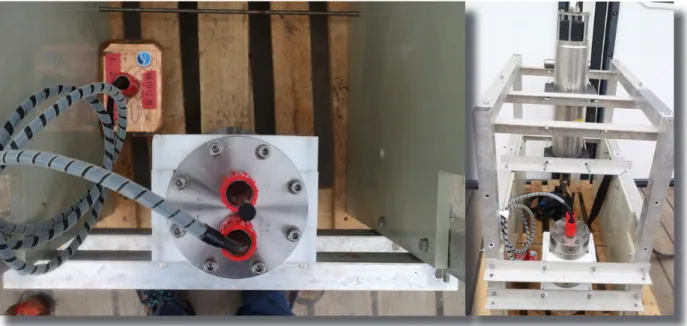
Hadal Camera
A hadal camera and a LED light were mounted in Reiver to observe sea floor and benthic organisms. This camera is consisted of 11000m–rated titanium pressure cylinder incorporated with a commercialized HDTV digital video camera (GZ-V590C modified, JVC Kenwood, Japan), eight Li-ion batteries (NCR18650B, Panasonic, Japan) and a handmade programmable timer circuit. The LED light is constructed to plasticize a print circuit board mounted sixteen 3W white LEDs and four resisters for current regulation in epoxy resin (Oguri et al., 2015). The power consumption of the light is ca. 15 W (14.8V, >1A). Fig. 7.5.5.2 shows the Hadal camera system mounted in the Reiver frame.
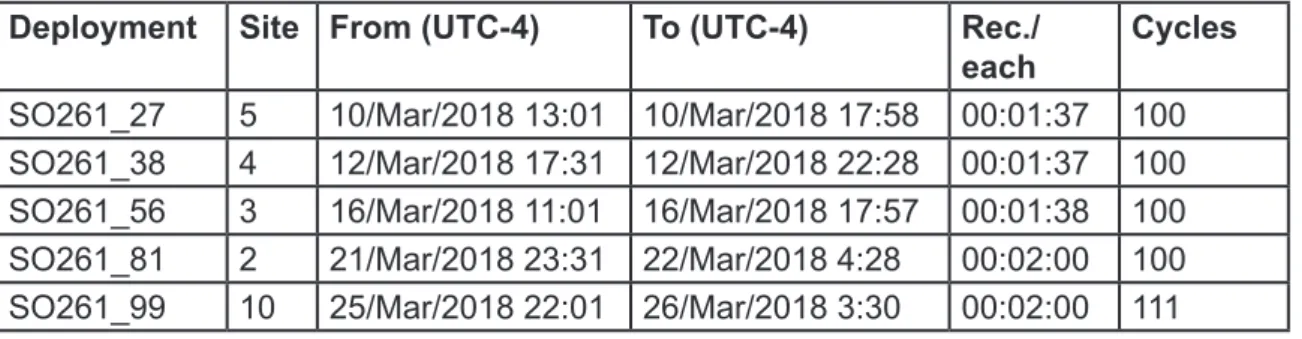
The timer programming was made by connecting the timer board with a PC via serial communication. The date/time of starting video recording, recording time, sting time and the repeat cycles were configured (Table 7.5.4.2).
Figure 7.5.5.2 The hadal camera and the LED light mounted on Reiver (Fotos: (T. Linley)
Table 7.5.5.2 Recording configurations of the hadal camera. Each cycle was set to 00:03:00.
Deployment Site From (UTC-4) To (UTC-4) Rec./
each Cycles
SO261_27 5 10/Mar/2018 13:01 10/Mar/2018 17:58 00:01:37 100 SO261_38 4 12/Mar/2018 17:31 12/Mar/2018 22:28 00:01:37 100 SO261_56 3 16/Mar/2018 11:01 16/Mar/2018 17:57 00:01:38 100 SO261_81 2 21/Mar/2018 23:31 22/Mar/2018 4:28 00:02:00 100 SO261_99 10 25/Mar/2018 22:01 26/Mar/2018 3:30 00:02:00 111
Figure 7.5.5.3 Examples of Reiver imagery. The top left shows a typical (and suitable for sampling) abyssal sedimented seafloor. The top right shows a geological complexity considered not suitable for sampling. The bottom image, from the hadal-camera, shows a typical seafloor
from the trench axis >8000m (Fotos: A. Jamieson)
7.5.6 Nano-Lander
N Ramirez, G Alarcon, E Flores, L Arias, O Ulloa Gear description
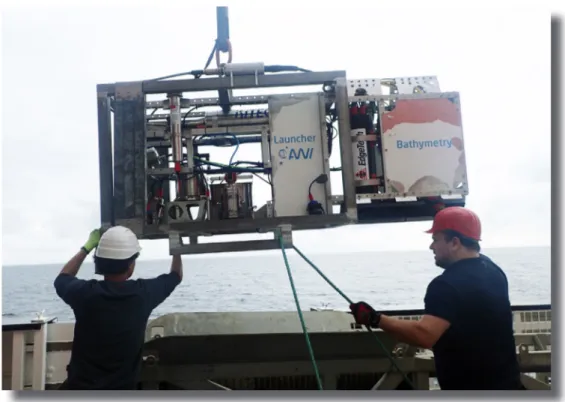
The Nano-lander “Audacia” from the Instituto Milenio de Oceanografía, Universidad de Concepción (IMO-UdeC, Chile) is 244cm tall x 64cm wide (125mm wide with the side variable flotation pods) x 53cm deep, with and weight of approximately 182kg (Fig. 7.5.6.1). An expendable anchor weighing 40 kg takes the lander to the bottom at about 1 m/s. This compact ocean lander was designed and built by Kevin Hardy, Global Ocean Design (San Diego, CA).
A hadal SeaBird SBE19 plus CTD-O (Sea-Bird Scientific, Bellevue, WA) is its primary sensor package. The dissolved oxygen sensor was not available for the Sonne SO261 cruise on time, so a hadal Aanderaa optode sensor (www.aanderaa.com), provided by Kazumaza Oguri (Jamstec, see below), was successfully mounted on the lander. The Nano-lander also has a drop arm with a baited trap, a self-recording underwater video camera, and two 30-L Niskin bottles. For Sonne SO261, a pressure-compensated LED light for the camera was kindly provided by Kazumaza Oguri.
Sampling/subsampling
The Nano-lander was deployed 5 times (one at Sites 6, 5, and 2, and two at Site 4). The geographical location and maximum depth reached for the CTD records are given in Table 7.5.6.1.
Table 7.5.6.1 CTD SBE 19 plus deployments on Nano-lander.
File name Operation Date Latitude Longitude Max Depth [m]
SBE19plus_01907824_2018_03_08_
HADES_06 SO261_15-1 07/03/18 24º 15.963‘
S 071º 25.385‘
W 7856.2
SBE19plus_01907824_2018_03_12_
HADES_05 SO261_33-1 10/03/18 23º 49.023‘
S 071º 22.314‘
W 7906.7
SBE19plus_01907824_2018_03_15_
HADES_04 SO261_51-1 14/03/18 23º 23.118‘ S 071º 20.722‘
W 8079.2
Figure 7.5.6.1 Recovery of the Nano- Lander (Foto: N. Ramirez)
File name Operation Date Latitude Longitude Max Depth [m]
SBE19plus_01907824_2018_03_23_
HADES_02 SO261_86-1 22/03/18 21º 47.051‘
S 071º 12.256‘
W 7953.2
* Bottom depth is ~1.2 m deeper than the CTD pressure sensor.
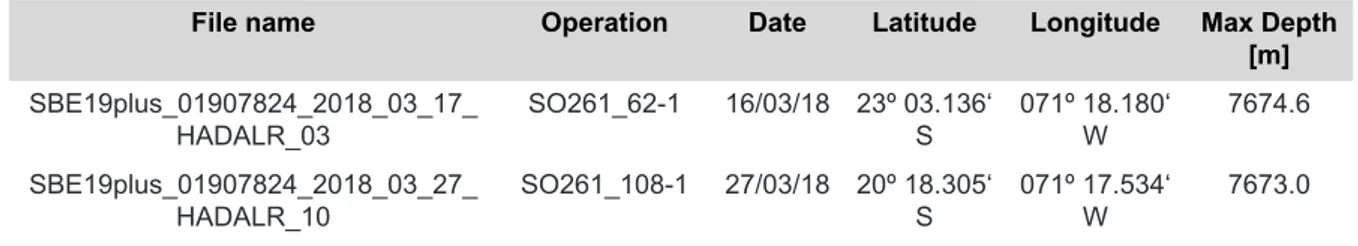
Additionally, the CTD SBE 19 plus was mounted on the Hadal Rosette at Sites 3 and 10. The details are given in Table 7.5.6.2.
Table 7.5.6.2 CTD SBE 19plus deployments on Hadal Rosette.
File name Operation Date Latitude Longitude Max Depth [m]
SBE19plus_01907824_2018_03_17_
HADALR_03 SO261_62-1 16/03/18 23º 03.136‘
S 071º 18.180‘
W 7674.6
SBE19plus_01907824_2018_03_27_
HADALR_10 SO261_108-1 27/03/18 20º 18.305‘
S 071º 17.534‘
W 7673.0
Seawater samples were taken from the Niskin bottles for microbial cell abundance, DNA, chlorophyll, and chemical variables (dissolved oxygen, nutrients, DIC, DOC, alkalinity, pH, PO13C, PO15N, 14C-DIC). To complement measurements from the Nano-lander, seawater samples for the same variables were taken from the ship´s Rosette and the Hadal Rosette. A summary is given in Table 7.5.6.3.
Table 7.5.6.3 Summary table for sampling of chemical and biological discrete samples.
Operation Site Equipment
SO261_02 1 CTD/Rosett
SO261_07 1 CTD/Rosette
SO261_11 1 CTD/Rosette
SO261_13 6 CTD/Rosette
SO261_06_19 6 Hadal Rosette
SO261_06_023 6 CTD/Rosette
SO261_06_024 6 Hadal Rosette
SO261_28 5 CTD/Rosette
SO261_34 5 Hadal Rosette
SO261_33 5 NanoLander
SO261_29 5 Sediment Lander
SO261_30 5 Profiler Lander
SO261_39 4 CTD/Rosette
SO261_40 4 Hadal Rosette
SO261_04_42 4 Nano Lander
SO261_41 4 CTD/Rosette
SO261_47 4 Hadal Rosette
SO261_51 4 NanoLander
SO261_54 4 CTD/Rosette
SO261_57 3 CTD/Rosette
SO261_62 3 Hadal Rosette
Operation Site Equipment
SO261_07_74 7 CTD/Rosette
SO261_08_80 8 CTD/Rosette
SO261_02_82 2 CTD/Rosette
SO261__02_89 2 CTD/Rosette
SO261_02_91 2 Hadal Rosette
SO261_02_86 2 NanoLander
SO261_02_96 2 Hadal Rosette
SO261_10_100 10 CTD/Rosette
SO261_10_108 10 Hadal Rosette
SO261_09_110 9 CTD/Rosette
O2 sensor and the O2 profiles in water column
To obtain O2 profiles in water column, a hadal optical O2 sensor (Optode 5331, Xyrem, Norway) and a serial data logger (Handmade equipped with a Raspberry Pi Zero, England) in a titanium pressure cylinder were installed in the Nano Lander (Fig. 7.5.6.2). The O2 data were obtained every 5 seconds interval (Fig. 7.5.6.3). The raw data were corrected to refer temperature, salinity and water depth acquired in parallel with a CTD (SBE19 plus, Seabird Electronics, USA) following the formula and the constants shown in the manual.
Figure 7.5.6.2 O2 sensor (left) and the data logger (right) used for measuring the O2 profiles.
Figure 7.5.6.3 Profiles of temperature (ºC), salinity and dissolved O2 (µM) in water column.
Vertical axis in each graph represents water depth (m).
SO261_86 Site 2
SO261_51 Site 4
Figure 7.5.6.3 continued Profiles of temperature (ºC), salinity and dissolved O2 (µM) in water column. Vertical axis in each graph represents water depth (m).
7.6 Ocean Floor Observation and Bathymetry System (OFOBS)
A Purser, U Hoge, L Hehemann Gear description
The Ocean Floor Observation and Bathymetry System (OFOBS) is a recently developed 6000m depth rated, towed imaging and acoustic system, integrating a high-resolution photo- camera (iSiTEC, CANON EOS 5D Mark III), high definition video-camera (iSiTEC, Sony FCB-H11), forward facing acoustic camera and EdgeTech 2205 AUV/ROV MPES (multiphase echosounder) with two sidescan frequencies (low/LF: 230 kHz and high/HF: 540kHz) for different range and resolution achievements (Fig.7.6.1). The cameras and acoustic devices are mounted on a steel frame (140L x 92W x 135H cm), together with two strobe lights (iSiTEC UW-Blitz 250, TTL driven), three laser pointers at a distance of 50cm from each other that were used to estimate the size of seafloor structures, four LED lights, a USBL positioning system (Posidonia) coupled with a IXUS 6000 G3 Inertial Navigation System with integrated Nortek N3015 DVL to track the position of the OFOS during deployments. For a more detailed description of the system see Purser et al. (2018).
OFOBS survey tracks
The 6000m depth rating of the OFOBS prevented its use in the central regions of the Atacma Trench. During SO261 seven scientific deployments were made on the overriding and subducting flanks of the Atacama Trench, of various duration (Table 7.6.1). Commonly these deployments were planned to survey in greater detail topographical features such as ridges and trenches previously mapped during ship based bathymetric surveys. Problems with the fibre connection to the RV Sonne resulted in the early termination of several dives, but in all cases the seafloor was at least imaged by the system, providing information of seafloor type (muddy, rocky, cliffs etc) and a brief impression of the fauna.
SO261_15 Site 6 SO261_33
Site 5
Figure 7.6.1 OFOBS, deployed during SO261 (Foto A Purser)
Due to the high interest in water column activities and processes at the sites visited by the cruise, and effort was made to also image zooplankton, detritus and megafauna during OFOBS deployments and recoveries.
Table 7.6.1 List of OFOBS deployments during SO261.
Station Number
SO261 Date (UTC) At Bottom
(UTC) Off Bottom
(UTC) Seafloor distance
Imaged (m)
Number of collected
seafloor images
Approximate still image
coverage (m2)
3 05/3/2018 N.A. N.A. N.A N.A. N.A.
14 07/3/2018 10:32:16 13:58:46 6000 952 4570
26 10/3/2018 08:49:20 11:13:51 4000 627 3010
53 15/3/2018 11:03:39 11:11:12 5 37 178
66 18/3/2018 03:56:42 04:05:13 5 37 178
78 21/3/2018 05:16:14 05:18:50 5 9 20
90 24/3/2018 02:40:59 03:48:36 700 327 1570
109 27/3/2018 22:23:16 02:31:43 3700 1035 5400
TOTAL COUNTS AND COVERAGES: 3024 14515
Results and Fauna
With the exceptions of deployments SO261-14 and SO261-26, all OFOBS deployments filmed seafloor comprised of primarily soft sediments. The dive tracks and example images of the seafloor from each dive are provided below (Fig. 7.6.2 to 7.6.8):
Station SO261-14
Figure 7.6.2 LEFT: Seafloor track for OFOBS deployment SO261-14. RIGHT: Typical seafloor imaged during deployment. Soft sediments with occasional compacted sediment
ridges (Fotos: L Hehemann) Station SO261-26
Figure 7.6.3 LEFT: Seafloor track for OFOBS deployment SO261-26. RIGHT: One example of the two typical seafloor types imaged during deployment. Here, a steep slope of hard
sediment / rock blocks is shown. Throughout the deployment, such exposures were intermixed with soft sediment areas (Fotos: L. Hehemann)
Station SO261-53
Figure 7.6.4 LEFT: Location of brief OFOBS deployment SO261-55. RIGHT: Typical seafloor
Station SO261-66
Figure 7.6.5 LEFT: Location of brief OFOBS deployment SO261-66. RIGHT: Typical seafloor imaged during deployment. Soft sediments with heavy bioturbation observed (Fotos: L.
Hehemann) Station SO261-78
Figure 7.6.6 LEFT: Location of brief OFOBS deployment SO261-78. RIGHT: Typical seafloor imaged during deployment. Soft sediments observed (Fotos: L. Hehemann)
Station SO261-90
Figure 7.6.7 LEFT: Seafloor track for OFOBS deployment SO261-90. RIGHT: Typical seafloor imaged during deployment. Soft sediments observed throughout the dive transect
Station So261-109
Figure 7.6.8 LEFT: Seafloor track for OFOBS deployment SO261-109. RIGHT: Typical seafloor imaged during deployment. Soft sediments observed throughout the dive transect
(Fotos: L. Hehemann)
Fauna
The seafloor imaged during SO261 was rather abundant in mobile and sessile fauna. Numerous amphipods, ophiuroids, starfish, holothurians, isopods and polychaetes were observed across all surveyed regions (Fig. 7.6.9). The hard outcrops imaged during SO261-14 and So261-26 supported communities of encrusting and stalked sponges not observed in any abundance elsewhere during the cruise. Few fish were observed at the deeper surveyed sites, though during SO261-109 a number of fish and fish species were present. Cephalopods, though present in the water column throughout many deployments, with octopods only observed on the seafloor during SO261-109, with two individuals highly reminiscent of the species’ observed in the Peru Basin at comparable depths (Purser et al., 2016). One of these individuals seemed to have been attracted to a recent dead fish food fall, or to prey upon crabs feeding on the fish remains. Despite a general similarity in species richness to that observed in the Peru Basin (Boetius, 2015) and the apparently near uniform seafloor structure, for each OFOBS deployment the dominant species differed, indicating a potentially complex mix of microhabitats not immediately distinguishable in imagery or bathymetry.
7.6.4 Acoustics
Forward facing acoustic camera and sidescan data were collected throughout each dive.
The forward facing acoustic camera was extremely useful for OFOBS height correction in the rockier surveyed regions, such as those observed during SO261-26. The side scan data will be processed in forthcoming months.
7.6.5 Data availability
All acoustic and image data collected during SO261 by the OFOBS system was provided during the cruise to the onboard scientific party, and will be made publically available via the PANGAEA archive within 6 months of cruise completion. High resolution georeferenced bathymetric products derived from video frames and still images will be available via PANGAEA within two years of cruise completion.
Figure 7.6.9 Selected images of charismatic megafauna observed during the SO261 OFOBS deployments. Black bar represents 10 cm. A – holothurian, B – holthurian, C – burrowing anemone?, D – cushion star, E – Octopod, F – several sponge species, G – holothurian, H –
galatheid crab on dead fish food fall, I – colonised litter. Wood? (Fotos: A Purser)
7.7 MOCNESS
R Escribano, D Toledo, I Fernandez
The MOCNESS (Multiple Opening-Closing Net and Environmental Sensing System) is a zooplankton net designed to obtain stratified samples at deep waters (Fig. 7.7.1). The MOCNESS-10 is designed with an opening frame of 10m2 hosting six 333µm mesh-size nets of 25m length. It is also equipped with Seabird sensors for temperature, salinity, dissolved oxygen and fluorescence.
Figure 7.7.1 MOCNESS net being deployed via the A-frame (Foto: F. Wenzhöfer)
MOCNESS works on real time by means of the conductive cable and a deck unit. Upon deployment the net can be monitored at real-time for net depth, vertical and horizontal speed, angle, water volume being filtered and all environmental parameters. Nets can be closed and opened at desirable depths. The equipment is operated by trawling at about 2 knots to a maximum depth of 6500m.