www.biogeosciences.net/13/2453/2016/
doi:10.5194/bg-13-2453-2016
© Author(s) 2016. CC Attribution 3.0 License.
Changes in optical characteristics of surface microlayers hint to photochemically and microbially mediated DOM turnover
in the upwelling region off the coast of Peru
Luisa Galgani1,2and Anja Engel1
1GEOMAR – Helmholtz Centre for Ocean Research Kiel, Düsternbrooker Weg 20, 24105 Kiel, Germany
2Alfred-Wegener-Institute – Helmholtz Centre for Polar and Marine Research, Am Handelshafen 12, 27570 Bremerhaven, Germany
Correspondence to: Anja Engel (aengel@geomar.de)
Received: 16 November 2015 – Published in Biogeosciences Discuss.: 7 December 2015 Revised: 15 April 2016 – Accepted: 19 April 2016 – Published: 27 April 2016
Abstract. The coastal upwelling system off the coast of Peru is characterized by high biological activity and a pronounced subsurface oxygen minimum zone, as well as associated emissions of atmospheric trace gases such as N2O, CH4and CO2. From 3 to 23 December 2012, R/V Meteor (M91) cruise took place in the Peruvian upwelling system between 4.59 and 15.4◦S, and 82.0 to 77.5◦W. During M91 we inves- tigated the composition of the sea-surface microlayer (SML), the oceanic uppermost boundary directly subject to high so- lar radiation, often enriched in specific organic compounds of biological origin like chromophoric dissolved organic matter (CDOM) and marine gels. In the SML, the continuous pho- tochemical and microbial recycling of organic matter may strongly influence gas exchange between marine systems and the atmosphere. We analyzed SML and underlying water (ULW) samples at 38 stations focusing on CDOM spectral characteristics as indicator of photochemical and microbial alteration processes. CDOM composition was characterized by spectral slope (S) values and excitation–emission matrix fluorescence (EEMs), which allow us to track changes in molecular weight (MW) of DOM, and to determine poten- tial DOM sources and sinks. Spectral slopeSvaried between 0.012 to 0.043 nm−1and was quite similar between SML and ULW, with no significant differences between the two com- partments. Higher S values were observed in the ULW of the southern stations below 15◦S. By EEMs, we identified five fluorescent components (F1–5) of the CDOM pool, of which two had excitation/emission characteristics of amino- acid-like fluorophores (F1, F4) and were highly enriched in
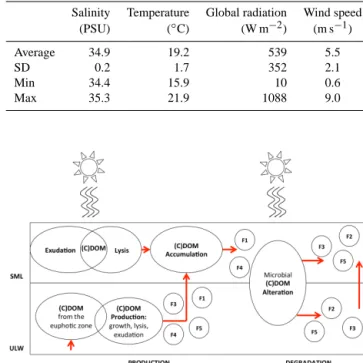
the SML, with a median ratio SML : ULW of 1.5 for both flu- orophores. In the study region, values for CDOM absorption ranged from 0.07 to 1.47 m−1. CDOM was generally highly concentrated in the SML, with a median enrichment with re- spect to the ULW of 1.2. CDOM composition and changes in spectral slope properties suggested a local microbial re- lease of DOM directly in the SML as a response to light ex- posure in this extreme environment. In a conceptual model of the sources and modifications of optically active DOM in the SML and underlying seawater (ULW), we describe pro- cesses we think may take place (Fig. 1); the production of CDOM of higher MW by microbial release through growth, exudation and lysis in the euphotic zone, includes the identi- fied fluorophores (F1, F2, F3, F4, F5). Specific amino-acid- like fluorophores (F1, F4) accumulate in the SML with re- spect to the ULW, as photochemistry may enhance micro- bial CDOM release by (a) photoprotection mechanisms and (b) cell-lysis processes. Microbial and photochemical degra- dation are potential sinks of the amino-acid-like fluorophores (F1, F4), and potential sources of reworked and more refrac- tory humic-like components (F2, F3, F5). In the highly pro- ductive upwelling region along the Peruvian coast, the inter- play of microbial and photochemical processes controls the enrichment of amino-acid-like CDOM in the SML. We dis- cuss potential implications for air–sea gas exchange in this area.
1 Introduction
The Peruvian eastern boundary upwelling system (EBUS), extending along the coast off Peru between 4◦ and about 40◦south, is among the most productive marine ecosystems worldwide (Capone and Hutchins, 2013; Chavez and Mes- sié, 2009; Rosenberg et al., 1983) and it is characterized by high biological activity, involving high export rates of or- ganic carbon both vertically and laterally (Arístegui et al., 2004; Muller-Karger et al., 2005). The high productivity is sustained by winds year-round that promote the upwelling of nutrient-rich deep waters into the euphotic zone, thus fa- voring phytoplankton photosynthesis and organic matter pro- duction (Chavez and Messié, 2009). High rates of organic matter production are counterbalanced by heterotrophic res- piration, which provides sinks for the oxygen produced by autotrophs and leads to subsurface oxygen minimum zones (OMZs) (Lachkar and Gruber, 2011). OMZs are expanding worldwide due to reduced solubility at increasing tempera- tures, as well as a consequence of reduced oceanic ventilation and enhanced stratification (Keeling et al., 2010; Stramma et al., 2008). OMZs become increasingly important as key marine regions for the emission of climate-relevant gases like carbon dioxide (CO2), methane (CH4), nitrous oxide (N2O) and hydrogen sulfide (H2S) (Paulmier et al., 2008, 2011). N2O is a strong greenhouse gas and ozone-reactive:
30 % of its atmospheric concentration has an oceanic source (Solomon et al., 2007), of which, up to 75 % is supported by OMZs (Bange et al., 2001). Therefore, OMZs are key environments to assess the oceanic contribution to the con- centration of atmospheric gases. Defining the processes that regulate gas fluxes across the water–air interface is a central objective to better understand the reciprocal relationship be- tween changes in our climate and marine environments.
The uppermost oceanic layer in contact with the atmo- sphere is the sea-surface microlayer (SML), which medi- ates major climate-relevant processes including air–sea gas exchange and sea-spray aerosol emission (Liss and Duce, 2005). This interface between a liquid (hydrosphere) and a gas phase (atmosphere) accumulates organic matter of bi- ological origin, creating a sort of “skin” of surface-active compounds able to dampen capillary waves and “capping the flux” of gases across the water–air interface (GESAMP, 1995). Natural organic compounds in the SML include a vast array of photosynthesis products including carbohydrates, amino acids and lipids, as well as other carbon-rich com- pounds like dissolved organic matter (DOM) and marine gels (e.g., Cunliffe et al., 2013). The DOM pool represents a con- tinuum of molecular weights and biological lability ranging from refractory to labile DOM that is either utilized rapidly by microorganisms (Benner, 2002; Carlson, 2002) or photo- chemically degraded (Kieber, 2000). These compounds, pro- duced in the oceanic photic zone and brought to the SML through rising bubbles (Hardy, 1982), contribute to the en- richment of a natural surface biofilm and favor specific SML
heterotrophic communities that are very active in recycling this organic material (Hardy, 1982; Cunliffe et al., 2011).
While bulk dissolved organic carbon is not generally en- riched in the SML, specific DOM fractions are present occa- sionally at much higher concentrations than in the underlying water (Cunliffe et al., 2013). These enriched pools of organic matter include marine gel particles (Wurl and Holmes, 2008), chromophoric dissolved organic matter (CDOM) (Zhang and Yang, 2013; Tilstone et al., 2010) and phenolic material (Carlson, 1982; Carlson and Mayer, 1980).
CDOM is the principal light-absorbing constituent of DOM, strongly absorbing UV (100–400 nm) and visible ra- diation (400–700 nm), and it can comprise 20–70 % of the DOM in oceanic waters (Coble, 2007). CDOM plays a major role in the attenuation of UV wavelengths and can reduce the availability of underwater photosynthetically active radiation for primary production (Bracchini et al., 2011). Photolysis of CDOM promotes the formation of low molecular weight (LMW) compounds from the breakdown of high molecular weight DOM (HMW-DOM), facilitating the bioavailability of carbon uptake for microbial growth from biologically re- fractory material, and representing an important loss path- way for CDOM in the oceans (Kieber et al., 1989). Other major byproducts of CDOM photolysis are carbon monox- ide (CO), which often exists at supersaturated concentrations in the oceans’ surface (Blough, 2005, and references therein), CO2(Miller and Zepp, 1995) and reactive chemical species (Loiselle et al., 2012). To initiate a photochemical reaction, light must first be absorbed and in this respect the SML is very well exposed to elevated solar radiation (Liss and Duce, 2005). CDOM photolysis may affect biological processes within the SML as well as the structure of accumulated or- ganic matter. Optical properties and photochemical cycling of DOM have been widely investigated in the ocean: CDOM alters light spectra in the surface ocean and its spatial and temporal distribution have been used in characterizing wa- ter masses exchange (Nelson and Siegel, 2013). However, processes within the SML remain poorly understood. Pos- sible effects of photochemistry on SML chemical composi- tion have been discussed in the past (Blough, 2005), but still little is known on CDOM fluorophores, sources and sinks (Tilstone et al., 2010; Zhang and Yang, 2013). To discern sources, sinks and modification of DOM in surface waters, whether microbially or photochemically induced, we inves- tigated optical properties of organic sea-surface microlayers and underlying water samples in the highly productive EBUS off the coast of Peru. We applied optical spectroscopy mea- surements combined with chemical and biological analysis to identify different compounds within the CDOM pool and their partitioning between the SML and the underlying wa- ter. The use of excitation–emission matrix fluorescence spec- troscopy (EEMs) allowed us to discriminate different com- pound classes in the SML and underlying water based on their excitation and emission maxima (Coble, 1996).
At present, the oceans are subject to many changes in physical and chemical properties like pH, temperature, and dissolved oxygen concentration, which potentially will affect the biological cycling of carbon (Riebesell et al., 2009; Keel- ing et al., 2010; Bopp et al., 2002). Whether the oceans are sources or sinks of carbon depends on the production rate of organic matter with respect to its biological degradation (Del Giorgio and Duarte, 2002), and high DOM degradation in the SML might represent a net source of CO2to the atmo- sphere (Garabétian, 1990). It is well known that the composi- tion of the SML reflects biological processes of the euphotic zone (Galgani et al., 2014; Gao et al., 2012; Matrai et al., 2008; Bigg et al., 2004), and that elevated concentrations of organic matter may accumulate in the SML in highly pro- ductive regions like the Peruvian EBUS (Engel and Galgani, 2016). The enrichment of light-absorbing DOM in the SML may increase the photochemical formation and fluxes of re- active chemical species at the surface, with potentially im- portant consequences for the composition of the SML itself and for the fate of compounds passing through this interface (Blough, 2005). Last but not least, the photochemical DOM breakdown may increase the biological availability of car- bon, thus increasing heterotrophic respiration and CO2 flux to the atmosphere.
CDOM contributes to the dissolved organic carbon (DOC) pool, but while DOC is a bulk measure, CDOM is a charac- teristic of DOM rather than a discrete class of compounds (Nelson and Siegel, 2013). Positive correlations have been observed between CDOM and DOC in coastal systems and plankton enclosures (Loginova et al., 2015), but the strength of these correlations varies much across regional and sea- sonal differences (Blough and Del Vecchio, 2002). CDOM is a precursor for photochemical reactions that may drive the emission of trace gases from photochemically altered DOM (e.g., Ciuraru et al., 2015). Therefore, in upwelling areas as- sociated with OMZs, CDOM characteristics in the SML are worth being investigated as they may impact the exchange of gases between the ocean and the atmosphere.
2 Material and methods 2.1 Study area
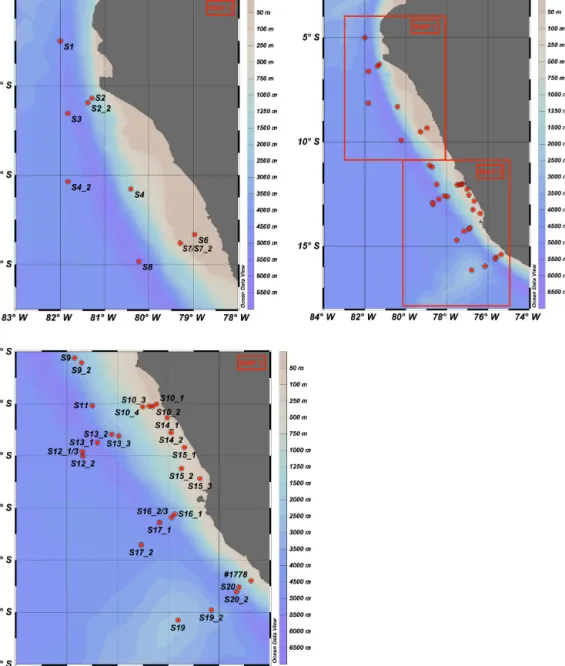
The R/V Meteor cruise M91 was an integrated biogeochem- ical study in the upwelling region off the coast of Peru, with the aim to assess the importance of oxygen minimum zones (OMZs) for the air–sea exchange of gases relevant for cli- mate and tropospheric chemistry (Bange, 2013). A total of 39 samples for SML and underlying water were collected in December 2012 between 5 and 16◦S off the Peruvian coast.
Data that we report here additionally from what previously described by Engel and Galgani (2016) refer to 38 stations.
For easiness of comparison, Table 1 recalls salinity, water
Table 1. Data on average, maximum and minimum salinity, wa- ter temperature, global radiation and wind speed during M91. Data were retrieved from Dship data server of R/V Meteor.
Salinity Temperature Global radiation Wind speed (PSU) (◦C) (W m−2) (m s−1)
Average 34.9 19.2 539 5.5
SD 0.2 1.7 352 2.1
Min 34.4 15.9 10 0.6
Max 35.3 21.9 1088 9.0
Figure 1. Conceptual model of the sources and modifications of optically active DOM in the SML and underlying seawater in the upwelling region off the coast of Peru during the SOPRAN M91 cruise.
temperature, radiation and wind speed, as already described in the companion manuscript (Engel and Galgani, 2016).
Some stations were revisited for multiple sampling (Ta- ble 2): S7 and S7_2; S12_1, S12_2, and S12_3; S16_1, S16_2, S16_3; S20 and S20_2. These stations were sampled within a time frame of 24 h for SML and ULW (underlying water), as we were interested in monitoring the evolution of CDOM optical properties in the SML and ULW at different times of the day depending on the solar irradiation. When- ever possible, we sampled at sunrise, midday and sunset. For security reasons, it was not possible to sample later than sun- set, as the zodiac operations were not allowed out at dark.
Exact latitude and longitude measurements were not always possible to retrieve after a certain time, but were similar for the stations sampled in a few hours time lag.
The sampling approach for the SML was chosen as a silicate glass plate of 500 mm (length)×250 mm (width)×5 mm (thickness) with an effective sampling area of 2000 cm2 as indicated in Engel and Galgani (2016).
Briefly, the glass plate was inserted into the water perpen- dicular to the surface and withdrawn at a controlled rate of
∼20 cm s−1as first suggested by Harvey and Burzell (1972).
Different devices can be applied to sample the SML. The glass plate approach we choose collects a thinner SML (∼60–150 µm) when compared to, e.g., the Garrett screen
Figure 2. Maps showing all sampled stations. Stations with multiple measurements are: (1) S7/7_2, (2) S12_1/3 and S12_2, (3) S16_1, S16_2/3, (4) S20 and S20_2. The locations of S7 and S7_2; S12_1 and S12_3; S16_2 and S16_3 coincide, as sampling was performed at different times.
(150–300 µm), one of the mainly recognized practices in- troduced by Garrett in 1965 (Cunliffe et al., 2011; Gar- rett, 1965). The glass plate was chosen because it allows the sampling of enough volume required for analysis while keeping a minimal dilution with underlying water. Sampling was performed on a rubber boat; in order to obtain a well- standardized procedure and to minimize biases by sampling, the same person always took the samples with a repeatable withdrawal speed of the SML. The rubber boat was posi- tioned as far upwind of the ship as possible and away from the path taken by the ship in order to avoid any potential sur-
face contamination. The outboard motor of the rubber boat was switched off and samples were collected in upwind clean waters.
Before collecting the sample into the bottle, we let the plate drain for 20 s approximately. Then, the sample retained on both sides of the plate was removed with a Teflon wiper, and the procedure repeated about 20 times to obtain the nec- essary volume for analysis. The exact amount of dips per sample has been tracked. The first sample was discarded and used to rinse the collecting bottle (HCl 10 % cleaned and Milli-Q rinsed). Glass plate and wiper were acid cleaned
Table 2. Stations with multiple measurements. Metadata with date, local and UTC time of sampling, coordinates, and average global radiation retrieved from Dship data server of R/V Meteor.
Station Ship Nr. Station nr. Samples Date Time Time Lat, S Long, W Average Global
ID (UTC) (Local) (◦) (◦) Radiation
[W m−2] 1733-5 1 S7 SML/ULW 08-12-12 11:30 6:30 9◦31015.5200 79◦17053.1600 10 1733-9 S7_2 SML/ULW 08-12-12 19:45 14:45 9◦31015.5200 79◦17053.1600 837 1752-2 2 S12_1 SML/ULW 13-12-12 12:00 7:00 12◦55012.1700 78◦4200.0700 380.5 1752-7 S12_2 SML/ULW 13-12-12 20:30 15:30 13◦001900 78◦40059.9900 704.5 1752-9 S12_3 SML/ULW 13-12-12 23:10 18:10 12◦55019.9900 78◦4202.9900 47 3 S16_1 SML/ULW 17-12-12 12:40 7:40 14◦7014.0800 76◦52013.0800 381 1764-6 S16_2 SML/ULW 17-12-12 17:40 12:40 14◦1105.9200 76◦55059.4400 1043 1764-9 S16_3 SML/ULW 17-12-12 22:00 17:00 14◦1105.9200 76◦55059.4400 161.5 1777-2 4 S20 SML/ULW 22-12-12 18:00 13:00 15◦31010.4100 75◦3600.9300 1088 1777-10 S20_2 SML/ULW 23-12-12 15:00 10:00 15◦3604200 75◦390000 1046
(HCl 10 %) and Milli-Q rinsed prior use, and at sampling site they were copiously rinsed with in situ seawater to minimize any contamination with alien material during transport and handling. Underlying seawater (ULW) was collected right af- ter SML at about∼20 cm depth by opening an acid cleaned (HCl 10 %) and Milli-Q rinsed glass bottle and closing it un- derwater. The thickness (d,µm)of our reference SML that we were able to collect was estimated as follows:
d=V /(A×n), (1)
whereV is the SML volume collected; i.e., 60–140 mL,A is the sampling area of the glass plate (A=2000 cm2) andn is the number of dips. During this cruise, the apparent sam- pling thickness of the SML ranged between 45 and 60 µm, with an overall mean of 49±8.9 µm (Engel and Galgani, 2016). Many factors may influence the thickness of the SML such as withdrawal rate, dipping time, and plate dimensions.
With a withdrawal speed of∼20 cm s−1, the apparent SML thickness was in accordance with previous findings at similar withdrawal rate reporting 60–100 µm (Harvey and Burzell, 1972) and 50–60 µm (Zhang et al., 1998). The sampling thickness was very well comparable among all stations, in- dicating that no major biases due to sampling procedure may have occurred.
After sampling, bottles were stored in the dark and the samples immediately processes in the laboratory onboard, within maximum 30 min from sampling.
2.2 Chemical and biological analyses 2.2.1 Dissolved organic matter (DOM)
Sampling, calibration and analysis procedure for dissolved organic carbon (DOC) and for dissolved hydrolyzable amino acids (DHAA), have been described in details in Engel and Galgani (2016). Additionally, to track DOM diagenetic state and bioavailability, we used the carbon-normalized yields of dissolved amino acids to DOC, expressed as DHAA%- DOC (Amon and Fitznar, 2001; Benner, 2002; Kaiser and
Benner, 2009; Davis and Benner, 2007). Amino acids gener- ally comprise a large fraction of bioavailable organic matter and are preferentially consumed by microbial activity quite rapidly. In surface waters they may be easily photodegraded too. Therefore, the amount of carbon included in amino acids is considered as a good indicator of DOM diagenesis and a value of∼2 % of DHAA%-DOC may indicate the threshold between labile and semi-labile and refractory DOM (Davis and Benner, 2007).
Samples for chromophoric and fluorescent DOM (CDOM and FDOM) were filtered through 0.45 µm PES syringe fil- ters and collected into 40 mL pre-combusted (8 h, 500◦C) amber glass vials. Samples were stored in the dark at 4◦C with no other treatment than pre-filtering. Since storage pro- cedures may affect the absorbance and fluorescence prop- erties of DOM, absorbance and fluorescence readings were performed directly on-board within a few hours from sam- pling or the next day according to Schneider-Zapp and colleagues (2013). Prior to measurements, samples were stored in the dark and acclimatized at room temperature. For CDOM, triplicate absorbance measurements were made on a Shimadzu 1800 UV-visible spectrophotometer in the range 220 to 700 nm with 0.5 nm increments, in a 10 cm path- length quartz cuvette against Milli-Q water as a reference.
For FDOM, 3-D fluorescence spectroscopy was performed with a Varian Cary Eclipse Fluorescence Spectrophotome- ter equipped with a xenon flash lamp and data assembled into excitation–emission matrices (EEMs) which enable to individuate single DOM fluorophores (Coble, 1996) and to perform parallel factor analysis PARAFAC (Stedmon and Bro, 2008). Samples have been acclimatized and scanned at a fixed 20◦C temperature (Cary Single Cell Peltier Acces- sory, Varian) in 1 cm path length quartz cuvette. Scans were performed at 600 nm min−1 using an excitation range (Ex) of 240–450 nm with 5 nm increments and recorded emission (Em) in the range 242–600 nm with 2 nm increments. Sam- ples were run in a mode of 5 nm slit for both excitation and emission and 0.1 s integration time.
2.2.2 Particulate organic carbon (POC) and gel particles
Total numbers of gel particles were determined by mi- croscopy after Engel (2009). A detailed description of the method used during M91 cruise can be found in Engel and Galgani (2016). POC data were retrieved after Engel and Galgani (2016). We refer to this companion publication for further analytical details.
2.2.3 Phytoplankton and heterotrophic bacteria Samples, calibration and analysis for phytoplankton and het- erotrophic bacteria counts for M91 are described in details in Engel and Galgani (2016).
2.3 Data analysis 2.3.1 CDOM
The measured absorbance at every wavelength λ was con- verted to absorption coefficienta(λ), (m−1), according to the following equation (Bricaud et al., 1981):
a(λ)=2.303Aλ/L (2)
whereAλis the absorbance and Lis the path-length of the cuvette (here 0.10 m). Absorbance is an optical characteristic of CDOM, which allows quantifying the amount of CDOM in the samples. Therefore, the absorption coefficienta(λ) is considered as a proxy for CDOM concentration. To estimate CDOM concentration, we calculated the absorption coeffi- cient at 325 nm as often used for the open ocean (Swan et al., 2009; Nelson and Siegel, 2013). The dependence of a on the wavelength was determined by analyzing the spectral slope parameterS(nm−1)in the discrete wavelength ranges of 275–295 and 350–400 nm, determined by linear regression of log-transformed absorption spectra against the wavelength (Bricaud et al., 1981; Helms et al., 2008):
a(λ)=a(λ0)e−S(λ−λ0) (3) wherea(λ0)is the absorption coefficient at a reference wave- lengthλ0.Smeasured in the wavelength range 275–295 nm (S(275–295), nm−1)and 350–400 nm (S(350–400), nm−1) as well as slope ratio (SR) defined as S(275–295) :S(350–
400) are good indicators to characterize CDOM (Helms et al., 2008). SR is characterized by lower values for terrestrial CDOM compared to CDOM produced by autochthonous ma- rine sources and instead ofSalone, could be a more sensitive indicator of photochemically induced changes in the molec- ular weight of the CDOM pool as an increase in SR sug- gests photodegradation processes, while a decrease is often related to microbially altered CDOM (Helms et al., 2008).
BothS(275–295) and SR increase with (a) irradiation (photo- bleaching), (b) with decreasing DOM molecular weight, and (c) at higher salinity reflecting mixing of water masses along
a salinity gradient. As such they are useful as tracers to de- termine mixing and coastal inputs. We also determined the SUVA254 index, that is, the specific ultraviolet absorbance (A) at 254 nm normalized to DOC concentration. This in- dex was shown to correlate significantly with increasing aro- maticity of DOM (Weishaar et al., 2003):
SUVA254(mg C L−1m−1)=A(254)(m−1)/DOC(mg L−1) (4) 2.3.2 FDOM
The 3-D recorded spectra were corrected for the instrumen- tal biases both for excitation and emission using correc- tion curves provided by the manufacturer (Stedmon and Bro, 2008). Additionally, spectra were corrected against a Milli- Q water blank run every day before the samples to remove water Raman peaks. No correction for inner filter effects was applied to our data as for each sample the relativea(λ) value was below 10 m−1(Lawaetz and Stedmon, 2009; Sted- mon and Bro, 2008). As an example,a(254) was on average 2±2 m−1 for SML and 1.6±1.3 m−1 for underlying wa- ter (ULW) samples. Fluorescence spectra were normalized to Raman units (R.U.) by integrating the Raman peak of 350 nm Ex and 382 to 407 nm Ex extracted by the daily Milli-Q wa- ter blank. Calibration to R.U. was done with the FDOMcor- rect toolbox for Matlab (The MathWorks Inc.) incorporated in DrEEM toolbox (Murphy et al., 2013). We choose to nor- malize to R.U. as these units are widely used in open ocean measurements and we could compare our results.
PARAFAC analysis was applied to EEMs in order to iden- tify and quantify independent underlying components of the CDOM pool, and was performed by the N-way toolbox for Matlab in DrEEM (Murphy et al., 2013). After normaliza- tion to Raman units, data were smoothed to remove remain- ing scatter peaks, Raman and Rayleigh signals by creating a sub-data set. We then performed a preliminary outlier analy- sis generating models with 3 to 7 factors with non-negativity constraints, comparing the spectra to unconstrained mod- els. When dilution dominates the data set, components are strongly correlated. To investigate biases due to dilution, we performed a test for correlations between the components, as suggested by the DrEEM tutorial by Murphy et al. (2013).
We then normalized the data set by the DrEEm function normeem to reduce the co-linearity related to the concen- tration, thus giving low-concentrated samples a possibility to enter the model, followed by the outlier test again on the normalized data. After visually comparing the spectra and looking at the error residuals for models with 4 to 7 compo- nents, we then compared the models by the sum of squared errors (SSE) expressed as a function of wavelength, choosing the models with lower SSE. At this stage, we choose models with 5, 6 and 7 components and reversed the normalization to obtain the unscaled scores before validation. Models with 5, 6 and 7 components were validated by split half analy- sis “S4C6T3” (see Murphy et al., 2013), where it was en- sured that in each test the data set halves being compared
had no samples in common. The validation was successful for 5-components model, for all comparison. The maximum fluorescence intensities of the five fluorophores at specific Ex–Em wavelengths ranges are described in Table 3. Figures with the model comparison for both excitation and emission for the 5-components model are included in the Supplement (Figs. S1 and S2 in the Supplement).
In fluorescence spectroscopy, the humification index (HIX), first introduced by Zsolnay et al. (1999), is a pow- erful tool to study CDOM dynamics in soils, as humifica- tion is associated with a shift to longer emission wavelengths (Senesi, 1990). It has been first applied to aquatic CDOM in estuarine waters by Huguet et al. (2009), and is calculated as the ratio H/L of two spectral region areas of the emission spectrum scanned at 254 nm excitation. Area L is calculated between the emission wavelengths 300 and 345 nm, and area H between 435 and 480 nm. When the degree of aromatic- ity of CDOM increases, the emission spectrum at excitation 254 nm is shifted towards the red (longer wavelengths), im- plying an increase in H/L ratio and in HIX. High HIX im- plies maximum fluorescence intensity at long wavelengths and therefore the presence of complex molecules like HMW aromatic CDOM (Senesi et al., 1991). We applied a slight modification to the HIX index for our samples, introducing the “SMHIX” index, where SM stands for surface micro- layer. As we did neither have the scanned excitation wave- length of 254 nm, nor the scanned spectrum at excitation 345 and 435 nm, we calculated SMHIX index as follows:
SMHIX=X
I434→480
XI300→346
, (5)
whereP
I434→480is the sum of all fluorescence intensities at every emission wavelength between 434 and 480 nm, and PI300→346is the sum of all fluorescence intensities at every emission wavelength between 300 and 346 nm, both scanned with excitation=255 nm.
2.3.3 Enrichment factors
Enrichment factors (EFs), allow tracking of accumulation patterns of any compound in the SML with respect to the un- derlying water (ULW) and comparison among different com- pounds. EFs are calculated according to the following:
EF= [X]SML/[X]ULW, (6)
where [X] is the concentration of a given parameter in the SML or ULW, respectively (GESAMP, 1995). EF > 1 indi- cates an enrichment, EF < 1 indicates a depletion in the SML.
EFs are normally used for quantitative parameters, i.e., mea- sured in abundance and concentration such as DOC, DHAA, CDOM, marine gels and cell abundances. Here, we applied the EF calculation for qualitative ratios and indexes too, like S(275–295), SR, SMHIX, SUVA254, DHAA%-DOC.
We kept the same wording, which is useful to describe dif-
ferences between SML and ULW for both quantitative and qualitative parameters.
Statistical tests in data analysis have been accepted as sig- nificant forp< 0.05. Calculations, statistical tests and illus- tration were performed with Microsoft Office Excel 2010, Sigma Plot 12.0 (Systat), Prism (GraphPad), Ocean Data View and Matlab R2009b (The MathWorks Inc.).
3 Results
Results on dissolved organic carbon and amino acids, gel particles (TEP and CSP), phytoplankton and bacterial abun- dance and the relative enrichment of these components in the SML of our sampling sites have been described elsewhere (Engel and Galgani, 2016). Here, we focus on the optical properties of DOM to identify possible sources, sinks and dynamics in the SML and underlying water of the Peruvian upwelling region.
3.1 CDOM optical absorption properties
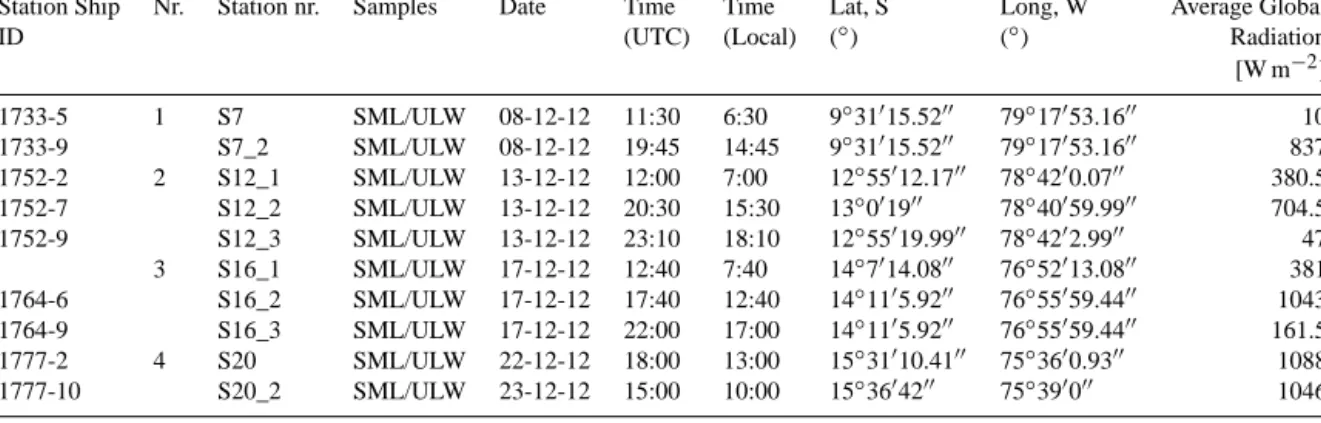
In the upwelling region off the coast of Peru, values for CDOM absorption coefficient a(325) ranged from 0.09 to 1.47 m−1 in the SML and from 0.07 to 1.47 m−1 in ULW.
Highest values were observed at stations S10_ 1 to S10_4 along the coast for both SML and ULW (Fig. 3). CDOM was enriched in the SML at most stations (Figs. 4 and 5), with median EF fora(325)=1.2 in a range varying between 0.4 and 2.8. A median EF=1.2 means that at least 50 % of our observations accounted for a CDOM-enriched SML. Besides the southern transect, higher EF values were observed at the northern stations S2 and S2_2, and in the southern coastal upwelling stations S15_1 to S15_3. Lower EFs and EFs < 1, indicating a depletion of CDOM in the SML, were observed at higher distance from the coast (Fig. 5).
The spectral slope parameter between 275 and 295 nm (S(275–295), nm−1)is a good indicator for CDOM molec- ular weight as an increase of this parameter indicates de- creasing molecular weight, thus revealing accumulation or degradation processes of bioavailable CDOM (Helms et al., 2008). In our samples, S(275–295) ranged from 0.012 to 0.038 nm−1 in the SML and from 0.017 to 0.043 nm−1 in ULW. In general, S(275–295) was quite similar between SML and ULW, and no statistically significant differences were found between SML and ULW forS(275–295). Higher spectral slopes were observed in the ULW of the southern stations below 15◦S (S19, S19_2, S20, S20_2, S1778). In the coastal stations S10_1 to S10_4 and S14_ 1 to S15_3 lowerS(275–295) values were determined for both SML and ULW (Fig. 3). Median enrichment factor (EF) forS(275–
295) was 1 (Fig. 4), thus indicating similar molecular weight of CDOM compounds in the SML and ULW. Lower EFs were observed in the northernmost and southernmost stations and along the coast (Fig. 5).
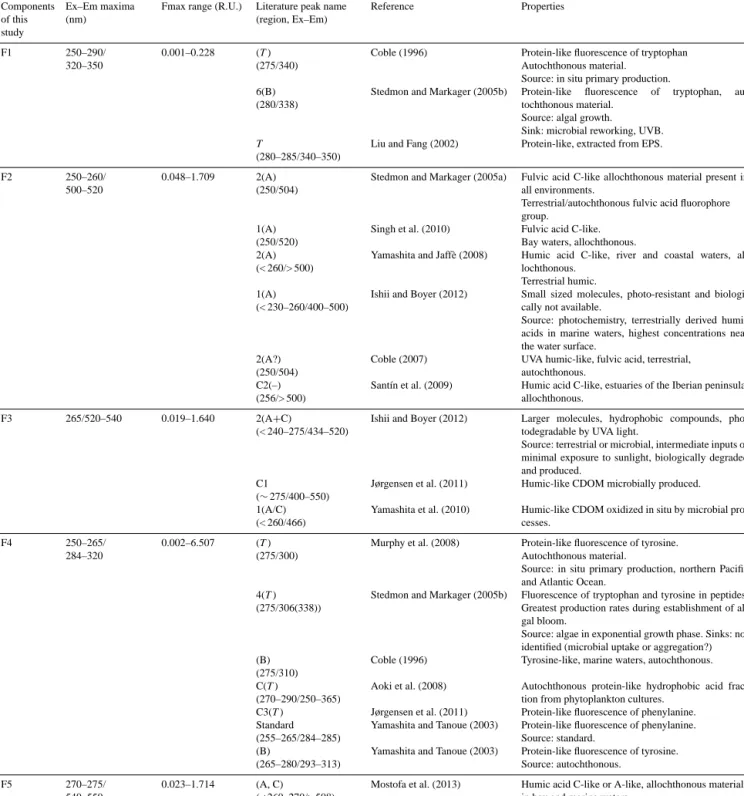
Table 3. Fluorescent components identified in this study in both SML and ULW samples, according to their Ex–Em maxima ranges (nm), maximum fluorescence intensity range Fmax (R.U.), corresponding peaks individuated in previous studies (peak name, region, Ex–Em ranges) and properties. EPS is defined as extracellular polymeric substances.
Components of this study
Ex–Em maxima (nm)
Fmax range (R.U.) Literature peak name (region, Ex–Em)
Reference Properties
F1 250–290/
320–350
0.001–0.228 (T)
(275/340)
Coble (1996) Protein-like fluorescence of tryptophan Autochthonous material.
Source: in situ primary production.
6(B) (280/338)
Stedmon and Markager (2005b) Protein-like fluorescence of tryptophan, au- tochthonous material.
Source: algal growth.
Sink: microbial reworking, UVB.
T
(280–285/340–350)
Liu and Fang (2002) Protein-like, extracted from EPS.
F2 250–260/
500–520
0.048–1.709 2(A)
(250/504)
Stedmon and Markager (2005a) Fulvic acid C-like allochthonous material present in all environments.
Terrestrial/autochthonous fulvic acid fluorophore group.
1(A) (250/520)
Singh et al. (2010) Fulvic acid C-like.
Bay waters, allochthonous.
2(A) (< 260/> 500)
Yamashita and Jaffè (2008) Humic acid C-like, river and coastal waters, al- lochthonous.
Terrestrial humic.
1(A)
(< 230–260/400–500)
Ishii and Boyer (2012) Small sized molecules, photo-resistant and biologi- cally not available.
Source: photochemistry, terrestrially derived humic acids in marine waters, highest concentrations near the water surface.
2(A?) (250/504)
Coble (2007) UVA humic-like, fulvic acid, terrestrial, autochthonous.
C2(–) (256/> 500)
Santín et al. (2009) Humic acid C-like, estuaries of the Iberian peninsula, allochthonous.
F3 265/520–540 0.019–1.640 2(A+C)
(< 240–275/434–520)
Ishii and Boyer (2012) Larger molecules, hydrophobic compounds, pho- todegradable by UVA light.
Source: terrestrial or microbial, intermediate inputs of minimal exposure to sunlight, biologically degraded and produced.
C1
(∼275/400–550)
Jørgensen et al. (2011) Humic-like CDOM microbially produced.
1(A/C) (< 260/466)
Yamashita et al. (2010) Humic-like CDOM oxidized in situ by microbial pro- cesses.
F4 250–265/
284–320
0.002–6.507 (T)
(275/300)
Murphy et al. (2008) Protein-like fluorescence of tyrosine.
Autochthonous material.
Source: in situ primary production, northern Pacific and Atlantic Ocean.
4(T) (275/306(338))
Stedmon and Markager (2005b) Fluorescence of tryptophan and tyrosine in peptides.
Greatest production rates during establishment of al- gal bloom.
Source: algae in exponential growth phase. Sinks: not identified (microbial uptake or aggregation?) (B)
(275/310)
Coble (1996) Tyrosine-like, marine waters, autochthonous.
C(T)
(270–290/250–365)
Aoki et al. (2008) Autochthonous protein-like hydrophobic acid frac- tion from phytoplankton cultures.
C3(T) Jørgensen et al. (2011) Protein-like fluorescence of phenylanine.
Standard (255–265/284–285)
Yamashita and Tanoue (2003) Protein-like fluorescence of phenylanine.
Source: standard.
(B)
(265–280/293–313)
Yamashita and Tanoue (2003) Protein-like fluorescence of tyrosine.
Source: autochthonous.
F5 270–275/
540–550
0.023–1.714 (A, C)
(< 260–270/> 508)
Mostofa et al. (2013) Humic acid C-like or A-like, allochthonous material in bay and marine waters.
The SUVA254 and SMHIX indexes are related to the de- gree of CDOM aromaticity and to its humic content, re- spectively. In our study, SUVA254 ranged from 0.49 to 1.74 mg C L−1m−1 in the SML, with highest values at coastal southern stations S10_1 to S10_4 and S14_1 to
S17_2. Similar values were recorded for ULW, ranging from 0.49 to 1.21 mg C L−1m−1. Generally, SUVA254 values in our samples were comparable to the Pacific Ocean with a typical SUVA254 of 0.6 mg C L−1m−1 (Helms et al., 2008;
Weishaar et al., 2003). Median EF for SUVA254 was 1.1,
Figure 3. CDOM absorption coefficienta(325), [m−1], in SML and underlying water (ULW) and spectral slope parameter between 275 and 295 nm,S(275–295), [nm−1].
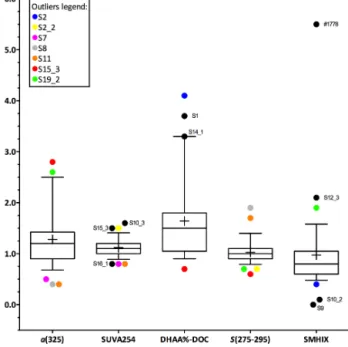
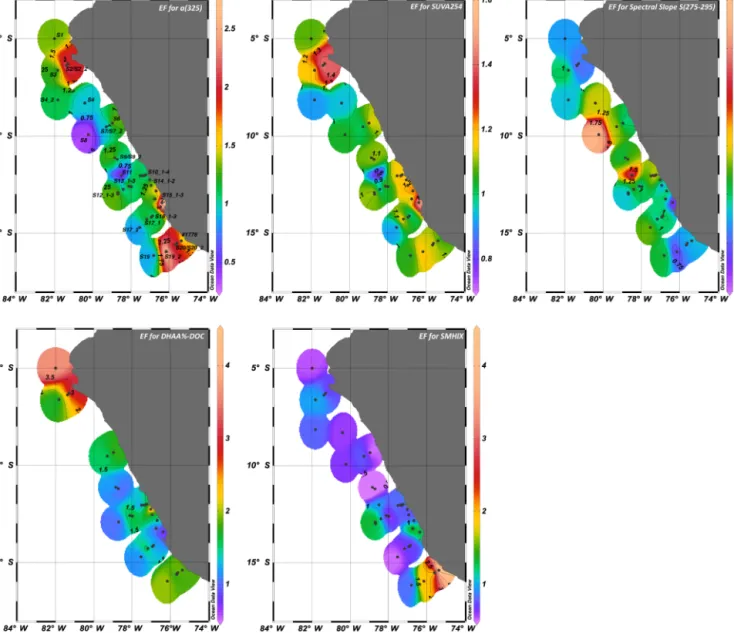
with higher values in correspondence of northern stations and coastal southern stations (S2, S2_2, S15_1 to S15_3 and S19 to S1778), where the higher EFs for a(325) were also ob- served (Figs. 4 and 5). SMHIX ranged from−1.33 to 2.05 for SML and from−0.1 to 3.03 for ULW, with highest values in ULW. Enrichment factors showed an overall depletion of high-humic acid containing CDOM in the SML (Fig. 4), with median EF=0.8. Higher humic acid enrichment in the SML was observed on the southern transect S19 to S1778 (Fig. 5),
where we recorded the highest enrichment of CDOM (as a(325)) as well.
The carbon-normalized yields of dissolved amino acids (DHAA%-DOC) as indicator of DOM diagenetic state, ranged from 1.4 to 8.1 % in SML samples and from 0.9 to 3.6 % in ULW samples, indicating relatively more labile DOM in the SML. This observation was supported by the en- richment factors (EFs), which showed a general enrichment of more labile DOM in the SML (Fig. 4), with median EF
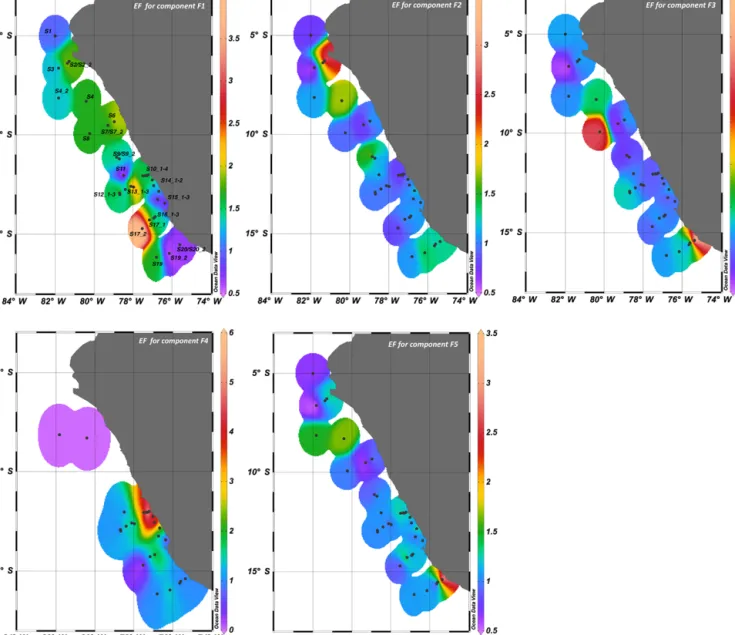
Enrichment factors
Figure 4. Box and Whiskers plot of enrichment factors for CDOM absorption coefficienta(325), aromaticity (SUVA254), DOM diage- netic state (DHAA%-DOC), spectral slopeS(275–295), and modi- fied surface microlayer humification index (SMHIX). The horizon- tal lines of the boxes represent 25 %, 50 % (median) and 75 % per- centiles (from bottom to top). In the boxes, crosses represent the mean. Whiskers represent minimum and maximum values, and cir- cles are outliers. Outliers are staggered to better visualize them.
To identify the station, see outliers’ labels and color legend. For a(325), SUVA254andS(275–295)n=38. For SMHIX,n=37 and for DHAA%-DOCn=29.
values for DHAA%-DOC of 1.5. Highest EFs were recorded in the northernmost stations S1 to S3, and on the southern- most transect S19 to S1778 (Fig. 5).
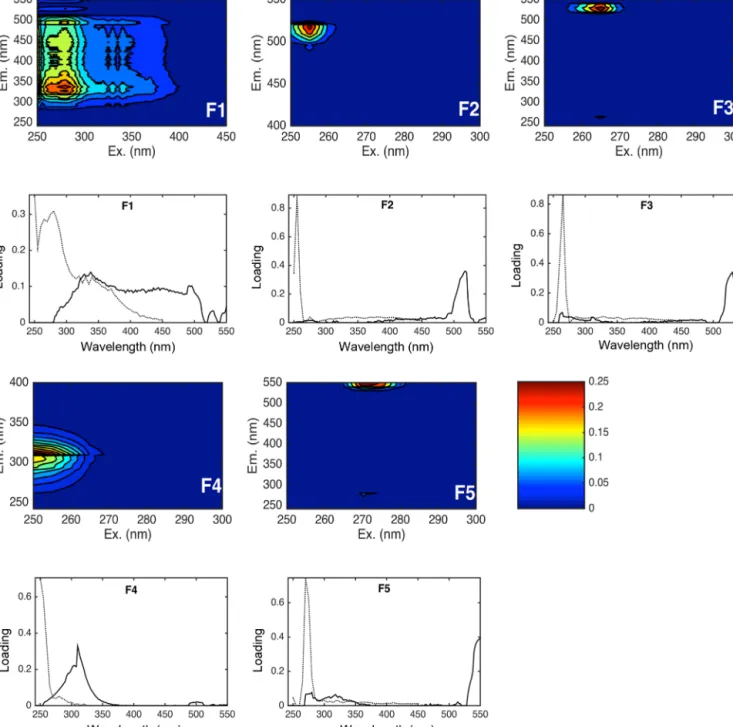
3.2 PARAFAC analysis for CDOM fluorophores Five optically active components were identified by PARAFAC analysis with the DrEEM toolbox in Matlab (Murphy et al., 2013), hereafter named F1, F2, F3, F4 and F5 (Fig. 6). The spectral characteristics of the five identi- fied components were compared to previous studies as de- scribed in Table 3. F1 had an excitation range of 250–290 nm with emission peaks between 320 and 350 nm, which cor- responds to peak T of the amino-acid-like fluorescence of tryptophan, derived by in situ primary production (Coble, 1996). This component (F1) was generally enriched in the SML (Figs. 7, 8) with a median EF=1.5, between a min- imum EF of 0.5 and a maximum EF of 3.3. Potential loss processes of this compound are its destruction by UV light and microbial degradation (Stedmon and Markager, 2005b).
F1 has also been related to protein-like fluorescence of ex- tracellular polymeric substances (Liu and Fang, 2002). Flu- orescence intensities of F1 were the lowest compared to the
other fluorophores, but significantly higher in the SML com- pared to the ULW (Mann–Whitney rank sum test,p< 0.001, n=38). Both in SML and ULW, fluorescence intensities of F1 were positively correlated to components F3, F4 and F5 (Spearman rank order correlation coefficient C=0.37, p< 0.001,n=76 with F3;C=0.41,p=0.001,n=57 with F4;C=0.38,p< 0.001,n=76 with F5).
Component F2 had a short wavelength excitation range (250–260 nm) with emission at longer wavelengths (500–
520 nm), corresponding to peak A of fulvic acids and humic acids (Stedmon and Markager, 2005a; Singh et al., 2010; Ya- mashita and Jaffé, 2008; Coble, 2007; Santín et al., 2009).
F2 showed a regional enrichment in the SML, with high- est values at the northernmost stations S2 to S3 and at sta- tions S10_1 to S10_4 (Fig. 7). F2 enrichment was not ubiqui- tous (Fig. 8), with median EF=1, ranging from a minimum EF=0.5 and a maximum EF=3.6. F2 positively correlated with bacterial abundance and temperature (Table 4) and to F3 and F5 components (Spearman rank order correlation co- efficientC=0.74,p< 0.001,n=76 with F3, andC=0.71, p< 0.001,n=76 with F5).
Component F3 was characterized by a clear excitation peak at 265 nm, with emission maxima in the longer wave- length range 520–540 nm. Component F3 showed a median EF=1.1 (minimum EF=0.3, maximum EF=4.7), indicat- ing a slight enrichment in the SML (Fig. 8), with higher ac- cumulations close to the coast at stations S19_2 to S1778 and at the edge of the continental shelf at stations S4 and S8 (Fig. 7), in correspondence with the highest enrichment of gel particles in the SML (Engel and Galgani, 2016). In our study F3 was positively correlated with the abundance of bacteria, proteinaceous particles and increasing SUVA254 (Table 4). It showed an inverse correlation to salinity (Ta- ble 4). Besides F1 and F2, F3 was significantly correlated to F5 (Spearman rank order correlation coefficientC=0.87, p< 0.001,n=76).
Component F4 was not detectable at all stations, but showed high enrichment in the SML close to the coast and along the continental shelf at stations S10_1 to S10_4, S13_1 to S13_3, S14_1 to S15_2 (Fig. 7). F4 was generally en- riched in the SML (Fig. 8) with median EF=1.5 (in a minimum-maximum EF range of 0.4–14.9) and with sig- nificant differences in fluorescence intensity compared to the ULW (Mann–Whitney rank sum test,p< 0.001,n=38).
F4 featured characteristics of an amino-acid-like fluorophore with excitation–emission maxima in the range 250–265/284–
320 in the fluorescence peak T region of tyrosine (Coble, 1996; Murphy et al., 2008; Aoki et al., 2008; Yamashita and Tanoue, 2003) and phenylalanine (Yamashita and Tanoue, 2003; Jørgensen et al., 2011) (Table 3). F4 was negatively correlated to bacterial abundance (Table 4), and to slope ratio SR with SR=(S(275–295) :S(350 : 400)). F4 was also neg- atively correlated to SMHIX, indicating a low humic-acid content of this fluorophore. As for F1, it positively corre- lated with SUVA254and DHAA%-DOC (Table 4). Interest-
Figure 5. Enrichment factors (EFs) in the Peruvian upwelling region. From the top left, EF for absorption coefficient measured at 325 nm both in SML and ULW, spectral slope parameterS(275–295) as indicator for changes in DOM molecular weight, SUVA254as indicator for DOM aromatic content, DHAA%-DOC as indicator of DOM lability, and SMHIX as indicator of humic content of DOM.
ingly, F4 showed the highest fluorescence intensities among all samples.
Component F5 was quite difficult to identify, as we found no comparable spectra in the literature. It showed typical characteristics of allochtonous humic-like material with ex- citation/emission ranges in the peak A and C regions, which have been observed in bay and offshore waters (Mostofa et al., 2013). F5 had the highest fluorescence intensities both in the SML and ULW but was not clearly enriched in one or the other compartment (Fig. 8). EFs ranged from a minimum of 0.5 and a maximum of 3, with median value=1.1. Highest enrichments in the SML were observed at northern stations S4 and S4_2, at stations S10_1 to S10_4, and in the south- ern stations S20 to S1778 (Fig. 7). F5 was similar in charac-
teristics to component F3, and positively correlated to bac- terial abundance and proteinaceous CSP particles (Table 4).
Component F5 was also positively correlated to all other flu- orophores F1, F2, F3 as described, and to F4 (Spearman rank order correlation coefficientC=0.34,p=0.009,n=57).
On the revisited stations, only component F1 showed a di- rect dependency on light exposure, significantly decreasing in fluorescence – thus concentration – with increasing global radiation intensity (r2=0.56, p=0.013, n=10). Compo- nents F2 to F5 showed no significant change with increased irradiation (Spearmank rank order correlation analysis).
Figure 6. (Above) Contour plots of five fluorescent components as identified by PARAFAC analysis and (below) relative spectral loadings of overlaid spectra for the 5-components model validated with 3 split comparisons. The axes of contour plots have been scaled to better visualize the fluorescence intensities (R.U.). A figure with the complete spectrum is included in the Supplement (Fig. S3). The dashed black line in the spectral loadings indicates excitation maxima for each component, the solid black line indicates emission peaks.
3.3 Changes in CDOM properties related to the biological and physical environment
Both in the SML and ULW, CDOM optical properties as ab- sorption coefficienta(325),S(275–295), and SUVA254were compared to salinity, temperature, wind speed and particu- late organic carbon (POC) (Table 5). Data on POC have been
described in detail in Engel and Galgani (2016). CDOM ab- sorption coefficienta(325) decreased at higher salinity, tem- perature and wind speed in the SML and ULW, with stronger dependency on these physical parameters in the SML (Ta- ble 5). In both compartments, there was a positive correlation ofa(325) to POC. The spectral slope parameterS(275–295), indicator for DOM molecular weight, source, and degra-
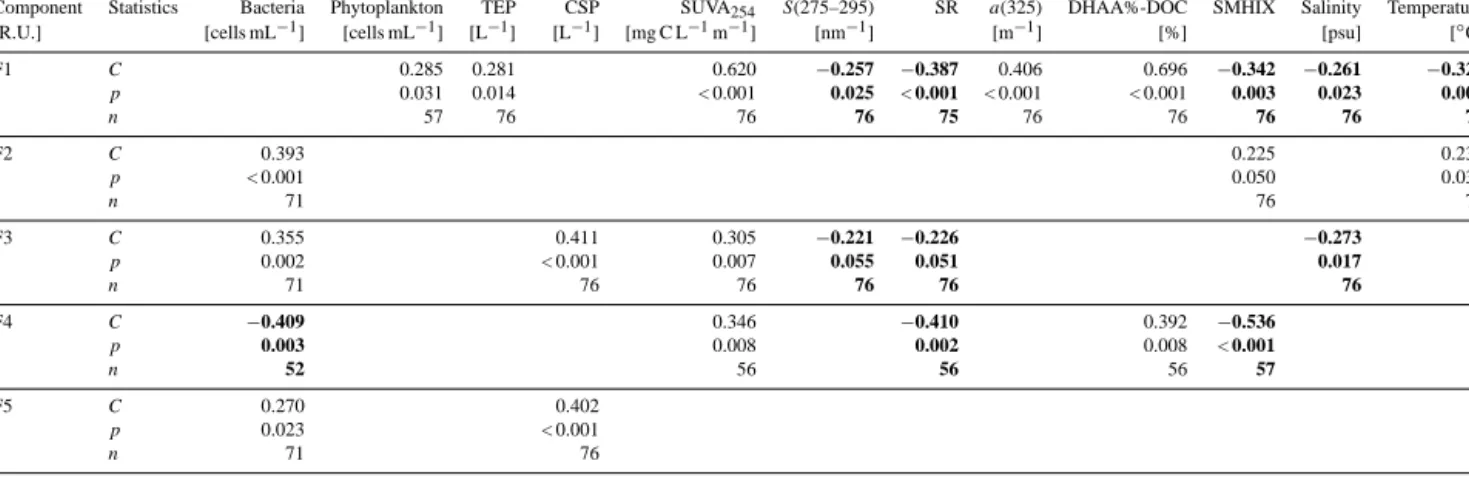
Table 4. Spearman rank order correlation coefficients (C)between fluorescent components (F1–5) and total bacterial and phytoplankton cells, TEP and CSP particles, SUVA254,S(275–295), SR,a(325), DHAA%-DOC, SMHIX, salinity and temperature measured in our study, both in the SML and ULW. Statistical significance was accepted forp< 0.05.n=number of samples. Only statistically significant correlations are shown. Bold characters indicate negative correlations.
Component Statistics Bacteria Phytoplankton TEP CSP SUVA254 S(275–295) SR a(325) DHAA%-DOC SMHIX Salinity Temperature
[R.U.] [cells mL−1] [cells mL−1] [L−1] [L−1] [mg C L−1m−1] [nm−1] [m−1] [%] [psu] [◦C]
F1 C 0.285 0.281 0.620 −0.257 −0.387 0.406 0.696 −0.342 −0.261 −0.323
p 0.031 0.014 < 0.001 0.025 < 0.001 < 0.001 < 0.001 0.003 0.023 0.004
n 57 76 76 76 75 76 76 76 76 76
F2 C 0.393 0.225 0.238
p < 0.001 0.050 0.038
n 71 76 76
F3 C 0.355 0.411 0.305 −0.221 −0.226 −0.273
p 0.002 < 0.001 0.007 0.055 0.051 0.017
n 71 76 76 76 76 76
F4 C −0.409 0.346 −0.410 0.392 −0.536
p 0.003 0.008 0.002 0.008 < 0.001
n 52 56 56 56 57
F5 C 0.270 0.402
p 0.023 < 0.001
n 71 76
dation processes (Helms et al., 2008), increased at higher salinity and temperature (Fig. 9d) in the SML and ULW. It did not show any correlation to wind speed, but a signifi- cant negative correlation to POC in both compartments (Ta- ble 5). Moreover, an increase of bacterial and phytoplank- ton cells led to a lower S(275–295) both in the SML and ULW (Fig. 9a, b). The dependency of S(275–295) on bac- teria in the SML (Spearman rank order correlation coeffi- cient C= −0.59, p< 0.001, n=35) was stronger than in the ULW (C= −0.38,p=0.02,n=36), potentially indicat- ing a higher bacterial CDOM contribution.S(275–295) was also negatively correlated to phytoplankton abundance with a stronger relationship in the ULW (C= −0.64,p=0.001, n=22) than in the SML (C= −0.47,p=0.004,n=35). In the SML, we observed a significant decrease inS(275–295) with increasing abundance of gelatinous proteinaceous par- ticles (CSP) (Fig. 9c), while in the underlying water a lower S(275–295) was highly related to increasing concentration of polysaccharidic gels (TEP). In both SML and ULW, higher salinity, temperature and wind speed were related to lower SUVA254indexes, as indicators of DOM aromaticity. A pos- itive correlation was observed instead between SUVA254and POC (Table 5). An increment in temperature was inversely correlated to DOM lability, and therefore bioavailability, ex- pressed as DHAA%-DOC, indicating a higher degree of DOM degradation (Spearman rank order correlation coef- ficient C= −0.68,p< 0.001, n=29 in the SML andC=
−0.66,p< 0.001,n=29 in the ULW). DHAA%-DOC was also lower at higher salinity (Spearman rank order correla- tion coefficientC= −0.42,p=0.02,n=29 in the SML and C= −0.63,p< 0.001,n=29 in the ULW). As forS(275–
295), we observed similar trends in SR (data not shown): SR was negatively correlated to DHAA%-DOC (Spearman rank order correlation coefficientC= −0.50,p< 0.001,n=75) and to both gel particles abundance (Spearman rank order
Table 5. Spearman rank order correlation (C)between CDOM opti- cal properties both in the SML and ULW with salinity (CPSU), wa- ter temperature (CT), wind speed (CU)and particulate organic car- bon (CPOC). Significant correlations (p<0.01) are marked in bold (excepta=p< 0.05). nis the number of samples, except∗=36 samples.
SML CPSU CT CU CPOC n
CDOMa(325) −0.420 −0.728 −0.535 0.579 38 S(275–295) 0.640 0.616 0.318 −0.597 38 SUVA254 −0.380a −0.634 −0.460 0.537 38 ULW
CDOMa(325) −0.329a −0.637 −0.386a 0.656∗ 38 S(275–295) 0.493 0.613 0.24 −0.622∗ 38 SUVA254 −0.326a −0.458 −0.324a 0.495∗ 38
correlation coefficientC= −0.37,p< 0.001,n=75 for TEP and C= −0.33, p=0.004, n=75 for CSP). SR did not show any significant correlation to total bacteria or phy- toplankton abundance, but was significantly lower in the SML, with a median EF=0.9 (Mann–Whitney rank sum test, p=0.013, n=38). Furthermore, DHAA%-DOC was significantly higher in the SML (Mann–Whitney rank sum test,p=0.036,n=38).
4 Discussion
4.1 CDOM enrichment and production in the top surface layer of the ocean
The enrichment of organic material in the SML has been mainly related to biological processes in the euphotic zone below the surface (Hardy, 1982; Liss and Duce, 2005). EBUS
Figure 7. Distribution of enrichment factors (EFs) for fluorescent components F1, F2, F3, F4, F5 identified in this study. Maximum EF for F4 has been recorded at station S10_2, with a value of 14.9. For visualization purposes, this data point is not included in the figure and fluorescence intensities have been scaled down to a maximum EF=6.
are among the most productive regions in the ocean and therefore interesting systems to investigate the relationship between organic matter accumulation and SML biogeochem- ical properties. The Peruvian EBUS is associated with an ex- tensive OMZ and a key region for the study of gas fluxes from the ocean (Paulmier et al., 2008; Paulmier and Ruiz-Pino, 2009; Keeling et al., 2010). The presence of an organics- enriched surface layer may strongly affect gas exchange be- tween the marine and the atmospheric systems (Engel and Galgani, 2016). The characterization of CDOM via its opti- cal properties adds relevant information to the organic matter composition in the SML, as it allows discriminating between terrestrial and marine sources of DOM that may be equally
enriched at the surface. Moreover, it helps tracking changes in DOM “quality” deriving from higher DOM exposure to solar radiation at the sea surface than deeper in the water col- umn. As such, microbial and photochemical DOM turnover in the SML may contribute to the atmospheric emission of gases and chemical reactive species, and interfere with the microbial carbon loop in the ocean.
In the Peruvian EBUS, we observed a general enrichment of CDOM in the SML with respect to the ULW, based on values of the specific absorption coefficienta(λ) measured at 325 nm. Higher values for CDOM absorbance were ob- served in the coastal upwelling stations characterized by low- est salinity, temperature and highest enrichment of organic
Enrichment factors
Figure 8. Box and Whiskers plot of enrichment factors for fluores- cent components F1, F2, F3, F4 and F5. The horizontal lines of the boxes represent 25 %, 50 % (median) and 75 % percentiles (from bottom to top). In the boxes, crosses represent the mean. Whiskers represent minimum and maximum values, and circles are outliers.
Outliers are staggered to better visualize them. To identify the sta- tion, see outliers’ labels and color legend. For F4,n=24. For all other components,n=38.
components, both in the particulate and dissolved fraction (Engel and Galgani, 2016). It is commonly observed that spectral loadings of allochtonous/terrestrial-like CDOM de- crease with increasing salinity (Murphy et al., 2008). How- ever, we did not observe such trends in our samples. In- stead, we found a negative correlation of amino-acid-like flu- orophore F1 to salinity and temperature, and no clear enrich- ment of humic-acid-like fluorophores F2, F3 and F5 in the SML. Therefore, we think that in the SML of the study re- gion the contribution of terrestrially derived CDOM, if any, is overwhelmed by the high productivity of the upwelling system. Organics enriched in the SML such as the amino- acidic compounds F1 and F4 found at the upwelling stations may therefore reflect other processes rather than input of al- lochtonous CDOM from land. DOC concentrations in the SML were related to DOC concentrations in the ULW (En- gel and Galgani, 2016), and the same was true for CDOM absorption coefficienta(325) (Spearman rank order correla- tion coefficientC=0.82,p< 0.001,n=38), implying a di- rect dependency of SML CDOM on the organic matter in the ULW (Zhang and Yang, 2013). CDOM absorption coef- ficient a(325) as well as its spectral slopeS(275–295) did not show any correlation to changes in DOC concentrations, neither in the SML, nor in the ULW, but were significantly related to DOM diagenesis (DHAA%-DOC) POC, and abun- dance of autotrophic and heterotrophic microorganisms sug- gesting a recent production of labile or semi-labile substrates driven by in situ microbial or photochemical processes in the underlying euphotic zone or at the immediate sea sur- face. A closer look on CDOM spectral properties revealed significant differences between SML and ULW. According to Helms et al. (2008), an increase in S(275–295) and SR
Figure 9. (a) Linear regression between bacterial abundance [106cells mL−1] and spectral slope S(275–295) [nm−1] in SML and ULW. (b) Linear regression (ULW) and Spearman rank order correlation (SML) between phytoplankton abundance [104cells mL−1] and spectral slopeS(275–295) [nm−1]. (c) Linear regression between CSP abundance [108particles L−1] and spectral slopeS(275–295) [nm−1] in the SML and between TEP abundance [108particles L−1] and spectral slopeS(275–295) [nm−1] in the ULW. (d) Linear regression between temperature [◦C] andS(275–
295) [nm−1] in SML and ULW. Black triangles: SML, open dots:
ULW.
suggests CDOM photodegradation and decreasing molecular weight. DHAA%-DOC is used here as an indicator for DOM diagenesis, thus, the extent of microbially altered DOM. The higher DHAA%-DOC, the more labile, bioavailable, recent and less altered DOM in the sample. We observed a neg- ative correlation when comparing DHAA%-DOC and POC toS(275–295) and to SR. The higher DHAA%-DOC, the lower S(275–295) and SR. Microorganisms adopt several strategies against tough environments; the correlation be- tween DHAA%-DOC toS(275–295) and SR was stronger in the SML than in the ULW, suggesting an accumulation of HMW-DOM related to the contribution of microorganisms directly in the SML or in the proximity due to cell lysis or ex- udation, which has been previously proposed (Tilstone et al., 2010). Thus, the close correlations of optical parameters to POC and marine gels lead to hypothesize that autochthonous CDOM produced in the very surface ocean can actually be incorporated in the gelatinous organic carbon pool.
![Figure 3. CDOM absorption coefficient a(325), [m −1 ], in SML and underlying water (ULW) and spectral slope parameter between 275 and 295 nm, S(275–295), [nm −1 ].](https://thumb-eu.123doks.com/thumbv2/1library_info/5354357.1683041/9.918.159.761.113.839/figure-cdom-absorption-coefficient-underlying-water-spectral-parameter.webp)