https://doi.org/10.1007/s41063-020-00079-8 ORIGINAL ARTICLE
Opening of the Fram Strait led to the establishment of a modern‑like three‑layer stratification in the Arctic Ocean during the Miocene
Akil Hossain1 · Gregor Knorr1 · Wilfried Jokat1,2 · Gerrit Lohmann1
Received: 28 September 2020 / Accepted: 24 December 2020
© The Author(s) 2021
Abstract
The tectonic opening of the Fram Strait (FS) was critical to the water exchange between the Atlantic Ocean and the Arctic Ocean, and caused the transition from a restricted to a ventilated Arctic Ocean during early Miocene. If and how the water exchange between the Arctic Ocean and the North Atlantic influenced the global current system is still disputed. We apply a fully coupled atmosphere–ocean–sea-ice model to investigate stratification and ocean circulation in the Arctic Ocean in response to the opening of the FS during early-to-middle Miocene. Progressive widening of the FS gateway in our simulation causes a moderate warming, while salinity conditions in the Nordic Seas remain similar. On the contrary, with increasing FS width, Arctic temperatures remain unchanged and salinity changes appear to steadily become stronger. For a sill depth of ~ 1500 m, we achieve ventilation of the Arctic Ocean due to enhanced import of saline Atlantic water through an FS width of ~ 105 km. Moreover, at this width and depth, we detect a modern-like three-layer stratification in the Arctic Ocean. The exchange flow through FS is characterized by vertical separation of a low-salinity cold outflow from the Arctic Ocean con- fined to a thin upper layer, an intermediate saline inflow from the Atlantic Ocean below, and a cold bottom Arctic outflow.
Using a significantly shallower and narrower FS during the early Miocene, our study suggests that the ventilation mechanisms and stratification in the Arctic Ocean are comparable to the present-day characteristics.
Keywords Fram Strait · Arctic ocean stratification · Arctic ocean circulation · Gateway widening · Miocene · Ventilation
Introduction
Large-scale climate changes throughout the Cenozoic (from 65 Ma to present) have been linked to ocean gateway con- figurations and CO2 changes and their respective impact on the ocean circulation [1–3]. One of the major challenges of modeling past climate and ocean circulation is due to large uncertainties in boundary conditions during the geologi- cal past. Of the tectonic boundary conditions, the changes in ocean gateway geometries (i.e., Fram Strait; FS) have
imposed significant changes in the Arctic Ocean and global ocean circulation [4–7].
The formation of Arctic–Atlantic gateways plays a key role in global climate history by driving heat transport between the Atlantic and Arctic Ocean [3]. The evolution of the FS, located between Svalbard and Greenland, is sup- posed to play a crucial role in ocean dynamics of the Arctic Ocean and, therefore, in the evolution of the north polar region [8]. The timing for the opening of FS is well con- strained by magnetic and seismic data that show the FS was likely a narrow and shallow gateway around 21 Ma [9]. The early Miocene opening of FS [9] allowed an increased water mass exchange between the Atlantic Ocean and the Arc- tic Ocean, with significant climatic impacts that strongly influenced the paleoceanographic conditions in the Arctic Ocean [6], and likely caused enhanced contribution of the North Atlantic thermohaline circulation [11]. During this period, saline Atlantic waters entered to the Arctic and sup- plied oxygen to intermediate/deep waters transforming the Arctic Ocean from a restricted to a fully ventilated Ocean at around 17.5 Ma [8]. This also enhanced the heat transport
Supplementary Information The online version contains supplementary material available at https ://doi.org/10.1007/s4106 3-020-00079 -8.
* Akil Hossain akil.hossain@awi.de
1 Alfred Wegener Institute, Helmholtz-Centre for Marine and Polar Research, Bremerhaven, Germany
2 Department of Geoscience, University of Bremen, 28359 Bremen, Germany
and moisture supply to northern higher latitudes via the westerlies [12] and enabled extensive growth of floating ice shelves or sea-ice beginning at ~ 15 Ma [5].
As mentioned above, the geometry of the gateway (width and depth) and a deep-water circulation around 1500 mbsl across the FS [13] are critical parameter controlling the transformation from the closed Arctic Ocean to a ventilated basin [9]. Today, the FS width is ~ 670 km [3, 7] and it depth varies from 2550 to 2800 m [6, 7]. Using a two-layer analyti- cal model, Jakobsson et al. [8] estimate that the transition to a fully oxygenated Arctic Ocean happened when FS reached a width of around 40–50 km. Subsequently, Thompson et al.
[6] achieve ventilation of the Arctic with a prescribed FS sill depth of 1000 m and a width of 100 km and a two-layer ocean stratification in the early Miocene. The exchange flow through FS shows an outflow of low-salinity water from the Arctic Ocean confined to a thin upper layer and an inflow from the saline Atlantic Ocean below. However, the Thomp- son et al.’s [6] model did not consider oceanic temperature variations and wind-forcing, and their calculations are based on a two-layer stratification only. Today, there is a fairly complicated three-layer stratification in the Arctic Ocean with a cold bottom layer [14, 15] and partly wind-driven circulation.
In our study, we provide an enhanced simulation with advanced oceanic and atmospheric boundary conditions at the Miocene/Oligocene boundary. We like to understand how fast the oceanographic changes from a two-layer to present-day conditions are possible. Furthermore, we apply a climate model to assess the sensitivity of stratification and circulation in the Arctic Ocean to the opening of FS and dif- ferent levels of atmospheric CO2 concentrations. The model simulation applies a Miocene-bathymetric reconstruction [10], which is believed to capture the major bathymetric features, such as different sub-basins and sills. Furthermore, CO2 changes are used relative to early–middle Miocene (about 23–15 Ma) boundary conditions. In our numerical experiments, we investigate several different opening geom- etries for the FS to constrain the regional and global climate impacts of this tectonic event.
Materials and methods
We use the Earth System Model COSMOS, which incorpo- rates the atmosphere model ECHAM5 [16], the ocean model MPI-OM [17], and the land-vegetation model JSBACH [18].
The atmosphere model is used at T31 (~ 3.75° × 3.75°) hori- zontal resolution with 19 vertical layers. The ocean model has a resolution of GR30 (3° × 1.8°) and has 40 vertical lay- ers. The spatial resolution increases to ~ 30 km towards the grid poles at Antarctica and Greenland. Such a better resolu- tion close to the grid poles enhances the representation of
physical processes for the deep-water formation in Nordic, Labrador, and Weddell seas. The interactive exchange of fluxes and energy between ocean and atmosphere is han- dled via the coupler OASIS3 [19]. Our model setup has already been used to analyse the Miocene warm climate [3, 7, 20–22], the Pliocene [23], the Last Glacial Maximum [24, 25], the Holocene [26, 27], and the last millennium [28]. This setup is identical to the study of Hossain et al.
[7] describing the early-to-middle Miocene time period (~ 23–15 Ma).
Hossain et al. [7] investigated the impact of single ocean gateway, FS, and Greenland–Scotland Ridge (GSR), respec- tively, on the Arctic Ocean circulation and the combined effect of both. They found a non-linear impact of gateway depth on the water mass exchange and ocean circulation that is mainly driven by the effect of gateways subsidence and their interaction. In this study, we investigate if and how different FS widths could have affected the global ocean circulation and climate between 23 and 15 Ma. Our primary focus is on the sensitivity of Arctic Ocean stratification and circulation controlled by FS gateway configurations and CO2 changes.
In our reference simulation (MIO_FW500), we prescribe an atmospheric CO2 concentration of 450 ppm, with an FS width of ~ 500 km and fixed gateway depths of ~ 1500 mbsl.
In the Arctic Ocean, the FS represents the only early Mio- cene gateway of the Arctic Ocean, since other shallow con- nections to the world’s ocean like the Barents Sea, Canadian Archipelago, and Bering Strait evolved only after the middle Miocene [29, 30]. Furthermore, the Panama Seaway is not yet closed and connects the Pacific and Atlantic oceans. Also remnants of the Tethys exist [4]. We integrate our model for 4 kyrs to minimize salinity/temperature trends in the deep ocean after initialisation with the present-day conditions.
Sensitivity experiments are performed for the FS by vary- ing its width (Table 1). After model integration of 2 kyrs, the final 100 yrs of model simulation are used for analysis.
Starting from a narrow FS width of ~ 50 km, in a set of six model simulations, we gradually widened the ocean gateway to 105, 222, 286, 352, and 500 km, respectively (Table 1). As deepening of the FS between ∼2000 and 1500 mbsl might be important for the deep-water exchange [9], the sill depth of FS is always fixed to 1500 mbsl. For minimum FS widths of ~ 50 km, in principle, the ocean gateway is likely wide enough to allow rotationally controlled exchange flows [31], as described by the Rossby radius of deformation. However, in the model experiments MIO_FW50 and MIO_FW105 with a FS width of ~ 50 km and ~ 105 km, its geometry is only represented by one and two zonal grid boxes, respec- tively, owing to spatial limits in the resolution of the ocean model component. Apart from the FS gateway sensitivity experiments, we performed additional simulations at differ- ent levels of atmospheric CO2 (280, 450, 600, and 840 ppm;
Table 1) that are within a broad range of reported CO2 levels representative for the Eocene–Miocene time period [32–34].
Results
Ventilation of the Arctic Ocean
For minimum FS widths of ~ 50 km, our simulation indicates a northward penetration of dense Atlantic waters across a narrow gateway. It establishes a hydraulically controlled out- flow of relatively fresh water in the upper layer (Supplemen- tary Figure 1), and a deep inflow of saline and warm Atlantic water. As a result of saltwater exchange across the FS and net Arctic freshwater input (river runoff and net precipita- tion) via the atmospheric hydrological cycle, a vertical Arc- tic halocline and salinity gradient establish. The formation of
vertical and horizontal salinity gradients strengthens Arctic gyre circulation following isolines of salinity and causes poorly oxygenated conditions. An inflow of salty North Atlantic waters across the FS perturbs the Arctic stratifica- tion as reflected by excursions of the characteristic halocline (Fig. 1). The vertical separation of Atlantic water inflow with respect to the mixed layer above tends to reduce the amplitude of the halocline and the baroclinic–geostrophic balance of the gyre circulation.
By widening the FS from ~ 50 to ~ 105 km at fixed gate- way depths of ~ 1500 mbsl, an unrestricted inflow of Atlantic water to the Arctic is possible and indicated by a promi- nent unperturbed Arctic halocline (Fig. 1). We detect the transition towards a bi-directional gateway circulation and ventilation of the Arctic Ocean. It establishes a three-layer exchange flow through the FS that is characterized by verti- cal differentiation of water masses. The outflow of relatively
Table 1 List of sensitivity experiments including relevant model parameters
Model Exp Fram Strait
width (km) max. Fram Strait
depth (m) GSR depth (m) Atmos. CO2
(ppm) Length of simulation (kyrs)
MIO_FW50 ~ 50 ~ 1500 ~ 960 450 2.0
MIO_FW105 ~ 105 ~ 1500 ~ 960 450 2.0
MIO_FW222 ~ 222 ~ 1500 ~ 960 450 2.0
MIO_FW286 ~ 286 ~ 1500 ~ 960 450 2.0
MIO_FW352 ~ 352 ~ 1500 ~ 960 450 2.0
MIO_ FW500 ~ 500 ~ 1500 ~ 960 450 3.3
MIO_280 ~ 500 ~ 1500 ~ 960 280 1.0
MIO_600 ~ 500 ~ 1500 ~ 960 600 1.0
MIO_840 ~ 500 ~ 1500 ~ 960 840 1.0
PI ~ 670 ~ 2800 ~ 1100 280 5.9
Fig. 1 Impact of gateway width on vertical salinity characteristics in the Arctic Ocean. a Mean salinity profiles (‰) and b haloclines (dS/dz;
‰/m) of the Arctic Ocean for different FS gateway widths
thin, cold, and low-salinity Arctic water is situated above a compensational inflow of warm and salty North Atlan- tic water and a cold bottom outflow (Fig. 2). Due to the enhanced import of saline and oxygen‐rich Atlantic water through the FS, the Arctic subsurface waters eventually became saltier and oxygenated [6, 8]. With the establishment of a bi-directional circulation regime and an Arctic halocline (Fig. 1), the through flow into the Arctic Basin causes the reorganization towards a ventilated Arctic salinity regime.
Widening of the FS towards ~ 286 km or above further strengthens a more effective cross-sectional water mass transport (Fig. 3 and Supplementary Figure 2). The strait becomes wide enough that the effect of the Earth’s rota- tion alters the water flow in the upper layer through the FS
to a rotationally controlled bi-directional flow, rather than hydraulically controlled and the establishment towards a modern prototype exchange flow. It is characterized by the horizontal differentiation between the southward directed outflow of Arctic Basin at the western continental slope of the strait and the northward directed Atlantic inflow to the East. Although a modern-like wide FS gateway configura- tion allows unrestricted ocean water interchange and thus reducing the Arctic halocline, we still obtain stronger than PI vertical salinity contrasts. This is mainly because of a relatively fresh Arctic surface layer fed by river runoff and net precipitation balanced by salty southern sourced Atlantic water. The total outflow of low-salinity surface water via the FS is greater than the total inflow (Supplementary Table 1).
Fig. 2 A cross-section of the Arctic Ocean annual mean temperature (in K) for the model experiments: a MIO_FW50, b MIO_FW105, c MIO_
FW222, d MIO_FW286, and e MIO_FW352
Much of this exchange reflects recirculation within the strait, although parts of it enter the Arctic Ocean and contribute to ventilate deep waters.
Finally, we calculate the turnover time, which is defined as the ratio of total water volume in the Arctic Ocean to the total outflow through FS [6]. In our study, the total volume of water in the Arctic is 1.6293e+16 m3 and the total out- flow through FS is 1.01e+6 m3/s. This results into a similar turnover time of ~ 512 yrs, compared to 480 yrs estimated by Thompson et al. [6] taken the uncertainties into account.
Stratification in the Arctic Ocean
In the model experiments MIO_FW50 at a FS width of ~ 50 km, we detect that the simulated stratification in the Arctic Ocean has a two-layer structure only, with a surface
layer of shallow cold and low-salinity water situated above a deep and weakly stratified lower layer (Fig. 2). The lower layer consists of warmer saline water of Atlantic origin that is advected northward through FS and progressively mixed with the cold low-salinity upper ocean water. The exchange flow through FS is characterized by vertical separation of water masses, as shown by an outflow of relatively fresh and cold Arctic waters at the surface and a compensational inflow of warm and salty Atlantic waters below. This two- layer stratification of the Arctic Basin is caused by the net freshwater input and the reduced inflow of saline Atlantic water, which deters the possibility of forming a less saline but cold bottom layer.
The two-layer stratification in the Arctic Ocean changes with the widening of the FS and the increasing ocean water mass interchange. In the model experiments MIO_FW105,
Fig. 3 Ocean velocity at the surface (6 m water depth, m/s) for the experiments of: a MIO_FW50, b MIO_FW105, c MIO_FW222, d MIO_
FW286, e MIO_FW352, and f MIO_FW500
MIO_FW222, MIO_FW286, MIO_FW352, and MIO_
FW500 at the FS width of ~ 105, ~ 222, ~ 286, ~ 352, and ~ 500 km (Figs. 2 and 4b), respectively, and with a sill depth of ~ 1500 m, a three-layer structure for the Arctic Ocean is established, with a cold bottom layer encountered below the warmer intermediate Atlantic layer.
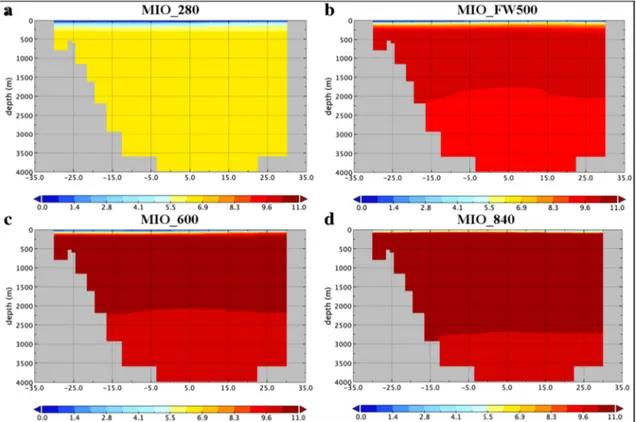
Effect of CO2 concentrations on Arctic Ocean stratification
To test the sensitivity of Arctic Ocean stratification to atmospheric changes, we perform additional simulations at different levels of atmospheric CO2 concentrations (280–840 ppm), capturing a wide range of greenhouse gas variations representative for the Eocene–Miocene time period [32–34]. We choose only a single FS width of ~ 500 km and vary the atmospheric CO2 (280, 450, 600, and 840 ppm) accordingly. The CO2 concentration at 450 ppm reflects the standard Miocene configuration that has also been applied for the earlier presented FS gateway sensitivity experiments. The CO2 level of 280 ppm is typi- cal for pre-industrial (PI) times. Today, ~ 415 ppm has been reached.
With the increasing of CO2 levels, we observe a warming (3–6 °C) (Fig. 4) in combination with reduced annual mean
sea-ice cover in the Arctic Ocean (Supplementary Figure 3).
Analyses of gravity cores [35] show that the central Arctic Ocean was more or less ice-free during middle-to-late Mio- cene summers for 600 and 840 ppm CO2 levels, whereas sea ice still existed during summers for 278 and 450 ppm CO2 simulations. We find that the simulated stratification in the Arctic Ocean regime for the model experiments MIO_280 has a bi-layer structure, with a cold shallow upper layer above a slightly warmer deep-water mass likely of Atlantic origin that extends down to the bottom (Fig. 4). With the increasing of CO2 levels to 450 ppm or above (MIO_FW500, MIO_600, and MIO_840), we find three-layer stratifica- tion in the Arctic Ocean, including a cold low-saline bot- tom layer. This three-layer structure becomes even more pronounced by increasing the CO2 level, and is most pro- nounced at CO2 levels of 840 ppm (Fig. 4).
Elevated atmospheric CO2 concentrations enhance the Arctic freshwater budget (Supplementary Table 1). The additional freshwater from the Arctic region is transferred into the Atlantic Ocean, combined with enhanced high latitude warming that reduces deep-water formation. This leads to a slowdown of the Atlantic Meridional Overturn- ing Circulation (AMOC) (Supplementary Table 1). At the FS gateway, particularly, the additional Arctic freshwater export linked with the attenuated salt import of northward
Fig. 4 A cross-section of the Arctic Ocean annual mean temperature (in K) for the model experiments: a MIO_280, b MIO_FW500, c MIO_600, and d MIO_840
directed Atlantic waters decreases the baroclinity and overall salinity in the Arctic Ocean (Supplementary Fig. 4 and Sup- plementary Table 1).
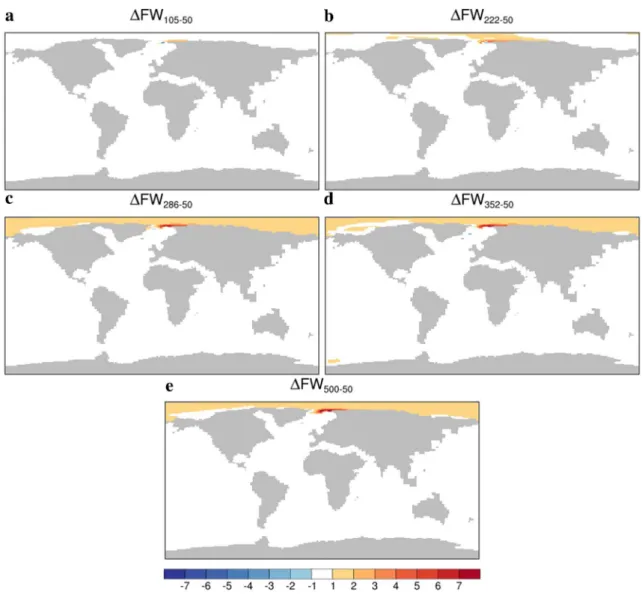
Effect of FS widening on the climate
An isolated widening of the FS gateway from ~ 50 to ~ 105 km at fixed gateway depths of ~ 1500 mbsl provides an enhanced inflow of warmer and saltier Atlantic water to the Arctic Ocean and unrestricted water exchange (Sup- plementary Figure 2a, b). As a consequence, we detect mild warming (up to + 1 K), but unchanged salinity conditions in the Nordic Seas (Figs. 5, 6). Arctic temperatures also remain unaltered, but a salinity (up to + 3 psu) increase in combina- tion with reduced sea-ice cover is detected (Supplementary Fig. 5).
Progressive widening of the FS gateway from ~ 50 to ~ 500 km (Table 1) shows the similar basic characteristics
in temperature and salinity as widening from ~ 50 to ~ 105 km with stronger magnitudes of change for a wider FS gateway (Figs. 5, 6). The SSS changes in the Arctic appear to stead- ily become stronger with the widening of FS gateway. It is caused by the increased inflow of saline Atlantic water through FS which progressively mixed with the low-salinity upper ocean water.
Discussion
The continuous opening of FS is well constrained by mag- netic and seismic data [9] that show oceanic crust in the FS might have been formed after ~ 24 Ma [9]. Thus, dur- ing this initial opening phase, a shallow water exchange between the Arctic Ocean and the North Atlantic [36, 37] is likely. Both plate kinematics models and geophysi- cal data [9, 38] indicate that the opening of FS started
Fig. 5 The effect of a ΔFW105-50, b ΔFW222-50, c ΔFW286-50, d ΔFW352-50, and e ΔFW500-50 on sea-surface temperature anomalies (SST; in K)
earlier than suggested by previous paleo-oceanographic studies [39] based on micropaleontology and biostratig- raphy. With time, the FS widened as a result of a large strike-slip movement between Svalbard and Greenland. A paleo-bathymetric model based on magnetic and regional seismic data [90] shows that the first deep-water exchange between the Arctic Basin and the Nordic Seas was likely between ~ 17 and 20 Ma. According to this model, the FS deepened to sill depths > 1500 mbsl at ~ 17 Ma. A paleo- bathymetric reconstruction indicates the transition to a fully ventilated Arctic Ocean at around 17.5 Ma allow- ing an unrestricted exchange of warm and saline Atlantic water and colder Arctic water [8, 40]. The ventilation was achieved in a relatively short period, since the drill cores show an abrupt change to modern sedimentation at that time instant. According to the age–width estimation using geophysical data and a recent paleo-bathymetric model [41] yields similar results. The FS began to deepen in the
early Miocene and reached modern depths (> 2000 m) by the middle Miocene (13.7 Ma [8]).
The simulated climate shows a global warming that matches the global mean temperature reconstruction [42]
suggesting warming (+ 6 K) with respect to PI conditions [3]. The Arctic Ocean was also relatively warm with tem- peratures of about 8.4–9.2 °C (Supplementary Table 1).
This is directly supported by the early Miocene (~ 18.2 Ma) sediments recovered from the Lomonosov Ridge (IODP Exp 302) during ACEX indicate SST of ~ 10 °C [43]. This also agrees with oxygen isotope analyses of fishbone carbonate [44] in the ACEX cores provided a salinity of about 35 psu and temperatures of about 6 °C for the early Miocene. Stein et al. [45] found alkenone-derived SST of ~ 8.9 °C in the central Arctic Ocean during late Miocene (~ 7.5 Ma; Sup- plementary Table 2). Observational data based on a combi- nation of satellite and direct measurements [46, 47] show a warming (~ 0.5–1.5 °C) in the Nordic Seas with a CO2 rise
Fig. 6 The effect of a ΔFW105-50, b ΔFW222-50, c ΔFW286-50, d ΔFW352-50, and e ΔFW500-50 on sea-surface salinity anomalies (SSS; in psu)
from ~ 300 to 400 ppm between 1901 and 2015 [48, 49]. In our Miocene simulation with increasing CO2 levels from 280 to 450 ppm, we observe warmer (~ 2.5–4.5 °C) Nordic Seas (Supplementary Figure 6). In general, our simulations could reproduce a warmer than the present-day Arctic Ocean dur- ing the Miocene [2, 50] with a stronger hydrological cycle (Supplementary Table 1 [51]).
The geometrical widening of the FS could have been important for climate and global ocean circulation by influ- encing the production of NADW, and initiating and inten- sifying the AMOC [Supplementary Figure 7; 8, 11, 30, 52]. The transition from poorly oxygenated towards fully ventilated (oxygenated) Arctic Ocean, characterized by a warmer ocean with higher salinities, as suggested by sedi- ment records from the Lomonosov Ridge (ACEX core analy- ses), has been attributed to the opening of FS [8, 40, 44].
In our numerical simulations, we have achieved a ven- tilated Arctic Ocean with a width of ~ 105 km. This agrees with the findings of previous studies [6, 53], although they have applied a shallower FS sill depth (1000 m) than used in our study (~ 1500 m) to induce ventilation. Hence, we do not expect a big difference to Thompson et al. [6, 53] from the point of ventilation changes if we would apply a similar depth. Furthermore, we used a fully coupled Earth System Model including feedbacks in the atmosphere–ocean–land system. Hence, the similarity of the dynamics of Arctic ven- tilation in response to FS widening in Thompson et al. [6, 53] and our study highlights the importance of an oceanic control. A narrowing of the FS in the late Miocene by the Hovgård Ridge [11] might not have had a large impact as long as the remaining width was more than 100 km. The ventilation of the Arctic Ocean is established by inflow through FS of North Atlantic originated deep-water and injection of brine-enriched dense shelf waters [14, 15]. We estimate a turnover time of ~ 512 yrs in our study which is similar to the time estimated in Thompson et al. [6].
Our model experiments with an FS width at around 105 km or more show a three-layer structure of Arctic strati- fication, with a colder shallow upper layer above a warmer intermediate layer of Atlantic origin and a relatively less- warm bottom layer. The present-day Arctic Ocean also has a three-layer stratification, which depends crucially on tem- perature variations, the sea-ice formation on the shelves, and wind-forcing [14, 15]. The exchange flow through FS shows a three-layer structure with a thin upper layer of low-salinity cold outflow from the Arctic Ocean, an intermediate inflow of saline and warmer water from the Atlantic Ocean below, and a cold bottom layer of Arctic origin. However, it is in contrast to the findings of previous studies [6, 54] which found a two-layer stratification using a Miocene bathymetry.
At the wider FS gateway, warmer Atlantic water flushes the intermediate depths and progressively mixed with the cold low-salinity upper ocean water and bottom layer. It
causes a gradual non-linear salinity increase (up to + 2 psu) and warming (up to + 1 K) in the Arctic Ocean. The flow of warm waters from the North Atlantic enters the Nordic Seas and Arctic Basin through FS, mostly between 200 m depth and the mixed layer (Figs. 2, 4), leading to substantial warm- ing in the Arctic Ocean [54]. This non-linear salinization process and warming control the stratification.
Elevated atmospheric CO2 enhances the Arctic freshwa- ter budget, warming (Supplementary Table 1), and a more accentuated halocline [3]. An intensified stratification is established by an enhanced atmospheric hydrological cycle with increased river runoff and net precipitation (precipita- tion minus evaporation) in the Arctic Ocean (Supplementary Table 1; [40]) that tends to freshen the relative fresh Arc- tic surface waters [3]. The lack of relatively saline inflow through the FS might also contribute to Arctic sea-surface freshening during the Miocene [54]. Below the Arctic fresh- water layer, there are the southern sourced North Atlantic waters, which cause an increase in salinity and temperature due to high evaporation in the low latitudes.
In the northern hemisphere, simulated annual sea-ice concentrations are significantly higher for large parts of the Arctic when FS was narrow and CO2 levels low (Sup- plementary Figures 3, 8), which was due to cooler mixed- layer temperatures in combination with weaker NADW for- mation [54]. Conversely, sea-ice decreases for a wider FS gateway and higher CO2 levels. A perennial Arctic sea-ice cover likely occurred from the middle Miocene onwards [40, 55–57]. These data are in contrast to geological analyses [35] that show ice-free warmer summer conditions in the Arctic Ocean during the middle-to-early late Miocene. Sea- ice proxy records suggest that Arctic sea-ice cover was mod- est between 17.5 and 16 Ma and more prevalent following and prior to this time period [58]. There is likely excessive Arctic sea-ice in our Miocene simulation [54].
The relatively short ventilation time is supported by the abrupt changes in sediment composition in the ACEX core analyses [8]. Although FS is fairly shallow and nar- row in our Miocene simulations, the resulting ventilation timescales seem to be shorter than or comparable to cor- responding estimates based on chemical tracer studies [59, 60] in the present-day Arctic Ocean. In general, the current model reproduces geological observations on the climate conditions of the Arctic Ocean. Our model simulations do not show dramatic changes in the global circulation pattern and global climate questioning the role of the FS in trigger- ing/enabling the Northern Hemisphere Glaciations (NHG) during early-to-middle Miocene. Several studies have pro- posed that the closure of the Panama Seaway [61, 62], a decline in atmospheric CO2 [63–65], and tectonic uplift of plateaus and mountains in the high northern latitudes [11]
are the important factors for the onset and intensification of the NHG during the Pliocene around 2.7 Ma [11, 66–68].
Conclusions
By means of an Earth System Model, we have qualitatively analysed the impact of FS opening in controlling ventila- tion of the Arctic Ocean during early-to-middle Miocene in different model experiments. We explore the role of the FS width and CO2 concentrations in the establishment of the modern-like stratification in the Arctic Ocean and exchange flow through FS. Our simulations show that a progressive widening of the FS causes unaltered salinity conditions and a mild warming in the Nordic Seas. Arctic water tempera- tures remain unaltered and salinity changes appear to stead- ily become stronger. For a sill depth at around 1500 m, we have achieved ventilation of the Arctic Ocean regime with an FS width of ~ 105 km. At this depth and width at around 105 km or more, we observe a modern-like three-layer strati- fication in the Arctic Ocean, with a shallow surface layer of cold and low-salinity water situated above a deep and warmer layer of Atlantic origin and a cold bottom layer. The exchange flow through FS also shows a three-layer structure.
The ventilation mechanisms and stratification in the Arctic Ocean simulated in our study using a significantly shallower and narrower FS during early Miocene are comparable to the present-day ocean basin. In general, our model repro- duces geological observations on the climate conditions of the Arctic Ocean. However, the simulations do not show dramatic changes in the global circulation pattern and global climate questioning the role of the FS in triggering/enabling the NHG.
In future studies, the presented framework might be a good tool to interpret high-resolution sediment records and data from up-coming drilling projects that target the past climate evolution in the North Atlantic–Arctic sector.
Acknowledgements This study is supported through institutional funds of the Alfred Wegener Institute Helmholtz Centre for Polar and Marine Research through Work Package 3.2 (Earth system on tectonic time scales: from greenhouse to icehouse world) of its research program PACES-II.
Author contributions AH set up and conducted the model experiments.
AH and GK developed the analysis concept. WJ, GL, and GK designed the project, and all authors conceived the research questions. AH led the write-up of the manuscript with significant contributions by the other authors. All authors interpreted and discussed the results and contributed to the preparation of the final manuscript.
Funding Open Access funding enabled and organized by Projekt DEAL.
Availability of data and materials Data from this study is available for further use at https ://doi.org/10.1594/PANGA EA.92675 8 and addi- tional data can be obtained from A.H. (akil.hossain@awi.de).
Compliance of ethical standards
Conflict of interest The authors declare no conflict of interest.
Ethical standard The authors comply with ethical standard.
Code availability The standard model code of the ‘COSMOS’ (Com- munity Earth System Models) version COSMOS-landveg r2413 is available upon request from the Max Planck Institute (MPI) for Mete- orology in Hamburg (https ://www.mpime t.mpg.de).
Open Access This article is licensed under a Creative Commons Attri- bution 4.0 International License, which permits use, sharing, adapta- tion, distribution and reproduction in any medium or format, as long as you give appropriate credit to the original author(s) and the source, provide a link to the Creative Commons licence, and indicate if changes were made. The images or other third party material in this article are included in the article’s Creative Commons licence, unless indicated otherwise in a credit line to the material. If material is not included in the article’s Creative Commons licence and your intended use is not permitted by statutory regulation or exceeds the permitted use, you will need to obtain permission directly from the copyright holder. To view a copy of this licence, visit http://creat iveco mmons .org/licen ses/by/4.0/.
References
1. Zachos JC, Dickens GR, Zeebe RE (2008) An early Cenozoic perspective on greenhouse warming and carbon-cycle dynamics.
Nature 451(7176):279–283. https ://doi.org/10.1038/natur e0658 8 2. Zachos J, Pagani M, Sloan L, Thomas E, Billups K (2001) Trends, rhythms, and aberrations in global climate 65 Ma to present. Sci- ence 292(5517):686–693. https ://doi.org/10.1126/scien ce.10594 3. Stärz M, Jokat W, Knorr G, Lohmann G (2017) Threshold in 12
North Atlantic-Arctic Ocean circulation controlled by the subsid- ence of the Greenland-Scotland Ridge. Nat Commun 8(1):1–3.
https ://doi.org/10.1038/ncomm s1568 1
4. von der Heydt A, Dijkstra HA (2006) Effect of ocean gateways on the global ocean circulation in the late Oligocene and early Miocene. Paleoceanography. https ://doi.org/10.1029/2005P A0011 5. Haley BA, Frank M, Spielhagen RF, Eisenhauer A (2008) Influ-49 ence of brine formation on Arctic Ocean circulation over the past 15 million years. Nat Geosci 1(1):68–72. https ://doi.org/10.1038/
ngeo.2007.5
6. Thompson B, Jakobsson M, Nilsson J, Nycander J, Döös K (2012) A model study of the first ventilated regime of the Arctic Ocean during the early Miocene. Polar Res 31(1):10859. https ://doi.
org/10.3402/polar .v31i0 .10859
7. Hossain A, Knorr G, Lohmann G, Stärz M, Jokat W (2020) Simu- lated thermohaline fingerprints in response to different Greenland- Scotland Ridge and Fram Strait subsidence histories. Paleocean- ogr Paleoclimatol. https ://doi.org/10.1029/2019P A0038 42 8. Jakobsson M, Backman J, Rudels B, Nycander J, Frank M,
Mayer L, Jokat W, Sangiorgi F, O’Regan M, Brinkhuis H, King J (2007) The early Miocene onset of a ventilated circulation regime in the Arctic Ocean. Nature 447(7147):986–990. https ://
doi.org/10.1038/natur e0592 4
9. Jokat W, Lehmann P, Damaske D, Nelson JB (2016) Magnetic signature of North-East Greenland, the Morris Jesup Rise, the Yermak Plateau, the central Fram Strait: constraints for the rift/
drift history between Greenland and Svalbard since the Eocene.
Tectonophysics 691:98–109. https ://doi.org/10.1016/j.tecto .2015.12.002
10. Ehlers BM, Jokat W (2013) Paleo-bathymetry of the northern North Atlantic and consequences for the opening of the Fram Strait. Mar Geophys Res 34(1):25–43. https ://doi.org/10.1007/
s1100 1-013-9165-9
11. Knies J, Mattingsdal R, Fabian K, Grøsfjeld K, Baranwal S, Husum K, De Schepper S, Vogt C, Andersen N, Matthiessen J, Andreassen K (2014) Effect of early Pliocene uplift on late Plio- cene cooling in the Arctic-Atlantic gateway. Earth Planet Sci Lett 387:132–144. https ://doi.org/10.1016/j.epsl.2013.11.007 12. Driscoll NW, Haug GH (1998) A short circuit in thermohaline
circulation: a cause for northern hemisphere glaciation? Science 282:436–438. https ://doi.org/10.1126/scien ce.282.5388.436 13. Kristoffersen Y (1990) On the tectonic evolution and paleocean-
ographic significance of the Fram Strait gateway. In: Bleil U, Thiede J (eds) Geological history of the Polar Oceans: Arctic versus Antarctic. Kluwer Academic Publishers, Dordrecht, pp 63–76. https ://doi.org/10.1007/978-94-009-2029-3_4
14. Rudels B (1995) The thermohaline circulation of the Arctic Ocean and the Greenland Sea. Philos Trans Phys Sci Eng 352:287–299.
https ://doi.org/10.1098/rsta.1995.0071
15. Rudels B, Björk G, Nilsson J, Winsor P, Lake I, Nohr C (2005) The interaction between waters from the Arctic Ocean and the Nordic Seas north of Fram Strait and along the East Green- land current: results from the Arctic Ocean-02 Oden expedi- tion. J Mar Syst 55(1–2):1–30. https ://doi.org/10.1016/j.jmars ys.2004.06.008
16. Roeckner E, Bäuml G, Bonaventura L, Brokopf R, Esch M, Gior- getta M, Hagemann S, Kirchner I, Kornblueh L, Manzini E, Rho- din A (2003) The atmospheric general circulation model ECHAM 5. PART I: Model description. Report/MPI für Meteorologie, pp 349. http://hdl.handl e.net/11858 /00-001M-0000-0012-0144-5 17. Marsland SJ, Haak H, Jungclaus JH, Latif M, Röske F (2003) The
Max-Planck-Institute global ocean/sea ice model with orthogonal curvilinear coordinates. Ocean Model 5(2):91–127. https ://doi.
org/10.1016/S1463 -5003(02)00015 -X
18. Raddatz TJ, Reick CH, Knorr W, Kattge J, Roeckner E, Schnur R, Schnitzler KG, Wetzel P, Jungclaus J (2007) Will the tropical land biosphere dominate the climate–carbon cycle feedback dur- ing the twenty-first century? Clim Dyn 29(6):565–574. https ://doi.
org/10.1007/s0038 2-007-0247-8
19. Jungclaus JH, Keenlyside N, Botzet M, Haak H, Luo JJ, Latif M, Marotzke J, Mikolajewicz U, Roeckner E (2006) Ocean circu- lation and tropical variability in the coupled model ECHAM5/
MPI-OM. J Clim 19(16):3952–3972. https ://doi.org/10.1175/
JCLI3 827.1
20. Knorr G, Butzin M, Micheels A, Lohmann G (2011) A warm Miocene climate at low atmospheric CO2 levels. Geophys Res Lett. https ://doi.org/10.1029/2011G L0488 73
21. Knorr G, Lohmann G (2014) Climate warming during Antarctic ice sheet expansion at the Middle Miocene transition. Nat Geosci 7(5):376. https ://doi.org/10.1038/ngeo2 119
22. Huang X, Stärz M, Gohl K, Knorr G, Lohmann G (2017) Impact of Weddell Sea shelf progradation on Antarctic bottom water for- mation during the Miocene. Paleoceanography 32(3):304–317.
https ://doi.org/10.1002/2016P A0029 87
23. Stepanek C, Lohmann G (2012) Modelling mid-Pliocene climate with COSMOS. Geosci Model Dev 5:1221–1243. https ://doi.
org/10.5194/gmd-5-1221-2012
24. Zhang X, Lohmann G, Knorr G, Xu X (2013) Different ocean states and transient characteristics in Last Glacial
Maximum simulations and implications for deglaciation. Clim Past 9(5):2319–2333. https ://doi.org/10.5194/cp-9-2319-2013 25. Stärz M, Lohmann G, Knorr G (2016) The effect of a dynamic soil
scheme on the climate of the mid-Holocene and the Last Glacial Maximum. Clim Past. https ://doi.org/10.5194/cp-12-151-2016 26. Wei W, Lohmann G (2012) Simulated Atlantic multidecadal oscil-
lation during the Holocene. J Clim 25(20):6989–7002. https ://doi.
org/10.1175/JCLI-D-11-00667 .1
27. Lohmann G, Pfeiffer M, Laepple T, Leduc G, Kim JH (2013) A model-data comparison of the Holocene global sea surface temperature evolution. Clim Past 9:1807–1839. https ://doi.
org/10.5194/cp-9-1807-2013
28. Jungclaus JH, Lorenz SJ, Timmreck C, Reick CH, Brovkin V, Six K, Segschneider J, Giorgetta MA, Crowley TJ, Pongratz J, Krivova NA (2010) Climate and carbon-cycle variability over the last millennium. Clim Past 6:723–737. https ://doi.org/10.5194/
cp-6-723-2010
29. Butt FA, Drange H, Elverhøi A, Otterå OH, Solheim A (2002) Modelling Late Cenozoic isostatic elevation changes in the Bar- ents Sea and their implications for oceanic and climatic regimes:
preliminary results. Quat Sci Rev 21(14–15):1643–1660. https ://
doi.org/10.1016/S0277 -3791(02)00018 -5
30. Hutchinson DK, Coxall HK, O’Regan M, Nilsson J, Caballero R, de Boer AM (2019) Arctic closure as a trigger for Atlantic overturning at the Eocene-Oligocene Transition. Nat Commun 10(1):1–9. https ://doi.org/10.1038/s4146 7-019-11828 -z 31. Pratt LJ, Spall MA (2008) Circulation and exchange in choked
marginal seas. J Phys Oceanogr 38(12):2639–2661. https ://doi.
org/10.1175/2008J PO394 6.1
32. Beerling DJ, Royer DL (2011) Convergent cenozoic CO2 his- tory. Nat Geosci 4:418–420. https ://doi.org/10.1038/ngeo1 186 33. Pagani M, Huber M, Liu Z, Bohaty SM, Henderiks J, Sijp
W, Krishnan S, DeConto RM (2011) The role of carbon dioxide during the onset of Antarctic glaciation. Science 334(6060):1261–1264. https ://doi.org/10.1126/scien ce.12039 09 34. Pagani M, Zachos JC, Freeman KH, Tipple B, Bohaty S (2005)
Marked decline in atmospheric carbon dioxide concentrations during the Paleogene. Science 309(5734):600–603. https ://doi.
org/10.1126/scien ce.11100 63
35. Stein R, Jokat W, Niessen F, Weigelt E (2015) Exploring the long-term Cenozoic Arctic Ocean Climate History—a challenge within the International Ocean Discovery Program (IODP).
Arktos. https ://doi.org/10.1007/s4106 3-015-0012-x
36. Jokat W, Geissler W, Voss M (2008) Basement structure of the north-western Yermak Plateau. Geophys Res Lett. https ://doi.
org/10.1029/2007G L0328 92
37. Hegewald A, Jokat W (2013) Relative sea level variations in the Chukchi region-Arctic Ocean-since the late Eocene. Geophys Res Lett 40(5):803–807. https ://doi.org/10.1002/GRL.50182 38. Engen Ø, Faleide JI, Dyreng TK (2008) Opening of the Fram
Strait gateway: a review of plate tectonic constraints. Tec- tonophysics 450(1–4):51–69. https ://doi.org/10.1016/j.tecto .2008.01.002
39. Myhre AM, Thiede J, Firth JV, Ahagon N, Black KS, Bloemendal J, Brass GW, Bristow JF, Chow N, Cremer M, Davis L (1995) Site 909. In: Proceedings of the ocean drilling program. Initial reports 1995, vol 151. Ocean Drilling Program, pp 159–220
40. Moran K, Backman J, Brinkhuis H, Clemens SC, Cronin T, Dickens GR, Eynaud F, Gattacceca J, Jakobsson M, Jordan RW, Kaminski M et al (2006) The cenozoic palaeoenvironment of the arctic ocean. Nature 441(7093):601–605. https ://doi.org/10.1038/
natur e0480 0
41. Straume EO, Gaina C, Medvedev S, Nisancioglu KH (2020) Global Cenozoic Paleobathymetry with a focus on the North- ern Hemisphere Oceanic Gateways. Gondwana Res. https ://doi.
org/10.1016/j.gr.2020.05.011
42. Goldner A, Herold N, Huber M (2014) The challenge of simulat- ing the warmth of the Mid-Miocene Climatic Optimun in CESM1.
Clim Past 10:523–536. https ://doi.org/10.5194/cp-10-523-2014 43. Weller P, Stein R (2008) Paleogene biomarker records from the
central Arctic Ocean (IODP Expedition 302): organic-carbon sources, anoxia, and sea-surface temperature. Paleoceanography 23:PA1S17. https ://doi.org/10.1029/2007P A0014 72
44. Waddell LM, Moore TC (2008) Salinity of the Eocene Arctic Ocean from oxygen isotope analysis of fish bone carbonate. Pale- oceanography. https ://doi.org/10.1029/2007P A0014 51
45. Stein R, Fahl K, Schreck M, Knorr G, Niessen F, Forwick M, Gebhardt C, Jensen L, Kaminski M, Kopf A, Matthiessen J (2016) Evidence for ice-free summers in the late Miocene central Arctic Ocean. Nat Commun 7(1):1–3. https ://doi.org/10.1038/ncomm s1114 8
46. USEPA (United States Environmental Protection Agency) (2016) Climate change indicators: sea surface temperature. https ://www.
epa.gov/clima te-indic ators /clima te-chang e-indic ators -sea-surfa ce-tempe ratur e#ref8. Accessed 11 Nov 2020
47. IPCC (Intergovernmental Panel on Climate Change) (2013) Cli- mate change 2013: the physical science basis. Working Group I contribution to the IPCC Fifth Assessment Report. Cambridge University Press, Cambridge. https ://www.ipcc.ch/repor t/ar5/
wg1/. Accessed 11 Nov 2020
48. NASA (2020) Carbon dioxide. https ://clima te.nasa.gov/vital -signs /carbo n-dioxi de/. Accessed 11 Nov 2020
49. GISS (Goddard Institute for Space Studies) (2020) Global mean CO2 mixing ratios (ppm): observations. http://data.giss.nasa.gov/
model force /ghgas es/Fig1A .ext.txt/. Accessed 11 Nov 2020 50. Björk G, Jakobsson M, Rudels B, Swift JH, Anderson L, Darby
DA, Backman J, Coakley B, Winsor P, Polyak L, Edwards M (2007) Bathymetry and deep-water exchange across the central Lomonosov Ridge at 88–89 N. Deep Sea Res Part I Oceanogr Res Pap 54(8):1197–1208. https ://doi.org/10.1016/j.dsr.2007.05.010 51. Held IM, Soden BJ (2006) Robust response of the hydrologi-
cal cycle to global warming. J Clim 19:5686–5699. https ://doi.
org/10.1175/JCLI3 990.1
52. Knies J, Gaina C (2008) Middle Miocene ice sheet expansion in the Arctic: Views from the Barents Sea. Geochem Geophys Geosyst. https ://doi.org/10.1029/2007G C0018 24
53. Thompson B, Nilsson J, Nycander J, Jakobsson M, Döös K (2010) Ventilation of the Miocene Arctic Ocean: an idealized model study. Paleoceanography. https ://doi.org/10.1029/2009P A0018 83 54. Herold N, Huber M, Müller RD, Seton M (2012) Modelling the
Miocene climatic optimum. Part 2: ocean circulation. Paleocean- ography. https ://doi.org/10.1029/2010P A0020 41
55. Woodruff F, Savin SM (1989) Miocene deepwater oceanography.
Paleoceanography 4(1):87–140. https ://doi.org/10.1029/PA004 i001p 00087
56. Darby DA (2008) Arctic perennial ice cover over the last 14 million years. Paleoceanography 23:PA1S07. https ://doi.
org/10.1029/2007P A0014 79
57. Krylov AA, Andreeva IA, Vogt C, Backman J, Krupskaya VV, Grikurov GE, Moran K, Shoji HA (2008) shift in heavy and clay mineral provenance indicates a middle Miocene onset of a perennial sea ice cover in the Arctic Ocean. Paleoceanography 23:PA1S06. https ://doi.org/10.1029/2007P A0014 97
58. St John K (2008) Cenozoic ice-rafting history of the central Arctic Ocean: Terrigenous sands on the Lomonosov Ridge. Paleocean- ography 23:PA1S05. https ://doi.org/10.1029/2007P A0014 83 59. Schlosser P, Kromer B, Ekwurzel B, Bönisch G, McNichol A,
Schneider R, Von Reden K, Östlund HG, Swift JH (1997) The first trans-Arctic 14C section: comparison of the mean ages of the deep waters in the Eurasian and Canadian basins of the Arctic Ocean.
Nucl Instrum Methods Phys Res Sect B 123(1–4):431–437 60. Tanhua T, Jones EP, Jeansson E, Jutterström S, Smethie WM
Jr, Wallace DW, Anderson LG (2009) Ventilation of the Arctic Ocean: mean ages and inventories of anthropogenic CO2 and CFC-11. J Geophys Res Oceans 114(C01002):1–11. https ://doi.
org/10.1029/2008J C0048 68
61. Marshall LG, Webb SD, Sepkoski JJ, Raup DM (1982) Mam- malian evolution and the great American interchange. Science 215:1351–1357
62. Webb SD (2006) The great American biotic interchange: patterns and processes. Ann Mo Botan Gard 93:245–257
63. Lunt DJ, Foster GL, Haywood AM, Stone EJ (2008) Late Pliocene Greenland glaciation controlled by a decline in atmospheric CO2 levels. Nature 454(7208):1102–1105
64. Bartoli G, Sarnthein M, Weinelt M, Erlenkeuser H, Garbe- Schönberg D, Lea DW (2005) Final closure of Panama and the onset of northern hemisphere glaciation. Earth Planet Sci Lett 237(1–2):33–44
65. Seki O, Foster GL, Schmidt DN, Mackensen A, Kawamura K, Pancost RD (2010) Alkenone and boron-based Pliocene pCO2 records. Earth Planet Sci Lett 292(1–2):201–211
66. Haug GH, Tiedemann R, Zahn R, Ravelo AC (2001) Role of Pan- ama uplift on oceanic freshwater balance. Geology 29(3):207–210 67. Lear CH, Rosenthal Y, Wright JD (2003) The closing of a seaway:
ocean water masses and global climate change. Earth Planet Sci Lett 210:425–436
68. Ruddiman WF (2010) A paleoclimatic enigma? Science 328(5980):838–839
Publisher’s Note Springer Nature remains neutral with regard to jurisdictional claims in published maps and institutional affiliations.
![Table 1) that are within a broad range of reported CO 2 levels representative for the Eocene–Miocene time period [32–34].](https://thumb-eu.123doks.com/thumbv2/1library_info/5201386.1668142/3.892.267.814.89.336/table-broad-reported-levels-representative-eocene-miocene-period.webp)