Research Collection
Journal Article
On the importance of nitrate for the droplet concentration in stratocumulus in the North-Sea region
Author(s):
Crumeyrolle, Suzanne; Mensah, Amewu A.; Khlystov, Andrey; Kos, Gerard; ten Brink, Harry Publication Date:
2021-05-01 Permanent Link:
https://doi.org/10.3929/ethz-b-000474400
Originally published in:
Atmospheric Environment 252, http://doi.org/10.1016/j.atmosenv.2021.118278
Rights / License:
Creative Commons Attribution-NonCommercial-NoDerivatives 4.0 International
This page was generated automatically upon download from the ETH Zurich Research Collection. For more information please consult the Terms of use.
ETH Library
Atmospheric Environment 252 (2021) 118278
Available online 3 March 2021
1352-2310/© 2021 The Author(s). Published by Elsevier Ltd. This is an open access article under the CC BY-NC-ND license
(http://creativecommons.org/licenses/by-nc-nd/4.0/).
On the importance of nitrate for the droplet concentration in stratocumulus in the North-Sea region
Suzanne Crumeyrolle
a, Amewu Mensah
b, Andrey Khlystov
c, Gerard Kos
d, Harry ten Brink
d,*aUniv. Lille, CNRS, UMR 8518, Laboratoire d’Optique Atmosph´erique (LOA), 59000, Lille, France
bInstitute of Atmospheric and Climate Science (IAC), ETH, Zurich, Switzerland
cDesert Research Institute DRI, Reno, NV, USA
dEnergy-research Centre of the Netherlands (ECN Part of TNO), 1755ZG, Petten, the Netherlands
H I G H L I G H T S
•The CCN over the North Sea are dominated by non-seasalt submicron particles.
•Nitrate is the dominant CCN-compound in the most frequent SW air masses.
•In summer nitrate is absent in the most numerous small CCN.
•In air masses directly from the Atlantic submicron nitrate is absent.
A R T I C L E I N F O Keywords:
Nitrate Clouds Droplet number Activation Cloud chamber MARGA-Sizer
A B S T R A C T
Anthropogenic aerosol particles serve as extra Cloud Condensation Nuclei (CCN), increasing the cloud droplet number concentration and modifying the cloud properties. The influence of manmade aerosol is the highest in a marine environment due to a limited number of natural CCN. Marine stratocumulus-like clouds (MSC) are the most frequent cloud-type in the North Sea region. The general assumption is that sulphate is the dominant compound of the CCN. However, high levels of manmade nitrate in the area suggest a significant role for this component. We made a first assessment of how many CCN with a marine origin were dominated by nitrate via two intensive campaigns in a large flow-through cloud chamber at the coast in the Netherlands wherein the formation of stratocumulus is simulated. It was consistently observed that the CCN were virtually all in the submicron range. In marine air masses from the NW-quadrant submicron nitrate was negligible and sulphate was the dominant CCN-component; this was also the case in air masses that passed over the narrow corridor of the English Channel. In air masses from the SW quadrant, climatologically the most frequent air mass with stratus- like overcast, submicron-nitrate was the dominant compound apparently produced from sources located over southern UK and W-France/Belgium. The CCN were mostly (98%) in the size range of 100–450 nm. During the summer campaign (2007), nitrate was virtually absent in the smaller and more numerous CCN in this size range.
During a, shorter, study in the first half of April (2009), all CCN were dominated by nitrate. This possible sea- sonal difference in the role of nitrate in SW-air was the main subject evaluated in a monitoring effort in 2008 with a total of 7 months of valid data. The mass concentration ratio of nitrate to sulphate in the “CCN”-range (the range in which 85% of the CCN number concentration is present) was used to identify the periods when nitrate was the prominent compound. In winter/early spring CCN-nitrate was the dominant compound in the CCN, while during summer the ratio of CCN-nitrate to CCN-sulphate was 0.2 and close to zero in the CCN with a diameter smaller than 150 nm. This seasonal difference can be explained by the low stability of the semi-volatile ammonium nitrate at the elevated temperatures in summer, which specifically applies for the smallest CCN due to their small mass amounts. Further data are required to obtain a reliable climatology. Note: sea salt contributed negligibly to the CCN-number; organic aerosol, measured in the April campaign, was present in significant concentrations but of minor importance because of its low hygroscopicity.
* Corresponding author.
E-mail addresses: suzanne.crumeyrolle@univ-lille.fr (S. Crumeyrolle), htenbrink48@hotmail.com (H. ten Brink).
Contents lists available at ScienceDirect
Atmospheric Environment
journal homepage: http://www.elsevier.com/locate/atmosenv
https://doi.org/10.1016/j.atmosenv.2021.118278
Received 14 May 2020; Received in revised form 12 February 2021; Accepted 19 February 2021
Atmospheric Environment 252 (2021) 118278
2 1. Introduction
Atmospheric aerosols affect cloud formation through their role as Cloud Condensation Nuclei (CCN). Extra CCN in the form of manmade aerosol particles modify clouds macro- and micro-properties, such as cloud albedo, residence time and precipitation rate [Boucher et al., 2013; Seinfeld et al., 2016]. To date, this Aerosol-Cloud Interaction ef- fect (ACI) is the most uncertain of the climate effects. Since the number concentration of natural cloud condensation nuclei (CCN) is low in marine stratocumulus, an increase of additional anthropogenic CCN makes a significant difference. This effect should be therefore especially prominent in coastal marine regions with nearby anthropogenic aerosol sources, like the North Sea.
Marine stratocumulus (MSC) is globally the most common cloud type and also in the North Sea region [Wood, 2012]. Together with stratus, it covers the North Sea nearly 50% of the time [Duynkerke, 1988]. MSC generally forms in the form of a field at the top of the planetary boundary layer. Assuming a well-mixed boundary layer, these clouds are effectively influenced by anthropogenic aerosols. MSC has imbedded patches of thicker clouds caused by convection/turbulence in distinction to the more stable stratus.
In literature, anthropogenic sulphate is considered to be the main component of cloud condensation nuclei (Boucher et al., 2013). How- ever, the anthropogenic sulphate concentration is rapidly declining in the North-Sea region due to a decrease in SO2 emissions (precursor of SO4) in the countries bordering and over the North Sea [Aulinger et al., 2016; EMEP, 2016], while nitrate is at present the dominant compound and is decreasing at a lesser rate [Tørseth et al., 2012; Weijers et al.
(2011). According to models [e.g., Bellouin et al., 2011], the importance of the regional Aerosol Cloud Interaction (ACI) will decrease but at a much lower rate than previously projected because nitrate will take over the role of dominant CCN-compound in the course of this century. Yet, measurements in MSC over the southern North Sea showed a very low importance of nitrate relative to sulphate [Crumeyrolle et al., 2013].
To better understand the influence of nitrate on CCN formation, Khlystov (1998) investigated the size-distribution of the CCN in marine air within the Petten cloud chamber in the Netherlands. Virtually all CCN diameter were smaller than 0.5 μm. Aerosol chemical composition was determined in samples collected with manual cascade impactors over long sampling periods. The few results gave an indication that in air masses from the NW the nitrate concentration was very small relative to that of sulphate in the CCN range provisionally defined as aerosol with an aerodynamic diameter <300 nm. While in air masses form the SW, the CCN-nitrate concentration was close to the sulphate concentration, suggesting a possible equivalent role as CCN-compound. An issue with the above measurements is that classical impactor measurements un- derestimate the concentration of small nitrate due to evaporative losses.
For that reason, in the present study artefact-free instrumentation was used to measure the nitrate mass concentration as a function of size that in addition was automated so that a large data-set was obtained.
The specific aim of this study is to assess the ratio of nitrate to sul- phate within the size-range in which at least 85% of the CCN reside. The cloud chamber campaign occurred during spring (1 week) and summer (few weeks) when the increase in cloud reflectivity of solar energy is maximised at the latitude of the North Sea. In the well-mixed boundary layer in which MSC is formed, the aerosol particles probed at ground- level in the cloud chamber are the same as those serving as CCN in the actual clouds. The CCN size-range and the aerosol chemical speci- ation was experimentally determined using measurements in the large flow-through cloud chamber. The cloud chamber used is rather unique because the typical microstructure of MSC is successfully simulated, as demonstrated in subsection 2.1.
2. Experimental
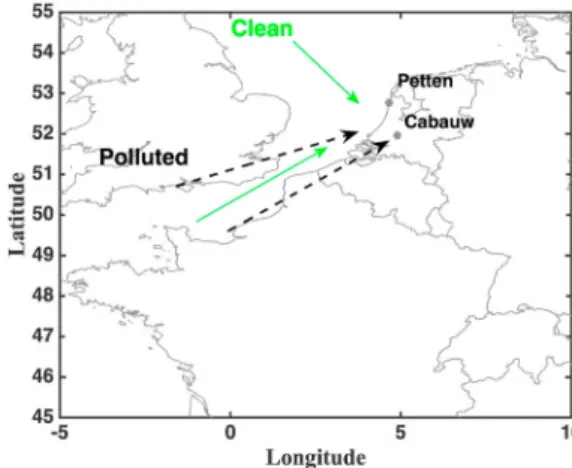
The cloud chamber is in Petten while the year-long monitoring study
took place at Cabauw, in 2008 (Fig. 1). The reason was that this is the central monitoring site in the Netherlands also for the EUCAARI pro- gram on the effect of aerosol on clouds and radiation [Kulmala et al., 2011]. There are also monitoring data in conjunction with the cloud chamber campaigns in summer 2007 and April 2009 (see Table 1).
2.1. Cloud chamber and physical instrumentation
The large cloud chamber (21 m3) is located in a large hall at the ECN- institute in Petten (Fig. 1). It is described in detail by Khlystov [1998]
and Khlystov et al., [1996a]; see section S1 of the Supplementary Ma- terial for appreciation of its size and sketch of the flow scheme. The cloud chamber was operated during two intensive campaigns in summer 2007 (3 weeks) and April 2009 (9 days). We briefly summarise the route the air follows. The air is drawn in from above the roof by a large ventilator at which location the (ambient) aerosol properties are char- acterised before entering the actual cloud chamber system. This set up includes a Scanning Mobility Particle Sizer (SMPS, TSI-DMA 3071 coupled with TSI CPC 3020) and a LAS-X (PMS Inc.) optical particle counter to measure the aerosol size distribution from 10 nm to 5 μm.
Then, the air parcel is humidified and warmed in the entrance channel.
The warmed and humidified air arrives in the cloud chamber where it cools due to contact with the cooler walls. The excess water condenses on particles of which the size and composition allows them to serve as cloud condensation nuclei. The air leaves the chamber via a measuring tunnel/channel in which the Cloud Droplet Number Concentration (CDNC) and size distribution are measured. The Liquid Water Content (LWC) of the cloud was monitored with a LWC meter (PVM100).
Number concentration and size of the droplets were determined with a Forward Scattering Spectrometer Probe (FSSP), also used by Khlystov et al., [1996b].
Part of the exhaust air is withdrawn from the outlet tunnel through a PM2.5 cyclone in which the droplets are removed while non-activated aerosols (i.e., interstitial aerosol) remain in the air-flow. The air is subsequently dried by mixing in with dry particle-free air to remove water taken up by interstitial aerosols in the chamber. Interstitial aerosols are then guided to another SMPS (same model and settings) and then along a 2-way valve. This valve alternatingly samples interstitial and ambient air and the composition is assessed by a chemical size- composition analyser (MARGA-sizer or AMS, section 2.2).
The differences in the properties between ambient and interstitial aerosol is due to the removal of those particles that served as CCN and these differences define the characteristics of the CCN. Losses of aerosol in the system were checked by running the cloud chamber at high RH (approaching saturation) for a period of 3 weeks. It was consistently observed that ambient and interstitial aerosol properties were similar
Fig. 1.Petten and Cabauw locations as well as distinction in the main air mass flows reaching the sites (“Clean”: NW flows and air masses passing over English Channel; “Polluted”: SW flows, based on N100, see text).
S. Crumeyrolle et al.
implying that aerosol losses in the whole of the system were negligible.
Moreover, the cloud chamber efficiency to reproduce CD properties was successfully tested through comparison to simultaneous airborne ob- servations in marine stratocumulus [Khlystov et al., 1999; Khlystov, 1998].
Two campaigns were carried out; one in the summer of 2007, pre- ceding the yearlong monitoring campaign of 2008 and one after this effort in the first half of April 2009.
2.2. Monitoring campaign
The monitoring campaign was performed in 2008 concurrently with the EUCAARI project, at the meteo-tower of Cabauw in the west of the Netherlands [Mensah et al., 2012]. In essence the concentration of ni- trate, sulphate and sodium within several submicron size-classes was measured. The CCN size range in which, at least 85% of the CCN resided, was assessed from the detailed measurements of the number and size distribution of the CCN in the cloud chamber.
2.3. Chemical composition measurements
The size-dependent ionic composition of the aerosols was deter- mined with a “MARGA-sizer”. The MARGA-sizer as used in monitoring has been described in detail before [ten Brink et al., 2007; ten Brink et al., 2018]. Here only aspects relevant for the cloud chamber study will be presented. The aerosol is classified in five size channels but only the three smallest submicron size-fractions were used corresponding to the following approximate mobility diameters: 0.15, 0.25 and 0.45 μm. A measuring cycle, including two blanks and measurement of the con- centration of ionic gases, took 2 h. The performance of the MARGA-sizer was checked prior and after the summer campaign. It was noticed after the campaign that a fraction (about 7%) of the particles with a size larger than the cut-off diameter passed through the 150 nm impactor. This interference is an issue due to low mass concentration in this bin. The implications will be addressed in section 3.1.
The detection limit for nitrate was 15 ng m−3; respectively 30 ng m−3 for sulphate and sodium. The uncertainty associated with the ambient and respectively interstitial aerosol concentration difference was hence 20 ngm−3 for nitrate and 40 ng m−3 for other ions. Since only one MARGA-sizer unit was available, the interstitial aerosol chemical composition was measured 2 h after the ambient aerosol chemical composition. Therefore, to compare ambient and interstitial aerosol composition, we used periods for which the aerosol characteristics were rather stable over a 4-h period. This was based on low variations of ambient aerosol mass/volume concentration derived from the entire size-distribution (SMPS and LAS-X).
During the monitoring campaign, the full range of the MARGA-sizer
was used, including the two channels with aerodynamic cut-off di- ameters of respectively 1 and 2 μm. The detection limit, governed by variations in the blank, differed from batch to batch of the eluence of the chromatograph, as observed in earlier monitoring [ten Brink et al., 2009]. Therefore, the detection limit differed from period to period as further discussed in section 3.2. Further details of sampling routine and performance are given in Mensah et al., [2012] and ten Brink et al., [2018]. In addition, a classical MARGA measured the concentration of coarse PM10 sodium (Na) as a tracer for marine air.
In the cloud chamber study of April 2009 an AMS (Aerodyne Research Inc.) was present with which the detailed submicron mass concentration of nitrate, sulphate and also organics as a function of diameter was measured, with a detection limit of approximately 80 ng m−3. With this instrument the composition of the CCN as a detailed function of size was determined. The switching frequency of the AMS between ambient and interstitial aerosol measurements was about 4 min. Therefore, almost simultaneous compositional spectra were ob- tained for ambient and interstitial aerosols. A full description of the instrument used is given in Mensah et al. (2012). The MARGA-sizer (only) measured ambient aerosol; the comparability with the AMS-data was similar to that reported for the intercomparison at Cab- auw [Mensah et al., 2012]. A classical MARGA measured the coarse Na as marine tracer.
3. Results and discussion
In this section, results from the studies in the cloud chamber will be first explored to classify the CCN-range and to determine the number fraction of CCN dominated by nitrate in marine air with different ori- gins. These results will then be used to evaluate the data obtained in the long-term monitoring measurements, discussed in section 3.2.
3.1. Cloud chamber studies
In the cloud chamber, the CCN size distribution was assessed during the short campaigns (summer campaign/IOP and April 2009). A general finding was that the CCN were almost completely in the submicron diameter range, consistently to earlier study results [Khlystov, 1998].
We will discuss in details the results first for clean (NW flows) and then polluted (SW flows) air masses, characterised via N100 (the concentra- tion of particles with a diameter larger than 100 nm). Indeed, clean air masses can be considered as approaching a situation with natural CCN only [Khlystov, 1998].
3.1.1. Summer campaign/IOP (2007)
The summer campaign was conducted in June to mid-August 2007 with detailed data during the IOP (Intensive Operating Period) from 27 July to 16 August. Fig. 2 shows time series of the main parameters observed during the IOP: sulphate and nitrate (a, Dp <450 nm) mass concentrations, wind direction (b), number concentrations of aerosol particles with a diameter larger than 100 nm (c, N100), a wind rose (d), the cloud droplet number concentration (e) and the cloud cover (f). This N100 was used as an indicator of the air-mass degree of pollution as in the earlier study of Khlystov [1998]. It can be noticed that the nitrate concentration has a higher variability than that of sulphate. Moreover, there were relatively long periods during which the nitrate concentra- tion was at or below its detection limit of 15 ng m−3 while sulphate concentration was consistently well above the lower detection limit.
The wind direction (Fig. 2b) was derived from data at a nearby airfield [KNMI, 2020] and coupled to multiday HYSPLIT back-trajectories in order to determine the air mass origin. One can see (Fig. 2b and c) that air masses coming from the NW (green area: clean period) are associated with a low value of N100 and nitrate, while in air coming from the SW (grey area: polluted period) N100 can be twenty times higher. One can note that all the parameters show a strong vari- ation according to clean or polluted periods.
Table 1
Overview of the measuring efforts, parameters measured/instrumentation, with lead instrument tabulated first.
Measured
parameter Instrument Cloud Chamber Cabauw
monitoring
2007 2009 2008
Chemical composition distribution
MARGA-
sizer Ambient and interstitial (IOP only)
Ambient
AMS Ambient Ambient
and interstitial
PM10 Na MARGA Ambient Ambient Ambient
Aerosol size distribution Cloud droplets
SMPS Ambient and
interstitial (IOP only) LAS-X Ambient
FSSP Ambient
LWC PVM-See Ambient Ambient
Atmospheric Environment 252 (2021) 118278
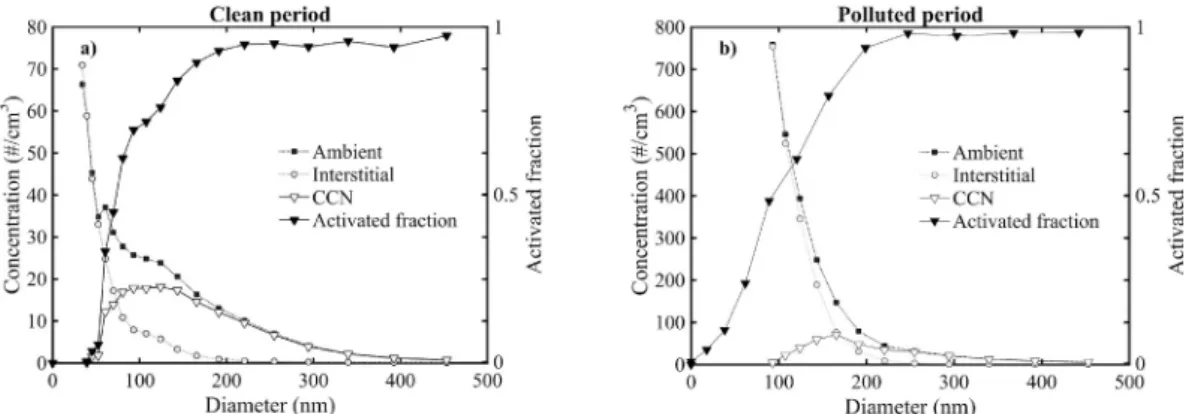
4 During clean periods (29–30 July and 8–11 August), the nitrate mass concentration was at or close to the detection limit of 15 ng m−3 while the sulphate concentration was significantly higher and reached 1 μg m−3 consistent with actual stratocumulus observed over the North-Sea (Crumeyrolle et al., 2013). Moreover, these periods are associated with high cloud coverage, around 6 on average (Fig. 2f, last days of July and 8–11 August) and low CDNC (Fig. 2e, below 300 cm−3) reaching a minimum of 175 cm−3, on 29 and 30 July. Because of the low aerosol number concentration, ambient and interstitial aerosol size distributions were averaged over the whole period from 29 to 30 July (Fig. 3a). By subtracting the interstitial (blue) from ambient aerosol spectrum (red), the CCN size distribution is obtained (green). The smallest bins of the CCN spectrum are rather uncertain due to the subtraction of two large values. The CCN size distribution is mono-modal with a broad maximum centred at 120 nm. The total CCN number concentration (180 cm−3) is in
good agreement with the CDNC (175 cm−3) observed simultaneously as shown in Fig. 2e and consistent with previous observations in marine air at Mace Head [Yoon et al., 2007]. One can also note that the activation threshold, diameter at which 50% of the particles activate, is around 75 nm (Fig. 3a) and thereby very similar to that observed at the cloud observatory station Jungfraujoch for NW air masses during summer [Hammer et al., 2014], corresponding to a peak supersaturation of 0.25%. It should be mentioned that some ambient particles (3 cm−3) larger than 450 nm were present as assessed with the optical probe which certainly must have acted as CCN, given their size. Similar con- clusions can be drawn from the observations performed during the second clean period (8–11 August) but at higher concentrations.
During polluted periods (grey areas), nitrate is present at elevated but highly variable levels. For instance, from July 31st to August 2nd the nitrate concentration became measurable and reached a peak of 3.5 μg Fig. 2. Mass concentration of nitrate and sulphate for particles with diameter below 450 nm (a), wind direction (b, in degrees), number concentration of particles with a diameter larger than 100 nm (c, N100), wind rose of N100 and local wind direction (d), Cloud Droplet Number Concentration (e, CDNC) and Cloud cover (f) observed during the summer campaign in 2007. The grey and green areas correspond to air masses coming from the South-west and North-west, respectively. (For interpretation of the references to colour in this figure legend, the reader is referred to the Web version of this article.)
S. Crumeyrolle et al.
m−3, while on 27–29 July it was at or close to the detection limit. This variability of the nitrate concentration could be explained by only slightly different HYSPLIT 72-hr back-trajectories: (i) over the Southern part of the UK and or W-France/Belgium associated with high nitrate concentrations, (ii) passing over the English Channel through a narrow corridor (Fig. 1), with virtual absence of the compound. We focus on polluted periods and specifically that of July 31st to August 2nd, in view of the subject of the present study and the dominance of air masses travelling over land from the SW versus that via the narrow corridor of the English Channel.
The ambient and interstitial aerosol size distributions, averaged over the night of 1–2 August, is presented in Fig. 3b. Similar to the clean period, the CCN spectra is obtained by subtracting the interstitial (blue) from ambient aerosol spectrum (red, Fig. 3b). The CCN size distribution has a maximum around a diameter of 170 nm. The difference in ambient
aerosol and CCN spectra allowed us to calculate the aerosol activated number fraction, also shown in the figure. Essentially all particles with a diameter between 250 and 450 nm serve as CCN and this corresponds to about 15% of the total CCN number. There are few CCN with larger diameter than 450 nm that represent around 1% of the total CCN playing therefore a minor role.
The activation threshold is around 165 nm (Fig. 3b) and therefore twice bigger than during the clean period (Fig. 3a). This difference can be partly explained by the extra number of larger particles that activate.
However there is an additional more important phenomenon. After initial activation of the large particles, condensation of water vapour on these droplets slows down the increase of the supersaturation and a relatively a low maximum supersaturation is reached corresponding to the mentioned activation threshold. This also explains the onlt twofold increase in droplet number concentration, from 175 to 350 cm-3, versus Fig. 3.Average aerosol size distribution of ambient and interstitial aerosols observed within clean (a, averaged from 29 to July 31, 2007) and polluted (b, averaged from 1 to 2 August 2007) air masses. The CCN size distribution was estimated by difference between ambient and interstitial size distributions. The total cloud droplet number concentration was less than 200 cm−3, see Fig. 3a. The number concentration per size-interval is represented by the dot at the midpoint of the interval. The concentrations in the size bins smaller than 40 nm are off-scale.
Fig. 4. Evolution of the ambient mass concentrations of nitrate and sulphate with a diameter smaller than 150 nm (a), 150–250 nm (b), 250–450 nm (c) in August 2007. The interstitial mass concentration of sulphate for the fractions as a function of time (d). The nitrate concentration in the interstitial aerosol is at the detection limit for all size classes and therefore not shown here.
Atmospheric Environment 252 (2021) 118278
6 a tenfold increase in the number of particles; compare Fig. 3a and b (note the tenfold difference in vertical scale).
Nitrate and sulphate concentrations of ambient and interstitial aerosols are shown in Fig. 4a in three diameter ranges: less than 150, 150–250 and 250–450 nm. The interstitial nitrate concentration was at the detection limit (15 ng m−3) for the whole period. This implies that virtually all (95% at least, depending on the size range of interest) ni- trate is taken up in the cloud droplets. In contrast, sulphate is present in significant amounts (>0.2 μg m−3) in the interstitial aerosol in all size classes (Fig. 4).
The percentage of CCN in which nitrate or sulphate is the prevalent component was assessed via a combination of data as presented in Figs. 3b and 4. In the size-range of 250–450 nm, CCN contain on average 2 μg m−3 of nitrate while interstitial nitrate concentration was at the detection limit of 20 ng m−3. This result implies that close to 98% of nitrate concentration is activated while at most 2% of the nitrate is not activated. The ambient sulphate concentration in this size-range (250–450 nm) is 0.5 μg m−3, which is small in comparison to the ni- trate concentration (Fig. 4b). Therefore, nitrate is a main compound of the CCN in the size range 250–450 nm. For aerosols smaller than 250 nm, at least 95% of the nitrate is taken up in the cloud droplets as deduced from the nitrate concentration of ambient and interstitial aerosols. Assuming that nitrate and sulphate both behave similarly as CCN, the large fraction of activated nitrate implies that it must be within a size range for which the activated fraction is high corresponding to the 200–250 nm bin. Sulphate, in contrast, is only partly activated (about 30%) and may be in smaller (150–200 nm bin) particles that do not fully activate. The interval 150–250 nm corresponds to 45% of the total CCN number concentration of which two third (~70%) is in the smaller diameter range particles (150–200 nm) dominated by sulphate.
During the second polluted period (around 14 August; Fig. 2), the nitrate and sulphate ratios were similar to those observed during the first period but their mass concentrations were lower. Therefore, the evalu- ation of the percentages activated, during this period, are more uncer- tain but highly indicative of a similar dominance of nitrate in the less numerous CCN (larger than 200 nm).
3.1.2. April 2009
The campaign organised in the early half of April 2009 lasted for two weeks, with an IOP of 9 days during which the cloud chamber was operated. The LWC was similar to that in the summer campaign and (only) AMS data are available for the interstitial aerosol. Details of the approach and the technical reasons for an absence of physical data are given in section S2 of the Supplementary Material. Fig. 5 shows the time evolution of the concentration of nitrate in the submicron fraction in ambient air as determined with the MARGA-sizer, together with the PM10 sodium concentration used as proxy for the marine origin of the air mass. Most of the time nitrate concentrations were high reflecting a continental origin of the air with easterly winds. On April 5th, with NW air masses and appreciable sodium concentrations, nitrate mass con- centrations were at the detection limit for most of the day (Fig. 5a).
Sulphate was at its lowest, even lower than during the summer campaign. In the evening of April 7th, high sodium concentrations evidenced a strong marine influence in polluted air masses (SW, Fig. 5b), accompanied with an absence of measurable nitrate. According to the HYSPLIT back-trajectories the air passed over the English Channel and the air masses are then considered as clean (air masses not passing over polluted regions).
On April 4th, a quite persistent episode occurred with a large con- centration of submicron nitrate and a lower concentration of submicron
Fig. 5. a) Submicron MARGA Sizer concentrations of ambient nitrate and ambient sulphate during the intensive campaign of April 2009. Notice the very good comparability of these data with those of the AMS (Fig. S2). The marine tracer sodium in the PM10 fraction is given. To ease the view, the sodium concentration was multiplied by a factor of 5. b) Wind direction, in degrees, during the same period. c) Nitrate to sulphate mass concentration ratio observed in the CCN size range (150–250 nm) during April 2009.
S. Crumeyrolle et al.
sulphate. The associated air masses (SW flows) had an appreciable PM10
sodium concentration (Fig. 5a). In addition, satellite images showed a low-cloud field in the region, extending from the Gulf of Biscay to far over the North Sea, also covering the Netherlands (Fig. S5). We have the detailed mass distribution of the major compounds in both ambient and interstitial aerosol as a function of size from the AMS (e.g., Fig. S3).
Nitrate concentrations were twice that of sulphate over the full size range of the CCN; this is different from the situation observed in summer 2007 when the nitrate was preferentially present in the larger and less numerous CCN in the polluted air masses. The difference might be due to the volatile nature of the nitrate and the lesser stability of the smallest particles at the higher temperatures in summer. This seasonality is the subject of the long-term monitoring in the next section (3.2). Before we proceed, we discuss the contribution of two other species, viz., organics and sea salt to the CCN.
The concentration of organic was on average 50% of that of nitrate in polluted air masses (SW), like on April 4th with the SC-field (Fig. S3).
The importance of the organics as CCN compound for this date is given by the hygroscopicity factor which can be deduced from the oxygen to carbon ratio as determined with the AMS. With an average O:C ratio of 0.65 [Rickards et al., 2013], the corresponding value of the hygro- scopicity factor is around 0.1 while the hygroscopicity factor of nitrate is 0.7. It implies that the organics are an order of magnitude less impor- tant. While OC dominates the smallest aerosol particles these are also too small to serve as CCN. In clean air masses, the concentration of or- ganics was quite similar to that of sulphate, for instance on April 5th (Fig. S2). The hygroscopicity of the organic material was a factor of twenty less, as estimated from an O:C ratio of 0.3. This is a strong indication of the limited importance of organics as CCN-compound.
The sea salt concentration was measured over the whole size range from 100 nm to 10 μm. Sodium concentrations encountered were as high as 4 μg m−3, but the sea salt was mostly in the PM10-2 fraction, which corresponds at most to a number concentration of one sea-salt particle cm−3. From these observations, we can conclude that (also) Sea-Salt is negligible as compound governing the number of CCN.
3.1.2.1. “CCN” size range. As guidance for the evaluation of the monitoring study in 2008, presented in the next section, we use the data in this April 2009 campaign as example. We evaluated the data ac- cording to the ratio of nitrate to sulphate in the “CCN” size range. This range is defined in terms of CCN numbers as that in which 85% of the CCN reside. This range corresponds to the diameter interval of around 100–250 nm (Fig. 3) that is encompassed in two MARGA-sizer channels of: Dp <150 nm and 150<Dp <250 nm. Incidentally, the mass dis- tributions of ambient and interstitial aerosol as derived from the right panel in Fig. 3 in the high nitrate event of 2–3 August 2007 is highly similar to that on April 4th, 2009, with the implication that the size distribution of the CCN is also quite comparable to that as shown in Fig. 3, justifying the choice for the mentioned CCN-range(s).
We present here as example of the evaluation the nitrate to sulphate mass concentration ratio in the size range of 150–250 nm (N/S150–250nm) in Fig. 5c, together with the Na-concentration in Fig. 5a and 2 hr wind- direction in Fig. 5b. The relevant period is that on April 4th, for which the ratio is two. There is an episode on April 12th to 13th with winds from the north with a high N/S150–250nm ratio and a substantial sodium mass concentration evidencing that the air has indeed travelled over sea.
This is in contrast to the usual finding that nitrate is at the detection limit for that wind-direction. The 72-hr back trajectory provides the answer for this controversy: continental air passed over Germany the preceding day, travelled north to over the North Sea and then back to the Netherlands via a southbound bend (see section S2.3 for more details).
This example served as a warning for us to always check wind-direction with the associated back-trajectory.
3.2. Longer-term ratio of nitrate to sulphate in the CCN size range in 2008 For practical reasons, the large cloud chamber and the variety of manually operated instrumentation could only be operated during rather short periods. The MARGA-sizer was deployed in Cabauw, in 2008, in-between the cloud-chamber campaigns. In this section, the observations of the long-term monitoring will be evaluated in a similar way as described at the end of subsection 3.1.2 in the April 2009 campaign.
As observed during the intensive campaigns, clean air masses (NW flows) were almost always associated with high sodium mass concen- trations, see e.g., Fig. S8. Consistently with the findings of both intensive campaigns, submicron sulphate mass concentrations were 100 ng m−3 and higher while submicron-nitrate mass concentrations were at the detection limit of 30 ng m−3. Moreover, the same patterns for clean marine air masses were also deduced from a full year of monitoring with an ACSM in 2011–2012 [Schlag, 2014; Schlag et al., 2016]. Therefore, we conclusively infer that nitrate is a negligible CCN-compound in this quadrant and this can be explained by the absence of significant sources of nitrate in this wind sector. Ovadnevaite et al., [2014] found a con- centration hovering around 20 of ng m−3 in marine air at the Atlantic coast in Ireland of sources in a three-year monitoring effort and ascribe this to an absence of marine sources. The sulphate concentration is similar to the values found in NW air in our study and that of Schlag [2014].
From here on we focus on marine air masses in which substantial nitrate was found (SW flows) and specifically on the seasonal difference of the ratio of nitrate to sulphate mass concentrations in the CCN size range. This ratio is used as proxy to identify the CCN main component for the number of CCN particles with a distinction into small (Dp <150 nm) and large (150 nm <Dp <250 nm) CCN. As previously observed in the cloud chamber studies, some air masses passing over the English Channel were found with absence of measurable submicron nitrate, even though large emissions of NOx, the precursor of nitrate, are projected for this heavily used shipping corridor [Aulinger et al., 2016].
In the far more abundant cases with air masses that travelled over the southern UK or western France/Belgium, there was a substantial ambient nitrate mass concentration. We chose data with appreciable pollution input via the following criteria: a PM2-nitrate mass concen- tration >150 ng m−3, which meant that nitrate mass concentration in the CCN-range should be well above the detection limit of 15 ng m−3, in combination with a Na concentration in PM10 >100 ng m−3, as crite- rion for marine air.
In the indicated way close to 600 2hr-data points, remained, for summer (150 points) and winter (450 points). The marine origin of the air mass of each data-point entry was then visually checked via the respective back-trajectory. For periods for which the criteria were ful- filled, we evaluated the seasonal variation of the N/SDp<150nm and N/
S150–250nm. In winter, both N/SDp<150nm and N/S150–250nm varied from 1 to 5, with an average value close to 3 clearly showing the importance of manmade nitrate as CCN-compound in “polluted” marine air masses.
During spring (April/May), the average N/SDp<150nm and N/S150–250nm
was just over 2. In summer, for almost all events, N/SDp<150nm was close to zero, while only in a few (4 data points) occasions N/SDp<150nm
reached 2 while N/S150–250nm was on average 0.4.
Low CCN–N/S ratios were also observed during the summer campaign of 2007 (section 3.1) and can be qualitatively understood from the semi-volatile nature of the nitrate at temperatures larger than 20 ◦C (aan de Brugh et al., 2012) and preferential evaporation of nitrate from small particles to form stable sodium nitrate via reactions with large sized sea salt (Chen et al, 2016, 2020) called “redistribution ef- fect”. A possible other or supplementary explanation of the seasonality in the nitrate might be the concentration of ammonia, in the sense that this gas is needed to form submicron (ammonium) nitrate, with seasonal differences in the emission and concentrations of ammonia.
The observed seasonal behaviour requires many more data for a
Atmospheric Environment 252 (2021) 118278
8 reliable climatology; however, the data could well be used in dedicated modelling efforts, like those of Chen et al., mentioned above. This calls for taking into account the ammonia concentrations as measured at the receptor site. However, there is another unresolved issue: in polluted air masses (SW flows), stratus is the more common cloud type in which the supersaturation and corresponding CDNC should be substantially lower than in the SC as simulated in our cloud chamber. Therefore, only the largest particles would act as CCN which are enriched in nitrate in summer. A low CDNC in stratus (around 125 cm−3) was experimentally observed in cloud flights at the other side of the ocean [Leaitch et al., 1996] that calls for verification in our region to quantify the role of nitrate in this most frequent cloud type.
4. Conclusions
The role of nitrate versus sulphate for the number of CCN (Cloud Condensation Nuclei) and associated CDNC (Cloud Droplet Number Concentration) in regional marine stratocumulus was evaluated via experiments in a cloud chamber in which the supersaturation conditions of the regional stratocumulus were mimicked. The size distribution and chemical composition as a function of size of ambient and interstitial aerosol were measured. By difference, the CCN concentration and chemical composition were obtained. Two intensive campaigns (a 9-day IOP in April 2009 and a 6-week summer campaign with a 3-week IOP in 2007) took place.
Two marine air flows could be discerned with respect to the composition of ambient aerosol and CCN: (i) from the North-West, characterized by a low aerosol concentration of particles with a diam- eter > 100 nm (N100), characteristic for an absence of significant anthropogenic aerosols; in this category are also (occasional) air masses passing over the English Channel (ii) air masses from the South-West, passing over the UK or NW-France/Belgium and characterized by high N100 concentrations.
In clean (NW) air masses, the submicron nitrate concentrations were consistently lower than the lower detection limit. In contrast, the total ambient sulphate concentration was significant. These results were confirmed by long-term (7 months) 2hr-measurements at the central meteo-station of Cabauw in 2008 and substantiated by data from a year- long monitoring at the site in 2011–2012 [Schlag et al., 2016].
In polluted (SW) air masses, nitrate was a significant compound of the ambient aerosol and the CCN. The results of the April 2009 and summer 2007 campaign were quite different. During the summer campaign, nitrate was present in the larger CCN (200–450 nm) which comprised about 20% of the CCN while the smaller more numerous CCN were dominated by sulphate. During the April campaign, nitrate was the main compound of the aerosol overall and twice as important as CCN- compound as sulphate.
The cloud chamber results were used to interpret long-term obser- vations of the size-distribution of nitrate and sulphate in terms of their importance for the CCN number concentration in polluted air masses (SW). For this the nitrate to sulphate mass concentration ratio within the
“CCN” size range (roughly 100–250 nm) was used. Marine polluted (SW) air masses highlight a seasonal trend. The average nitrate/sulphate mass concentration ratio in the CCN size range was close to 3 in winter, around 2 in spring and 0.2 during summer. The low values in summer could be explained by the instability of the semi-volatile nitrate at the elevated temperatures occurring during this season in combination with preferential evaporation of nitrate from the smallest particles. There- fore, in summer, nitrate plays a minor role as a CCN.
With the projected rapid decrease of the regional sulphate levels, nitrate will become a more dominant CCN-compound in polluted marine (SW) air masses in the moderate/cold seasons, which should be taken into account in modelling studies. Moreover, the nitrate size distribution was highly comparable to that of sulphate, which would simplify model calculations. Obviously, longer time series of data are required for a climatologically sound attribution of the role of nitrate and actual data
on the CDNC for the frequently occurring stratus.
CRediT authorship contribution statement
Suzanne Crumeyrolle: Writing – review & editing, Visualization.
Amewu Mensah: Supervision. Andrey Khlystov: Methodology. Ger- ard Kos: Investigation. Harry ten Brink: Conceptualization, Writing – original draft.
Declaration of competing interest
The authors declare that they have no known competing financial interests or personal relationships that could have appeared to influence the work reported in this paper.
Acknowledgement
This work is a contribution to the CaPPA project (Chemical and Physical Properties of the Atmosphere), funded by the ANR through the PIA (Programme d’Investissement d’Avenir) under contract ANR-11- LABX-0005-01. The experimental study was performed in the frame- work of the Dutch Climate Change and Spatial Planning program BSIK Klimaat voor Ruimte, supported by the former ministry of Housing, Spatial Planning and the Environment (VROM). The AMS measurements were made possible via a grant in the EU-programme ACCENT-Infra- structure. We are very grateful for the reviews in this hectic time for scientists and specifically for the many valuable suggestions for improvement. We thank dr. Christian Spindler (FzJ; presently at PwC, Zurich, Switzerland) and Piet Jongejan (ECN) for respectively operating the AMS and the MARGA-sizer and dr. Thomas Mentel (FzJ) for his comments on the original manuscript.
Appendix A. Supplementary data
Supplementary data to this article can be found online at https://doi.
org/10.1016/j.atmosenv.2021.118278.
References
Aan de Brugh, J.M.J., Henzing, J.S., Schaap, M., Morgan, W.T., van Heerwaarden, C.C., Weijers, E.P., Coe, H., Krol, M.C., 2012. Modelling the partitioning of ammonium nitrate in the convective boundary layer. Atmos. Chem. Phys. 12, 3005–3023.
https://doi.org/10.5194/acp-12-3005-2012.
Aulinger, A., Matthias, V., Zeretzke, M., Bieser, J., Quante, M., Backes, A., 2016. The impact of shipping emissions on air pollution in the greater North Sea region – Part 1: current emissions and concentrations. Atmos. Chem. Phys. 16, 739–758. https://
doi.org/10.5194/acp-16-739-2016. www.atmos-chem-phys.net/16/739/2016/.
Bellouin, N., Rae, J., Jones, A., Johnson, C., Haywood, J., Boucher, O., 2011. Aerosol forcing in the climate model intercomparison project (CMIP5) simulations by HadGEM2-ES and the role of ammonium nitrate. J. Geophys. Res. - Atmos. 116 (D20), D20206, 0148–0227.
Boucher, O., Randall, D., Artaxo, P., Bretherton, C., Feingold, G., Forster, P., Kerminen, V.-M., Kondo, Y., Liao, H., Lohmann, U., Rasch, P., Satheesh, S.K., Sherwood, S., Stevens, B., Zhang, X.Y., 2013. Clouds and aerosols. In: Stocker, T.F., Qin, D., Plattner, G.-K., Tignor, M., Allen, S.K., Boschung, J., Nauels, A., Xia, Y., Bex, V., Midgley, P.M. (Eds.), Climate Change 2013: the Physical Science Basis.
Contribution of Working Group I to the Fifth Assessment Report of the Intergovernmental Panel on Climate Change. Cambridge University Press, Cambridge, United Kingdom and New York, NY, USA.
Chen, Y., et al., 2016. Sea salt emission, transport and influence on size-segregated nitrate simulation: a case study in northwestern Europe by WRF-Chem. Atmos.
Chem. Phys. 16, 12081–12097.
Chen, Y., Cheng, Y., Ma, N., Wei, C., Ran, L., Wolke, R., Gro¨ß, J., Wang, Q., Pozzer, A., Van Der Gon, H.A.C.D., Spindler, G., Lelieveld, J., Tegen, I., Su, H., Wiedensohler, A., 2020. Natural sea-salt emissions moderate the climate forcing of anthropogenic nitrate. Atmos. Chem. Phys. 20, 771–786.
Crumeyrolle, S., Weigel, R., Sellegri, K., Roberts, G., Gomes, L., Stohl, A., Laj, P., Momboisse, G., Bourianne, T., Puygrenier, V., Burnet, F., Chosson, F., Brenguier, J.
L., Etcheberry, J.M., Villani, P., Pichon, J.M., Schwarzenboeck, A., 2013. Airborne investigation of the aerosols-cloud interactions in the vicinity and within a marine stratocumulus over the North Sea during EUCAARI (2008). Atmos. Environ. 81, 288–303.
Duynkerke, P.G., 1988. Stratocumulus Modeling. PhD thesis. Free University, Amsterdam, NL. http://bibliotheek.knmi.nl/knmipubWR/WR88-02.pdf.
S. Crumeyrolle et al.
EMEP, 2016. https://www.unece.org/fileadmin/DAM/env/documents/2016/AIR/
Publications/Air_pollution_trends_in_the_EMEP_region.pdf.
Hammer, E., Bukowiecki, N., Gysel, M., Jur´anyi, Z., Hoyle, C.R., Vogt, R., Baltensperger, U., Weingartner, E., 2014. Investigation of the effective peak supersaturation for liquid-phase clouds at the high-alpine site Jungfraujoch, Switzerland (3580 m a.s.l.). Atmos. Chem. Phys. 14, 1123–1139. https://doi.org/
10.5194/acp14-1123-2014.
Khlystov, A.Y., 1998. Cloud Forming Properties of Ambient Aerosol in the Netherlands and Resultant Shortwave Radiative Forcing of Climate. PhD thesis. University of Wageningen, NL. Available on line: http://edepot.wur.nl/210948.
Khlystov, A.Y., Kos, G., ten Brink, H.M., 1996a. A high-flow turbulent cloud chamber.
Aerosol. Sci. Technol. 24, 59–68.
Khlystov, A.Y., Kos, G., ten Brink, H., Berner, A., Kruisz, C., 1996b. Activation properties of ambient aerosol in The Netherlands. Atmos. Environ. 30, 3281–3290.
Khlystov, A., Kos, G.P.A., Even, A., ten Brink, H.M., 1999. https://www.researchgate.net /publication/234922811_Microphysical_properties_of_stratocumulus_clouds_dur ing_CLARA_campaignChapter_3_of_the_Final_Report_of_the_CLARA-project.
KNMI, 2020. Hourly data of the weather in The Netherlands (in Dutch; English summary). Cabauw: site 348. Cloud chamber: site 235 (de Kooy). https://projects.kn mi.nl/klimatologie/uurgegevens/selectie.cgi.
Kulmala, M., Asmi1, A., Lappalainen, H.K., et al., 2011. General overview: European Integrated project on Aerosol Cloud Climate and Air Quality interactions (EUCAARI) – integrating aerosol research from nano to global scales. Atmos. Chem. Phys. 11, 13061–13143. https://doi.org/10.5194/acp-11-13061-2011.
Leaitch, W.R., Banic, C.M., Isaac, G.A., Couture, M.D., Liu, P.S.K., Gultepe, I., Li, S.M., Kleinman, L., Daum, P.H., Macpherson, J.I., 1996. Physical and chemical observations in marine stratus during the 1993 North Atlantic Regional Experiment:
factors controlling cloud droplet number concentrations. J. Geophys. Res. 101, 29123–29135. https://doi.org/10.1029/96JD01228.
Mensah, A.A., Holzinger, R., Otjes, R., Trimborn, A., Mentel, ThF., ten Brink, H., Henzing, B., Kiendler-Scharr, A., 2012. Aerosol chemical composition at Cabauw, The Netherlands as observed in two intensive periods in May 2008 and March 2009.
Atmos. Chem. Phys. 12, 4723–4742.
Ovadnevaite, et al., 2014. Submicron NE Atlantic marine aerosol chemical composition and abundance: seasonal trends and air mass categorization. J. Geophys. Res. 119, 11,850–11,863. https://doi.org/10.1002/2013JD021330.
Rickards, A.M.J., Miles, R.E.H., Davies, J.F., Marshall, F.H., Reid, J.P., 2013.
Measurements of the sensitivity of aerosol hygroscopicity and the κ parameter to the O/C ratio. J. Phys. Chem. 117, 14120–14131. https://doi.org/10.1021/jp407991n.
Schlag, P., 2014. Long Term Aerosol Composition Measurements at the CESAR Tower at Cabauw, NL. PhD thesis. University of Cologne, Germany. http://kups.ub.uni-koeln.
de/5949/.
Schlag, P., Kiendler-Scharr, A., Blom, M.J., Canonaco, F., Henzing, J.S., Moerman, M., Pr´evˆot, A.S.H., Holzinger, R., 2016. Aerosol source apportionment from 1-Year measurements at the CESAR tower in Cabauw, The Netherlands. Atmos. Chem. Phys.
16, 8831–8847. https://doi.org/10.5194/acp-16-8831-2016, 2016.
Seinfeld, J.H., Bretherton, C., Carslaw, K.S., Coe, H., DeMott, P.J., Dunlea, E.J., Feingold, G., Ghan, S., Guenther, A.B., Kahn, R., Kraucunas, I., Kreidenweis, S.M., Molina, M.J., Nenes, A., Penner, J.E., Prather, K.A., Ramanathan, V.,
Ramaswamy, V., Rasch, P.J., Ravishankara, A.R., Rosenfeld, D., Stephens, G., Wood, R., 2016. Improving our fundamental understanding of the role of aerosol- cloud interactions in the climate system. Proc. Natl. Acad. Sci. Unit. States Am. 113, 5781–5790. https://doi.org/10.1073/pnas.1514043113.
ten Brink, H., Otjes, R., Jongejan, P., Slanina, S., 2007. An instrument for semi- continuous monitoring of the size-distribution of nitrate, ammonium, sulphate and chloride in aerosol. Atmos. Environ. 41, 3281–3290.
ten Brink, H., Otjes, R., Jongejan, P., Kos, P., 2009. Monitoring of the ratio of nitrate to sulphate in size-segregated submicron aerosol in The Netherlands. Atmos. Res. 92, 270–276.
ten Brink, H., Henzing, B., Otjes, R., Weijers, E., 2018. Visibility during New Year’s fireworks: governed by soot or the salty aerosol products in The Netherlands? Atmos.
Environ. 173, 289–294. https://doi.org/10.1016/j.atmosenv.2017.11.020.
Tørseth, K., W. Aas, K. Breivik, A.M. Fjæraa, M. Fiebig, A.G. Hjellbrekke, C. Lund Myhre, S. Solberg, K.E.
Weijers, E.P., Schaap, M., Nguyen, L., Matthijsen, J., Denier van der Gon, H.A.C., ten Brink, H.M., Hoogerbrugge, R., 2011. Anthropogenic and natural constituents in particulate matter in The Netherlands. Atmos. Chem. Phys. 11, 2281–2294.
Wood, R., 2012. Stratocumulus clouds. Mon. Weather Rev. 140, 2373–2423.
Yoon, Y.J., Ceburnis, D., Cavalli, F., Jourdan, O., Putaud, J.-P., et al., 2007. Seasonal characteristics of the physicochemical properties of North Atlantic marine atmospheric aerosols. J. Geophys. Res. 112 (D4), D04206. https://doi.org/10.1029/
2005jd007044.