Thonar et al.: Ser-um keratan sulphate in children 57 J. Clin. Chem. Clin. Biochem.
Vol. 26, 1988, pp." 57-63
© 1988 Walter de Gruyter & Co.
Berlin · New York
Age Related Changes in the Concentration of Serum Keratan Sulphate in Children
By E. J-M. A. Thonar1)
Departments of Biochemistry and Medicine, Rush-Presbyterian-St. Luke's Medical Center L. M. Packman
Department of Paediatrics, Northwestern University Medical School, Children's Memorial Hospital Mary Ellen Lenz
Department of Biochemistry, Rush-Presbyterian-St. Luke's Medical Center Jennifer Hayford, Patricia Lynch
Department of Paediatrics, Northwestern University Medical School, Children's Memorial Hospital and K. E. Kuettner
Departments of Biochemistry and Orthopaedic Surgery, Rush-Presbyterian-St. Luke's Medical Center, Chicago, Illinois, USA
(Received April 15/November 24, 1987)
Summary: Serum was obtained from 155 children at the time of admission to hospital for elective surgery.
The concentration of serum keratan sulphate was determined by an ELISA which uses an antibody specific for keratan sulphate, a molecule found predominantly in cartilage. Concentrations of keratan sulphate rise progressively during the first four years of life (0—2: mean = 357 μg/l; 2—4: mean = 422 μg/l) and then remain high until 12 years of age (mean = approx. 500 μg/l). At this time, concentrations drop markedly (13-year olds: mean = 3?7μ§^1; 14-year olds: mean = 318μg/l). After age 15, concentrations continue to fall toward the concentrations found in normal adults. Serum concentrations did not show significant differences with respect to disease category, sex or race but were found to vary, sometimes markedly, from child to child at any one age. The results suggest human cartilage undergoes significant changes in metabolic activities during maturation. Measurements of keratan sulphate concentration in serum may prove useful in studying the biochemical and physiological bases of these changes and in monitoring growth or endochondral ossification during maturation.
Introduction molecules consist of a core protein (MT = 2.5-3.8 Cartilage proteoglycans are large molecular weight x 105) to which glycosaminoglycans, namely chon- macromolecules that endow cartilage with its ability droitin sulphate and keratan sulphate, and both Ο- ίο undergo reversible deformation (1). These complex and N-linked oligosaccharides are covalently attached - (1). The rate at which cartilage proteoglycans turn ') Eugene J-M. A. Thonar is principal investigator and recipient over at different ages remains a point of much con-
of support for work from The William Noble Lane Medical tention (2 — 5). The absence in normal cartilage matrix (LMP). glycans (6) suggests that individual proteoglycan mol- J. Clin. Chem. Clin. Biochem. / Vol. 26, 1988 / No. 2
ecules are normally rapidly degraded into smaller fragments that are either engulfed by the chondrocytes or, more likely, diffuse into the body fluids that are in contact with the cartilage (5). Indeed, proteoglycan fragments and glycosaminoglycans are present in syn- ovial fluid (7, 8) and several species of glycosaminog- lycans have been detected in peripheral blood (5, 9-12).
A number of glycosaminoglycans, i.e. chondroitin sulphate, hyaluronic acid and heparan sulphate, have been detected in the blood in significant amounts (9 — 12). All of these glycosaminoglycans are constit- uents of proteoglycans in non-cartilaginous tissues (1).
In contrast, keratan sulphate is only found in signif- icant amounts in proteoglycans of cartilage and cor- nea (1, 5). Because the great majority (> 95%) of keratan sulphate-containing proteoglycans are found in hyaline, fibrous or elastic cartilages (1, 5), meas- urements of keratan sulphate blood concentrations might prove particularly useful to monitor cartilage catabolism. An enzyme-linked immunosorbent assay (ELISA)-inhibition assay, which utilizes a monoclonal antibody specific for keratan sulphate, was developed to quantify keratan sulphate present as single chains in human serum (5). In a previous study (5), we presented evidence that concentrations of keratan sul- phate in sera from adult hospitalized patients vary from individual to indiviudal but do not show any significant differences with respect to age or sex. In the same study, we reported that apart from a group of patients with degenerative cartilage changes, i. e.
osteoarthritis, there were no significant differences between groups representing different non-rheuma- tological conditions. We also presented preliminary data which suggested that the concentration of ker- atan sulphate in the sera of children aged 5 — 12 was significantly higher than in adults (5).
The present publication describes studies aimed at quantifying keratan sulphate in the serum of children of different ages. We present evidence that levels of keratan sulphate undergo a number of significant changes during growth and development.
Patients and Methods Materials
Flat bottom ELISA Nunc-Immunoplates IF (with certificate of binding capacity) were obtained from Vanguard International, Grand Island, NY; Tween 20 (polyoxyethylene sorbitan mono- laureate) and o-phenylenediamine were from Sigma, St. Louis, MO; and chondroitinase ABC (Proteus vulgaris) was from ICN Immunobiologicals, Lisle, Illinois.
Subjects
Blood samples were drawn from 155 children (76 males and 79 females) at the time of admission to Children's Memorial Hos-
pital, Chicago, for elective surgery. No children with rheuma- tological conditions were included in this study. In all cases, blood was drawn prior to subsequent surgical intervention and serum was isolated within 3 hours. Disease categories, shown in table 1, represent primary diagnoses as determined by the attending physician. Race as well as height and weight were also recorded at the time of bleeding. Patients were categorized by age into 9 groups, using 2 year increments (tab. 2). Age group 2-4, for example, includes all children who at the time of bleeding had turned 2 but were younger than 4 years. Drugs taken just prior to and at the time of bleeding were also recorded and were categorized according to their area of activity as shown in table 1. Serum was isolated from blood drawn from 19 young normal adults aged 23—27; there were 7 males and 12 females.
Antigens
A purified international standard of costal cartilage keratan sulphate antigen used as a standard in all the ELISA-inhibition assays was a kind gift from Drs. M. B. M thews and A. L.
Horwitz, The University of Chicago. The antigenic solution of chondroitinase ABC-treated bovine nasal Dl proteoglycan (5) used to coat the Nunc ELISA plates was prepared as follows.
Bovine nasal Dl proteoglycan (4 mg) was dissolved into 160 μΐ buffer containing 0.8 units chondroitinase ABC, .1 mol/1 so- dium acetate, and 0.1 mol/1 Tris, pH 7.3. The digestion was allowed to proceed for 2 hours at 37 °C. Immediately prior to coating, this solution was diluted into 20 mmol/1 carbonate- bicarbonate coating buffer, 0.2 g/1 sodium azide, pH 9.2, to bring the concentration of bovine nasal Dl . proteoglycan to 5 |
Antibodies
A previously described (5, 13) monoclonal IgGl antibody (I/
20/5-D-4) that specifically recognizes an antigenic determinant in the polysaccharide structure of both corneal and skeletal keratan sulphate was used as the source of anti-keratan sulphate antibody. Peroxidaser-coupled rabbit anti-mouse IgG was ob- tained from ICN Immunobiologicals, Lisle, IL.
ELISA-inhibition assay
Both the ELISA technique and the inhibition assay performed in conjunction with it were performed exactly as previously described (5). On day 1 of the assay, samples and standards of costal cartilage keratan sulphate, at different concentrations, are mixed with an equal volume of monoclonal antibody in phosphate buffered saline, 0.5 ml/1 Tween 20 (14) and placed at 4 °C overnight. On day 2, plates pre-coated with the chon- droitinase ABC-treated bovine nasal Dl proteoglycan (see above) (5) are washed 3 times and 200 μ! of each antigen- antibody mixture is placed into a well. After one hour, the plates are again washed and 200 μΐ of peroxidase-coupled anti- mouse IgG is pipetted in each well (5, 14). One hour later, the plates are washed for a final time and 200 μΐ of a solution containing substrate for the peroxidase is placed in each well (5, 14). The production of chromophore is stopped after 30 — 60 minutes by the addition of 50 μΐ of 2 mol/l H2SO4. The concentration of keratan sulphate present in the unknowns is calculated by comparing the absorbance value in each case to values generated from known concentrations of costal cartilage keratan sulphate antigen treated in an identical fashion and incorporated in the same plate. In order to assess-precision of the ELISA-inhibition assay for keratan sulphate, replicate measurements on the same serum sample were performed and compared within the same run (12 measurements performed in the same ELISA plate), between runs (20 measurements per- formed in different ELISA plates on the same day) and on different days (10 measurements performed fen different days).
Thonar et al.: Serum keratan sulphate in children 59 Statistical analysis
The data obtained were analyzed statistically (15) to determine whether the levels of keratan sulphate varied significantly with respect to age (one way analysis of variance and multiple range test). Because statistically significant age-related differences were found (see Results), the keratan sulphate value for each patient was recalculated as the percentage of the mean keratan sulphate concentration for that age. The recalculated keratan sulphate values of the whole population were then analyzed statistically to determine whether they varied with respect to sex (Student's t-test), primary disease (analysis of variance), race (analysis of variance) and drug intake (analysis of vari- ance). In order to determine if there were relationships between height and weight and serum concentrations of keratan sul- phate, the height and weight of each child was recalculated as a percentage of the mean height and weight for that age using the National Center for Health percentiles (16). The recalcu- lated keratan sulphate values for the whole population were then analyzed statistically to determine whether they varied with respect to percentile height or weight (regression analysis).
In addition, the taller (> 75 percentile, n = 13, mean age
= 5.9) and smaller (< 10 percentile, n = 27, mean age = 6.5) children in the 0—12 age range were compared to determine if they differed with respect to their recalculated keratan sulphate concentrations.
Results
Precision of the ELISA-inhibition assay was good when repeated measurements of keratan sulphate present in a serum sample were performed on the same day in either the same microtiter plate (mean
± standard deviation = 444 ±5.3 μ§/1 keratan sul- phate, n = 12) or different microtiter plates (mean ± standard deviation = 444 ± 8.2 μ§/1 keratan sul- phate, η = 20). Precision was also good when the serum was analyzed in different plates on different days (mean ± standard deviation = 446 ±11.5 μ§/1 keratan sulphate, n = 10). Because the amounts of keratan sulphate in the purified standard preparation and in serum were too low to measure by conventional biochemical techniques, we were unable to assess ac- curacy.
The children's age, sex, race, height and weight were recorded and their overall status at the time of blood donation further clinically classified as shown in table 1. Of the 155 donors, 48 (31 %) had been given med- ication of one sort or another as listed in table 1. The concentration of immunoreactive keratan sulphate in the serum of the 155 children tested was found to vary markedly with age (tab. 2). During the first 4 years of life, concentrations rise progressively, appear to peak at about age 4—5 and remain elevated until about age 12. At this time, concentrations begin to decrease. This decrease was most pronounced in the 13-year olds (12-year olds: mean = 491 ± 128 μ§/1, n = 10; 13-year olds: mean = 377 ± 170 μ§/1, η = 9;
14-year olds: mean =318 ±87 μg/l, η = 9). After
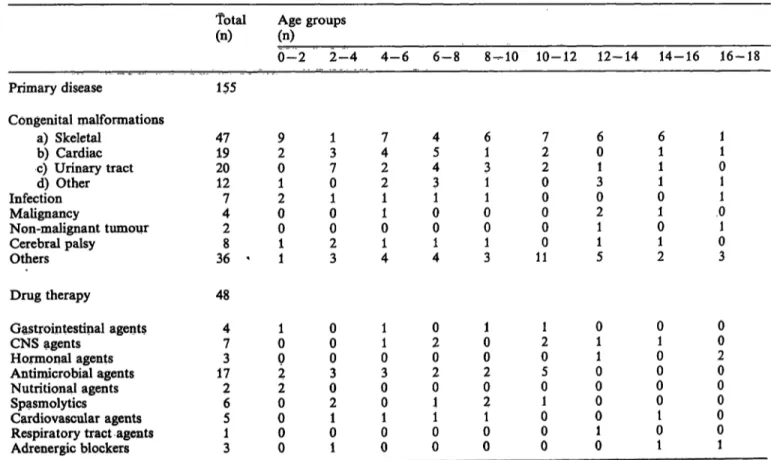
Tab. 1. Classification of pediatric patients by age, primary diagnosis and concurrent drug therapy.
Patients were categorized by age into 9 groups, using 2 year increments. Age group 2—4, for example, reflects all children who at the time of bleeding had turned 2 but were younger than 4. Primary diseases described as others included bone fracture, cystic fibrosis, nevi, burns, haem ngiomas, hydrocephalus, seizure disorder, paralysis and asthma. Of the total patient population, only 31% had received concurrent drug therapy as indicated.
Drug therapy
Total
(n) Age groups (n)
0-2 2-4 4-6 6-8 8-10 10-12 12-14 14-16 16-18 Primary disease 155
Congenital malformations
a ) Skeletal 4 7 9 1 7 4 6 7 6 6 1
b ) Cardiac 1 9 2 3 4 5 1 2 0 1 1
c ) Urinary tract 2 0 0 7 2 4 3 2 1 1 0
d ) Other 1 2 1 0 2 3 1 0 3 1 1
Infection 7 2 1 1 1 1 0 0 0 1
Malignancy 4 0 0 1 0 0 0 2 1 0
Non-malignant tumour 2 0 0 0 0 0 0 1 0 1
Cerebral palsy 8 1 2 1 1 1 0 1 1 0
Others 3 6 ' 1 3 4 4 3 1 1 5 2 3
48 Gastrointestinal agents
CNS agents Hormonal agents Antimicrobial agents Nutritional agents Spasmolytics
Cardiovascular agents Respiratory tract agents Adrenergic blockers
47 173 26 51 3
10 02 20 00 0
00 03 02 01 1
11 03 00 10 0
02 02 01 01 0
01 02 02 01 0
21 05 01 00 0
01 01 00 01 0
01 00 00 01 1
00 20 00 00 1
J. Clin. Chem. Clin. Biochem. / Vol. 26,1988 / No. 2
age 15, concentrations continue to fall, approaching the lower values obtained for the 19 young normal adults (tab. 2, fig. 1). In order to statistically evaluate these observed maturation-related differences, chil- dren were categorized into 9 groups, using 2-year increments. Analysis (one way analysis of variance) of the data showed that there were significant differ- ences between some of the age-groups (p < 0.00005).
A Tukey-B procedure (multiple range test) was then performed to establish which age groups were signif- icantly different from others. The results revealed that children between the ages of 4—6, 6—8, 8 — 10 and 10—12 have significantly higher concentrations of serum keratan sulphate than children in the 0—2 or 14—18 age groups (p < 0.05). Differences between the other age groups shown in table 2 were not sta- tistically significant (p > 0.05).
Keratan sulphate concentrations recalculated as the percentage of the mean keratan sulphate concentra- tion for that age were analyzed to determine whether there were any differences in the whole population with respect to sex, race, disease category and drug administered. The results showed that keratan sul- phate concentrations do not vary significantly be- tween males and females (t-test: p = 0.135) nor be- tween children of different races (analysis of variance:
p = 0.390). Importantly, there were no significant differences between the groups of children with dif- ferent diseases (analysis of variance: p = 0.646) nor between groups which received different drugs in the course of therapy (analysis of variance: p = 0.818).
Keratan sulphate concentrations vary, sometimes markedly, from child to child of the same age (fig. 1).
This suggests that there may be significant differences
Tab. 2. Age-related changes in concentrations of immunoreac- tive keratan sulphate in serum.
Agegroup (a)
0- 22- 4 4- 66- 8 10-128-10 12-14 14-16 16-18
*23-27' η
1617 2222 1622 1913 8 19
Keratan χ Oig/1) 357422 502507 493547 437332 310 228
sulphate + SD Otg/1) 11996 114126 114176 15797 107 72
Range fog/l) 266-556 258-691 295-767 243-745 288-749 313-987 221-795 122-546 205-525 103-396
* Young normal adults aged 23—27 were included as a single separate group for comparison. The values given under
"Range" refer to the lowest and highest concentrations of keratan sulphate recorded for each age-group.
800 ο α.
01D Όc
2Φ 600
ο
Dε E
400
200
10 14 18
Age [q] 22 26
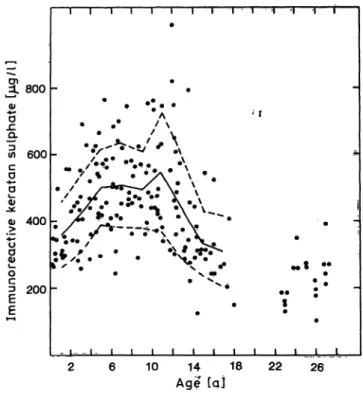
Fig. 1. Concentration of immunoreactive keratan sulphate in serum of 155 children, hospitalized at different ages, and 19 normal young adults aged 23—27. Con- centration refers to μg of skeletal, keratan sulphate standard per liter and was calculated as described in Patients and Methods. The mean for the different age groups of the pediatric population is indicated by the solid line with one standard deviation above and below the mean indicated by the broken line.
in the rate of catabolism of cartilage proteoglycans from child to child. While it was not possible to assess rate of growth at the time of bleeding, statistical analyses were performed to assess whether there were correlations between serum keratan sulphate conceit trations and height at any one age. Because both parameters vary significantly with age, the keratan sulphate concentration and height of each patient were first recalculated as the percentage of the mean fceratan sulphate concentration or height for that age (16). The results of the statistical analyses (regression) performed on the whole population suggest that there may be a correlation between keratan sulphate con- centration and height at any one age (p = 0.067).
This is supported by the observation that, in children between the ages of 0—12, the mean of recalculated keratan sulphate concentrations of the group of tallest children (> 75 percentile) was 18% higher than the mean of the group of smallest children (< 10 percen- tile) (113% vs 95%). In contrast, but not unexpect- edly, when weights were considered, there was no correlation between recalculated keratan -sulphate concentrations and weights recalculated for each child as a percentage of the average weight for that age (p = 0.665). > <
Thonar et al.: Serum keratan sulphate in children 61
Discussion
The contention that measurements of concentrations of keratan sulphate in peripheral blood provide direct information about the rate of cartilage proteoglycan catabolism (5) is based, in part, upon the premise that when cartilage proteoglycans are degraded, during normal turnover or in pathological states, the great majority of the breakdown products are not engulfed by the chondrocytes but rapidly diffuse out of the cartilage matrix (6). A recent study has shown that pathological synovial fluids from patients with carti- lage degeneration or erosion, i. e. osteoarthritis, rheu- matoid arthritis and juvenile rheumatoid arthritis, contain elevated amounts of proteoglycan fragments varying in size and composition (17). These fragments all appear to contain a protein backbone to which are covalently attached several chondroitin sulphate and/or keratan sulphate chains. How and where these are further degraded to yield the smaller chondroitin sulphate (9) and keratan sulphate (5, 18, 19) chains which are found in the circulation is not known.
The monoclonal antibody (1/20/5-D-4) used in this study has been used previously to quantify keratan sulphate in serum (5, 20). This well characterized antibody has been shown to be very specific for a portion of the keratan sulphate chain containing a sequence of three or more repeating units of the disaccharide sulphated N-acetyl glucosamine-sul- phated galactose (21). This epitope has not been found in any glycoprotein or other polysaccharide (13, 20, 21). Desulphation of the keratan sulphate chain re- sults in total loss of antigenicity (13). On the other hand, the protein to which the keratan sulphate chain is covalently attached is not essential for recognition.
Thus, we have shown the ELISA-inhibition assay can be used to quantify keratan sulphate in intact proteo- glycans (5), keratan sulphate in peptidoglycans pro- duced by digestion of preoteoglycan with trypsin (22) or single keratan sulphate chains free of protein (5).
We have also shown, using the ELISA-inhibition as- say, that no antigenic keratan sulphate can be detected in the serum of individuals with macular corneal dystrophy (20). The single abnormality in this inher^
ited blinding disease appears to be an absence of sulphate ester groups on the 6 position of both N- acetyl galactosamine and galactose moieties of the keratan sulphate chain; the metabolism of all other carbohydrates appears to be normal in this condition (20).
Two recent, reports offer evidence that when a carti- laginous tissue is rapidly degraded, the concentration of serum keratan sulphate rises concomitantly (23, 24). In the first study, a single injection of chymo-
papain in one intervertebral disc caused a several- fold, rapid increase in concentrations of serum kera- tan sulphate in each of 10 human patients undergoing chemonucleolysis (23). Concentrations reached a peak 48 —72 h following the injection, remained elevated for at least one week but returned to pre-injection values at 21 days. In the second study, serum concen- trations were found to rise markedly during the rapid growth and elongation of antlers in male deer (24).
Deer antler regeneration is an annual event which occurs through a process of endochondral ossification (24). Upon completion of mineralization of the antler, serum keratan sulphate levels returned to normal.
These reports add considerable strength to the con- tention that increases in the rate of catabolism of cartilage proteoglycans will result in a corresponding increase in the concentrations of keratan sulphate in the circulation.
The studies presented here present evidence that con- centrations of serum keratan sulphate undergo marked maturation-related changes. Because of ethi- cal considerations, we were unable to perform this study on normal children. Our results which show that there were no significant differences in serum keratan sulphate concentrations between the different disease groups (p = 0.646) suggest that the matura- tion-related changes we have observed are a good reflection of changes in the paediatric population as a whole.
The results strongly suggest that measurements of serum concentrations of keratan sulphate provide im- portant new information about various aspects of the metabolism and/or catabolism of cartilage proteogly- cans in children. For example, the finding that the concentration of serum keratan sulphate is higher in children than adults is in itself of great significance and should prove extremely useful in assessing age- related differences in proteoglycan catabolism in vivo.
None of the 115 children aged 0 — 12 had serum keratan sulphate concentrations that were lower than the mean obtained for the group of normal young adults aged 23 — 27. Studies on age-related changes have shown that cartilage proteoglycans from a 10- year old contain less than half as much keratan sul- phate as the proteoglycans from human adult carti- lage (25). Consequently, the greater than 2-fold dif- ference in the keratan sulphate serum concentrations of a 10-year old (approx. 520 g/l) and a young adult (approx. 228 g/l) (5) suggests the amount of cartilage proteoglycan catabolized per kg of body weight is at least four times higher in the 10-year old. Because the ratio of cartilage mass to body weight or blood vol- ume is considerably higher in the growing child (26) than in the adult, it is difficult to establish the extent
J. Clin. Chem. Clin. Biochem. / Vol. 26,1988 / No. 2
to which the decrease in the concentration of keratan sulphate in serum between age 10 and adulthood is the result of
i) a lower rate of catabolism of proteglycan per unit mass of cartilage in the adult (2—5) and/or ii) an age-related decrease in mass of cartilage per
unit body weight.
Elongation of the long bones during growth occurs through a process of endochondral ossification in which new cartilage is continuously laid down before it is degraded and replaced by bone (27). The presence of a transient rise in serum concentrations of keratan sulphate during endochondral ossification of the an- tlers in male deer (24) or experimentally-induced deg- radation of an intervertebral disc (23, 28) support the contention that concentrations of serum keratan sul- phate can be correlated with the extent and/or rate of cartilage catabolism. Further support for the con- tention that serum concentrations of keratan sulphate in children may be correlated with metabolic activities in the growing cartilages comes from a recent report that children with constitutional growth delay have significantly lower serum keratan sulphate concentra- tions than age-matched controls (29). Additional studies are needed to test the contention that concen- trations of serum keratan sulphate may provide direct or indirect information about the rate of growth of children between the ages of 0 —12. If that contention can be substantiated, measurements of serum concen- trations of keratan sulphate could prove particularly useful to study diseases of cartilage metabolism which result in abnormalities of growth and elongation of the long bones in children.
The rapid decrease in keratan sulphate concentrations in the 13 — 16 year-old group is of great interest for it suggests that a decrease in the rate of catabolism of cartilage proteoglycaris actually occurs some time after growth has begun to decline, L e. approximately 15 — 16 years of age in males and 13-7,14 years of age in females (16), although linear growth can continue until age 25. There are no known major changes in the content or composition of cartilage proteoglycans between 13 and 16 years of age (25). Consequently, it is likely the decrease reflects a change in rate of proteoglycan metabolism, possibly under hormonal regulation. There appear to be no clear sex-related differences in the time of onset of this decrease; how- ever, in this study, the number of males and females in the 13 —16 age group was too small to allow for meaningful statistical analyses.
Finally, the ELISA^inhibition assay for keratan suU phate should prove useful*in determining whether some drugs, i.e. non-steroidal anti-inflammatory agents such as acetylsalicylic acid (aspirin®) or indo- metacin, which have been shown to profoundly affect proteoglycan metabolism in vitro (30^32), have any effect on growing children in vivo.
Acknowledgement
We thank Dr. Susan Shott, Ph. D., Biostatistician in the Dept.
Preventive Medicine, Rush-Presbyterian^St. Luke's Medical Center for performing the statistical analyses. We also thank Dr. Bruce Caterson, Department of Biochemistry, University of West Virginia for providing the 1/20/5-D-4 monoclonal anti- body.
References
1. Heinegard, D. & Paulsson, M. (1984) Structure and me- tabolism of proteoglycans. In: Extracellular Matrix Bio- chemistry (Piez, K. A. & Reddi, A. H., eds.). Eisevier, New York, pp. 277-328.
2. Mankin, H. J. & Lipiello, L. (1969) J. Bone Joint Surg.
51 A, 1591-1600.
3. Maroudas, A. (1975) Biorheology 12, 233-248.
4. Lohmander, S. (1976) Proteoglycans of hyaline cartilage (thesis). Karolinska Institut, Stockholm.
5. Thonar, E. J.-M. A., Lenz, M. E., Klintworth, G. K., Caterson, B., Pachman, L. M., Glickman, P., Katz, R., Huff, J. & Kuettner, K. E. (1985) Arthritis Rheum. 28, 1367-1376.
6. Kimura, J. H., Osbody, P., Caplan, A. I. & Hascall, V. C.
(1978) J. Biol. Chem. 253, 4721-4729.
7. Heinegard, D., Inerot, S., Wieslander, J. & Lindbläd, G.
(1985) Scand. J. Clin. Lab. Invest. 45, 421-427.
8. Saxne, T., Heinegard, D. & Wolheim, F. A. (1986) Ann.
Rheum. Dis. 45, 491 -497.
9. Calatroni, A., Donnely, P. V. & DiFerrante, N. J. (1969) J.
Clin. Invest. 48, 332-343.
10. Wood, K. M., Wusteman, F. S. & Curtis, C. G. (1973) Biöchem. J. 134, 1009-1013.
11. Murata, K. & Horiuchi, Y. (1977) Clin. Chim. Acta 75, 59-69.
12. Friman, C., Storgards, E., Juvani, M. & Kock, B. (1977) Clin. Nephrol. 8, 435-439.
13. Caterson, B., Christner, J. E. & Baker, J. R. (1983) J. Biol.
Chem. 258, 8848-8854.
14. Thonar, E. J.-M. A., Kimura, J. H., Hascall, V. C. & Poole, A. R. (1982) J. Biol. Chem. 257, 14173-14180.
15. Neter, J. & Wasserman, W. (1974) Applied Linear Statistical Models. Richard D. Irwin, Homewood, Illinois.
16. Hamill, R V. V., Drizd, T. A., Johnsson, C. L., Reed, R.
B., Röche, A. F. & Moore, W M. (1979) Am. J. Clin. Nutr.
32, 607-629.
17. Witter, J., Roughley, P., Webber, C., Roberts, N., Keystone, E. & Poole, A. R. (1987) Arthritis Rheum. 30, 519-529.
18. Thonar, E. J.-M. A., Glickman, P„ Katz, R., Huff, J., Caterson, B., Lenz, M. E. & Kuettner, K. E. (1986) Or- thoped. Res. Soc. Trans. //, 146 (abstract).
Thonar et al.: Serum keratan sulphate in children 63 19. Thonar, E. J.-M. A., Schnitzer, T. J. & Kuettner, K. E.
(1987) J. Rheum. 14 (Suppl. 14), 23-24.
20. Thonar, E. J.-M. A., Meyer, R. E, Dennis, R. F., Lenz, M.
E., Maldonado, B., Hasseil, J. R., Hewitt, A. T., Stark, W.
J., Stock, E. L., Kuettner, K. E. & Klintworth, G. K. (1986) Am. J. Ophthal. 102, 561-569.
21. Mehmet, H., Scudder, R, Tang, P. W., Houiisell, E. F., Caterson, B. & Feizi, T. (1986) J. Biochem. (Tokyo) 757, 385-391.
22. Maldonado, B., Kuettner, K. E. & Thonar, E. J.-M. A.
(1988) Orthoped. Res. Soc. Trans. 73, in press (abstract).
23. Bloch, J. A., Schnitzer, T. J., Andersson, G. B. J., McNeill, T. W., Sinkora, G., Layfer, L. F. & Thonar, E. J.-M. A.
(1987) Orthoped. Res. Soc. Trans. 72, 300 (abstract).
24. Dinsmore, C. E., GOSS, R. J., Lenz, M. E. & Thonar, E.
J.-M. A. (1986) Calc. Tiss. Internat. 39, 244-247.
25. Roughley, P. J. & White, R. J. (1980) J. Biol. Chem. 255, 217-224.
26. Lowrey, G. H. (1986) Growth and Development of Chil- dren. Year Book Medical Publishers, Chicago.
27. Warshawsky, H. (1982) Embryology and Development of the Skeletal System. In: The Musculoskeletal System — Embryology, Biochemistry, and Physiology. (Cruess, R. L., ed.). Churchill Livingstone, New York, pp. 33 — 56.
28. Oegema, T. R., Swedenburg, S. M., Bradford, D. S. &
Thonar, E. (1987) Orthoped. Res. Soc. Trans. 72, 299 (ab- stract).
29. Pachman, L. M., Hayford, J., Lynch, P. A., Jacobitz, J., Lenz, M. E., Kuettner, K. E. & Thonar, E. J.-M. A. (1987) Arthritis Rheum. 30, S20 (abstract).
30. Palmosky, M. J. & Brandt, K. D. (1980) Arthritis Rheum.
23,1010-1020.
31. Palmosky, M. J. & Brandt, K. D. (1983) Arthritis Rheum.
25, 528-531.
32. Palmosky, M. J. & Brandt, K. D. (1984) Arthritis Rheum.
27, 398-403.
Eugene J.-M. A. Thonar Associate Professor
Departments of Biochemistry and Internal Medicine
Rush-Presbyterian-St. Luke's Medical Center 1653 W. Congress Parkway
Chicago, Illinois 60612-3864 United States of America
J. Ciin. Chem. Clin. Biochem. / Vol. 26,1988 / No. 2