• Keine Ergebnisse gefunden

Transcriptomics-based prediction of human hepatotoxic blood concentrations of chemicals.

N/A
N/A
Protected

Academic year: 2021

Aktie "Transcriptomics-based prediction of human hepatotoxic blood concentrations of chemicals."

Copied!
175
0
0

Wird geladen.... (Jetzt Volltext ansehen)

Volltext

(1)

Transcriptomics-based prediction of human hepatotoxic blood concentrations of chemicals.

DISSERTATION

ZUR ERLANGUNG DES AKADEMISCHEN GRADES DES DOKTORS DER NATURWISSENSCHAFTEN (DR. RER. NAT.)

DER CHEMISCHEN FALKULTÄT

DER TECHNISCHEN UNIVERSITÄT DORTMUND

VORGELEGT VON

Regina Stöber, M.Sc.

DORTMUND 2016

1. GUTACHTER: PROF. DR. JAN G. HENGSTLER

2. GUTACHTER: PROF. DR. FRANK WEHNER

(2)
(3)

I

Für meine Familie

(4)
(5)

II

(6)
(7)

III

Table of contents

Summary ... VI Zusammenfassung ... VIII Abbreviations ... XI

1 Introduction ... 1

1.1 Critical aspects of drug-induced liver injury and models for hepatotoxicity prediction ... 1

1.2 Toxicogenomics for the identification of novel biomarkers of toxicity ... 2

1.3 Publically available transcriptomics databases – challenges and limitations ... 5

1.4 Aim of this work ... 6

2 Material and methods ... 7

2.1 Material ... 7

2.1.1 Technical equipment ... 7

2.1.2 Chemicals and kits ... 8

2.1.3 Consumables ... 9

2.1.4 Cell culture material and buffers ... 10

2.2 Methods ... 11

2.2.1 Cell culture of HepG2 cells ... 11

2.2.2 Cell culture of primary human hepatocytes ... 12

2.2.3 RNA sample collection and isolation procedure ... 14

2.2.4 cDNA synthesis ... 15

2.2.5 Quantitative Real Time PCR (qRT-PCR) ... 16

2.2.6 Cytotoxicity tests with the CellTiter-Blue® Cell Viability Assay ... 19

2.2.7 Statistical analysis ... 20

3 Results ... 25

3.1 Establisment of a toxicogenomics directory for compound-exposed primary human hepatocytes based on the Open TG-GATEs transcriptomics data ... 25

3.1.1 In silico characterization and curation of the Open TG GATES data ... 25

3.1.2 Identification and control of batch effects ... 26

3.1.3 Evaluation of data reproducibility across replicates ... 28

3.1.4 Number of deregulated genes per compound ... 29

(8)

IV 3.1.5 Exclusion of compounds following an implausible concentration progression 32

3.1.6 Reproduction of the gene expression effects observed by TG GATES in vitro .. 41

3.1.7 Characterization of unstable baseline genes ... 43

3.1.8 Detection of biological motifs ... 44

3.1.9 Stereotypic versus compound specific gene expression responses ... 47

3.1.10 Over representative gene ontology groups and transcription factor binding sides 62 3.1.11 Overlap of chemical-induced gene expression alterations and gene expression changes in liver diseases ... 66

3.2 Application of the toxicogenomics directory: Identification of biomarker candidate genes and their potential to predict human hepatotoxic blood concentrations. ... 68

3.2.1 Identification of peak plasma concentrations and selection of a concentration range 74 3.2.2 Identification of biomarker candidate genes according to the toxicogenomics directory ... 79

3.2.3 Prediction of hepatotoxic blood concentrations in vivo ... 87

4 Discussion ... 98

4.1 Establishment of a toxicogenomics directory for compound exposed hepatocytes 98 4.1.1 Stereotypic versus compound specific gene expression alterations and detection of biological motifs ... 99

4.1.2 Overlap with human liver disease genes ... 100

4.1.3 Unstable baseline genes ... 102

4.2 Application of the toxicogenomics directory: Identification of biomarker candidate genes and their potential to predict human hepatotoxic blood concentrations. ... 103

5 References ... 110

6 Appendix ... 127

6.1 Supplemental figures: ... 127

6.2 Supplemental tables ... 133

7 List of figures ... 142

8 List of tables ... 148

9 Publications ... 152

9.1 Articles ... 152

9.2 Book chapters ... 153

(9)

V

9.3 Guest editorials ... 154

9.4 Contribution on congresses ... 154

(10)
(11)

Summary

VI

Summary

Drug-induced liver injury represents one of the most critical issues during drug development and leads to failure of many drug candidates in preclinical or clinical studies. Currently, the common model for safety evaluation and human health risk assessment is repeated dose toxicity (RDT) testing in rodents. However, RDT studies require numerous animals and the capacity for this conventional testing is limited. There is an urgent need for the development of novel test systems, where complex in vivo processes and different mechanisms of toxicity can be addressed. In recent years, numerous research groups have focused on the identifica- tion and development of biomarkers of hepatotoxicity. In this context, genomic approaches are used to identify patterns in mRNA expression changes, referred to as toxicogenomics.

Emerging databases provide a vast amount of transcriptomics data from compound-exposed hepatocytes, as well as rodent livers. This large amount of publically available genome wide expression data provides valuable information for the identification and development of novel biomarkers of hepatotoxicity. However, a comprehensive analysis summarizing the key features of chemically-influenced gene expression has not yet been performed.

The first part of this thesis focusses on the definition of key principles of global expression alterations in compound-exposed hepatocytes. Therefore, genome wide expression data from the Open Toxicogenomics Project-Genomics Assisted Toxicity Evaluation System (TG- GATES) database were used. This database comprises gene array data from primary human hepatocytes that were incubated with 150 compounds for several time points and concen- trations. Before analyzing the structure of the database, a number of curation steps were performed to improve the data set. Genes were only considered to be up or down regulated when the mean alteration was at least 3 fold compared to the untreated control condition.

Furthermore, the concentration progression of each compound was analyzed and com-

pounds that followed an implausible concentration progression were excluded from the data

set. With the final optimized dataset, a toxicotranscriptomics directory was developed,

which indicates whether a particular gene is altered upon chemical exposure. If there are

gene expression changes, the type and number of compounds inducing this change could

also be identified. The directory further provides information on whether a gene is also al-

tered in human liver diseases, such as hepatocellular carcinoma (HCC), non-alcoholic steato-

hepatitis (NASH) or cirrhosis, thus implying in vivo relevance. Genes that are influenced by

the hepatocyte isolation and cultivation procedures are highlighted and defined as unstable

baseline genes. Finally biomarker candidates were chosen that are altered by a large set of

chemicals that simultaneously overlap with those deregulated in liver diseases, but not by

the hepatocyte isolation and cultivation procedures. Based on these criteria, the toxicoge-

nomics directory was used to identify a set of seven potential biomarker candidates: The

cytochrome P450 isoenzymes 1B1 (CYP1B1) and 3A7 (CYP3A7), the cytoskeletal protein tu-

bulin 2B (TUBB2B), sulfotransferase 1C2 (SULT1C2), the stress response gene FBXO32, regu-

(12)

Summary

VII lator of cell cycle (RGCC), and glucose-6 phosphate dehydrogenase (G6PD). These genes cov- er a broad range of toxicological motifs, such as the metabolism of xenobiotics, energy and lipid metabolism, cytoskeleton, cell cycle and protein degradation.

The second part of this thesis focusses on the applicability of the selected genes to predict human hepatotoxicity. In a pilot study, a biomarker and cytotoxicity-based in vitro system was established, which predicts human blood concentrations that are associated with an increased risk of hepatotoxicity. A set of 12 hepatotoxic compounds, as well as 9 non- hepatotoxic compounds were identified. The former are associated with an increased risk of hepatotoxicity when administered at therapeutic doses; whereas, the latter are considered harmless in the therapeutic concentration range. For each compound, a literature search was performed to identify the resulting blood concentrations from therapeutic doses.

HepG2 cells, as well as primary human hepatocytes were treated with each compound in a concentration range that included the peak plasma concentration identified for the thera- peutic dose, in addition to doses that resulted in a slightly cytotoxic concentration. Two readouts – biomarker expression and cytotoxicity tests – were used to identify critical con- centrations in vitro. The lowest observed effect concentrations (LOECs) in vitro were finally compared to peak plasma concentrations of therapeutic doses in vivo.

In HepG2 cells, the biomarker-based in vitro system was able to adequately discriminate be- tween the two sets of compounds. The prediction sensitivity improved in primary human hepatocytes, because the model was able to identify hepatotoxic effects at even lower con- centrations. The results revealed that for a large amount of compounds, the in vitro model precisely predicted human blood concentrations that are associated with an increased risk of hepatotoxicity. However, the model is not yet applicable to all compounds, because for many of them it still underestimates the risk of hepatotoxicity. Future studies should identify further biomarkers that are able to capture more compounds and allow a more precise pre- diction.

Based on the so far available biomarkers, the presented model allows for an approximation

whether a therapeutic dose would be associated with a high or a low risk of hepatotoxicity in

vivo. Although it is still in its developmental stage, the model shows promise as it identifies a

number of idiosyncratic hepatotoxic compounds, which are distinguishable from non-

hepatotoxic compounds. The clustering within the set of hepatotoxic or non-hepatotoxic

compounds allows the estimation of the hepatotoxic potential of an unknown compound. In

conclusion, the novel prediction system represents a promising tool to assess a putative risk

of hepatotoxicity for unknown compounds and provides valuable knowledge that contrib-

utes to, for example the ranking and prioritization of compounds in early drug development.

(13)

Zusammenfassung

VIII

Zusammenfassung

Eine der größten Herausforderungen bei der Entwicklung neuer Medikamente sind Chemika- lien-induzierte Leberschäden. Oftmals wird neben dem gewünschten therapeutischen Effekt auch Lebertoxizität beobachtet, wodurch vielversprechende Kandidaten während der vorkli- nischen und klinischen Phase scheitern oder auch häufig nach der Zulassung noch vom Markt genommen werden. In der gängigen Praxis werden zur Sicherheitseinstufung und Risi- kobewertung von Medikamenten vor allem Tiermodelle genutzt, bei welchen die Tiere nach wiederholter Applikation auf Anzeichen von Toxizität untersucht werden. Dieses Verfahren bedarf jedoch einer sehr großen Anzahl an Tieren, ist sehr kostenintensiv und übersteigt die Prüfkapazität für neue Substanzen um ein Vielfaches. Demnach stellt die Entwicklung neuar- tiger Testsysteme eine dringende Notwendigkeit dar.

In den letzten zwei Jahrzehnten konzentriert sich ein Großteil der Forschungsvorhaben auf die Identifizierung und die Entwicklung von Biomarkern, welche einen hepatotoxischen Ef- fekt frühzeitig signalisieren. In diesem Zusammenhang stellt die Entwicklung von –omics Technologien, insbesondere Toxicogenomics, einen prominenten Ansatz dar. Genomweite Analysen werden herangezogen, um Muster in Chemikalien-induzierten Genexpressionsver- änderungen zu detektieren. Transkriptomdaten von Substanz-exponierten Zellen und Nage- tier-Lebern sind in Datenbanken im Internet öffentlich zugänglich und bieten einen großen Informationspool für die Entwicklung genomischer Biomarker. Um diese umfangreichen Da- tenmengen jedoch optimal für die Entwicklung neuartiger Biomarker nutzen zu können, ist das Verständnis von Schlüsseleigenschaften Chemikalien-induzierter Genexpressionsverän- derungen von großem Vorteil. Dennoch gibt es bislang keine umfassenden Studien, die sich mit typischen Merkmalen Chemikalien-induzierter Transkriptionsveränderungen beschäfti- gen.

Um ein generelles Verständnis globaler Expressionsveränderungen in Substanz-exponierten Hepatozyten zu erlangen, beschäftigt sich der erste Teil dieser Doktorarbeit mit der Definiti- on von Schlüsselprinzipien, welche Chemikalien-induzierten Transkriptionsmustern unterlie- gen. Dazu wurden globale Expressionsstudien der öffentlichen Datenbank Toxicogenomics Project-Genomics Assisted Toxicity Evaluation System (TG-GATES) herangezogen, in welcher Gene Array Daten primärer humaner Hepatozyten von 150 getesteten Substanzen zusam- mengefasst sind. Um besagte Schlüsselmerkmale optimal herausarbeiten zu können, wurden zunächst einige Optimierungsschritte am Datensatz vorgenommen. Es wurden z.B. nur Gene als hoch- oder herunter reguliert betrachtet, wenn eine Deregulation im Vergleich zur unbe- handelten Kontrolle um mindestens den Faktor 3 vorlag. Weiterhin wurden die Konzentrati- onsverläufe aller Substanzen analysiert. Substanzen, die beispielsweise Gene bei einer nied- rigen, nicht jedoch einer höheren Konzentration deregulieren, weisen einen unlogischen Konzentrationsverlauf auf und wurden von der weiteren Analyse ausgeschlossen. Mit dem optimierten Datensatz wurde anschließend ein Toxicotranskriptom-Verzeichnis entwickelt.

Dieses gibt Auskunft darüber, ob ein Gen durch Chemikalien beeinflusst wird und wenn ja,

durch wie viele und welche Art von Substanzen. Weiterhin werden Gene gekennzeichnet,

(14)

Zusammenfassung

IX deren Expression auch in Leberkrankheiten wie Zirrhose, hepatozelluläres Karzinom oder bei einer nicht-alkoholischen Fettleber verändert ist. Ein derartiger Überlapp impliziert eine mögliche Relevanz des Gens in vivo und minimiert die Wahrscheinlichkeit, dass sich bei der Chemikalien-induzierten Expressionsveränderung um einen in vitro Artefakt handelt. Gene, welche durch die Isolierungs- und Kultivierungsbedingungen beeinflusst werden, sind eben- falls hervorgehoben.

Gene, welche von möglichst vielen unterschiedlichen Substanzen dereguliert werden, eben- falls in Leberkrankheiten verändert sind, jedoch nicht durch die Isolierungs- und Kultivie- rungsbedingungen beeinflusst werden, repräsentieren potentielle Biomarker-Kandidaten.

Basierend auf diesen Kriterien wurde das Toxicotranskriptom-Verzeichnis genutzt, um sieben mögliche Kandidaten zu identifizieren: Die Cytochrom P450 Isoenzyme CYP1B1 und CYP3A7, das zytoskeletale Protein Tubulin 2 B (TUBB2B), die Sulfotransferase SULT1C2, das Stress- induzierte Gen FBXO32, das Zellzyklus-regulierende Protein RGCC und das Gen der Glucose- 6-Phosphat Dehydrogenase (G6PD). Diese Gene decken eine Vielzahl möglicher Toxizitäts- mechanismen ab, nämlich den Metabolismus von Xenobiotika, den Energie- und Lipidstoff- wechsel, das Zytoskelett, den Zellzyklus und den Abbau von Proteinen.

Der zweite Teil dieser Arbeit konzentriert sich auf eine mögliche Anwendbarkeit der ausge- wählten Gene, um humane Hepatotoxizität vorher zu sagen. In einer Teststudie wurde ein Biomarker- und Zytotoxizität-basiertes in vitro System entwickelt, was die Vorhersage hu- maner Blutkonzentrationen ermöglicht, welche mit einem erhöhten Risiko für Lebertoxizität assoziiert sind. Dazu wurden 12 hepatotoxische sowie 9 nicht-hepatotoxische Substanzen ausgewählt. Hepatotoxische Substanzen weisen bei therapeutisch wirksamer Dosierung ein erhöhtes Risiko für Lebertoxizität auf, während bei nicht-hepatotoxischen Substanzen in die- ser Konzentrationsspanne keine Gefahr für einen Leberschaden besteht. Für alle Substanzen wurden im Rahmen einer Literaturrecherche die Plasmakonzentrationen einer therapeuti- schen Dosis identifiziert. HepG2 Zellen sowie primäre humane Hepatozyten wurden mit den jeweiligen Substanzen inkubiert, wobei sowohl therapeutisch wirksame, bis hin zu leicht zy- totoxischen Konzentrationen getestet wurden. Um die jeweils niedrigste Konzentration zu ermitteln, bei welcher in vitro ein hepatotoxischer Effekt auftritt, wurden sowohl Zytotoxizi- tätsexperimente durchgeführt, als auch die Expression der ausgewählten Biomarker Gene analysiert. Anschließend wurden diese kritischen Konzentrationen in vitro mit der Plasma- konzentration einer therapeutischen Dosis in vivo verglichen.

Sowohl für HepG2 Zellen, als auch in primären humanen Hepatozyten, konnte eine Separie-

rung hepatotoxischer und nicht-hepatotoxischer Medikamente beobachtet werden. Mit den

primären Zellen wurde zudem eine wesentlich sensitivere Vorhersagbarkeit für einen mögli-

chen Leberschaden erzielt, da hepatotoxische Effekte in vitro bereits bei niedrigeren Kon-

zentrationen auftraten. Erste Ergebnisse zeigen, dass das beschriebene in vitro Modell be-

reits für eine große Anzahl an Substanzen humane Blutkonzentrationen relativ genau vor-

hersagen kann, bei denen ein erhöhtes Risiko für einen Leberschaden besteht. Dennoch ist

das Modell noch nicht vollständig ausgereift und für alle Substanzen anwendbar, da es das

Risiko einer hepatotoxischen Wirkung für manche Medikamente noch unterschätzt. Zukünf-

tige Experimente werden sich mit der Identifizierung weiterer Biomarker beschäftigen, die

(15)

Zusammenfassung

X einen weiteren Bereich an Substanzen abdecken und eine genauere Vorhersagbarkeit er- möglichen.

Basierend auf den bisher vorliegenden Biomarkern ist das entwickelte in vitro Modell in der

Lage, einzuschätzen, ob eine therapeutisch wirksame Dosis eines Medikaments mit einem

hohen oder einem niedrigen Risiko für einen Leberschaden einhergeht. Die Gruppierung

innerhalb der Klasse hepatotoxischer oder nicht-hepatotoxischer Substanzen kann dafür

genutzt werden, das Risiko für einen hepatotoxischen Effekt einer noch unbekannten Sub-

stanz abzuschätzen. Demnach stellt das im Rahmen dieser Arbeit entwickelte Modell einen

erfolgreichen Ansatz dar, um bei der Entwicklung neuer Medikamente vielversprechende

Kandidaten zu sondieren und somit das Risiko für einen möglichen Leberschaden zu mini-

mieren.

(16)

Abbreviations

XI

Abbreviations

AA Allyl alcohol

ABC ATP-binding cassette

ADME Absorption, distribution, metabolism, excretion AFB1 Aflatoxin B1

Akt Protein kinase B

ALDH Alcohol dehydrogenase ALT Alanine aminotransferase ALP Alkaline phosphatase ANGPTL4 Angiopoietin-like 4 APAP Acetaminophen

ASP Aspirin

AST Aspartate aminotransferase ATP Adenosine triphosphate

ATF3 Activating transcription factor 3 AXL AXL receptor tyrosine kinase

BEA Bromoethylamine

BCL2A1 BCL2-related protein A1

BPR Buspirone

Bsep Bile salt export pump

Ca Calcium

CBX4 E3 SUMO-protein ligase CBX4

CBZ Carbamazepine

CCL2 Chemokine (C-C motif) ligand 2 CCl 4 Carbon tetrachloride

CCNE2 Cyclin E2

CDK Cycline dependent kinase

CDKN2C Cyclin-Dependent Kinase Inhibitor 2C cDNA Coding deoxyribonucleic acid

CHL Chlorpheniramine

CHX Cycloheximide

CLON Clonidine CLRN Clarin

CoA Coenzyme A

CO 2 Carbon dioxide

CPS Carbamoyl phosphatate synthase

Ct Cycle threshold

CUX2 Cut-Like Homeobox 2

CYP Cytochrome P450 enzymes

(17)

Abbreviations

XII DEPC Diethylpyrocarbonate

DFN Diclofenac

DHFR Dihydrofolate reductase DILI Drug-induced liver injury

DMEM Dulbecco’s Modified Eagle’s Medium DMSO Dimethyl sulfoxide

DNA Deoxyribonucleic acid Dntp Di-deoxyribonucleic acid

EDTA Ethylene diamine tetra acidic acid EFNA1 Ephrin-A1

EGTA Ethylene glycol tetraacetic acid EtOH Ethanol

FAM Famotidine FBXO32 F-Box Protein 32

FC Fold change

FCS Fetal calf serum FDR False discovery rate

FRET Fluorescence resonance energy transfer

g Standard gravity

g Gram

G6PD Glucose-6-hosphate dehydrogenas

GAPDH Glycerinaldehyd-3-phosphat-Dehydrogenase

GATA Erythroid transcription factor also known as GATA-binding factor 1 GDF15 Growth differentiation factor 15

GO Gene Ontology

h Hour

H 2 O Water

HCC Hepatocellular carcinoma HNF4 Hepatocyte nuclear factor 4 HNMT Histamine N-methyl transferase HOGA1 4-hydroxy-2-oxoglutarate aldolase HSPA6 Heat shock protein 6

HYZ Hydroxyzine

ID1 Inhibitor Of DNA Binding 1 INAH Isoniazid

INSIG Insulin-induced gene

KC Ketoconazole

KCl Potassium chloride

KCNJ8 Potassium channel, inwardly rectifying subfamily J, member 8

kg Kilogram

KH 2 PO 4 Potassium dihydrogen phosphate

L Liter

(18)

Abbreviations

XIII LAB Labetalol

LEV Levofloxacine

LOEC Lowest observed effect concentration LPS Lipopolysaccharide

M Molar

MEF2 Myocyte enhancer factor 2 MEL Melatonin

mg Milligram

min Minute

mL Milliliter

mM Millimolar

mRNA Messenger RNA NaCl Sodium chloride

NADPH Nicotinamide adenine dinucleotide phosphate NaH 2 PO 4 Sodium dihydrogen phosphate

NaOH sodium hydroxide

NASH Non-alcoholic steatohepatitis NAT N-acetyltransferase

NF-kB Nuclear factor kappa B NFT Nitrofurantoin

NIM Nimesulide

nM Nanomolar

n-Myc n-Myc proto-oncogenic transcription factor NREP Neuronal regeneration related protein NSAID Non-steroidal anti-inflammatory drug

PBLD phenazine biosynthesis-like protein domain containing protein PBS Phosphate buffered saline

PCA Principal component analysis

PCK Phosphoenolpyruvate carboxykinase PCR Polymerase chain reaction

PDK Pyruvate dehydrogenase kinase

PhB Phenylbutazone

PHH Primary human hepatocytes

PHO Phorone

PI3K Phosphoinositide 3 kinase

pM Picomolar

PMZ Promethazine

PPL Propranolol

PPM1L protein phosphatase, Mg2+/Mn2+ dependent 1L

PS Probe set

qRT-PCR Quantitative real time PCR

RAR Retinoic acid receptor

(19)

Abbreviations

XIV RDT Repeated dose toxicity

Rep Replicate

RGCC Regulator of cell cycle

RIF Rifampicin

RMA Robust Multi-Array Average RNA Ribonucleic acid

RNA-seq RNA sequencing

ROS Reactive oxygen species RXR Retinoic X receptor

sec Second

SD Standard deviation SLC Solute carrier SULT Sulfotransferase SV Selection value

TCGA The Cancer Genome Atlas THRSP Thyroid hormone responsive TFBS Transcription factor binding sides

TG-GATES Toxicogenomics Project-Genomics Assisted Toxicity Evaluation System TMD Trimethadione

TNFSF Tumor necrosis factor superfamily TOP2A Topoisomerase 2

TRM22 Putative transposase of insertion sequence ISRm22 protein TUBB Tubulin

TXNIP Thioredoxin interacting protein TZM Triazolam

U Unit

UGT2B15 UDP glucuronosyltransferase 2 family, polypeptide B15 VPA Valproic acid

WDR72 WD Repeat Domain 72

ZCCHC6 Zinc finger, CCHC domain containing 6

µg Microgram

µM Micromolar

(20)
(21)

Introduction

1

1 Introduction

1.1 Critical aspects of drug-induced liver injury and models for hepatotoxici- ty prediction

The liver represents the central organ of metabolism and detoxification in the body (Bandara and Kennedy 2002). Its primary functions comprise intermediary and energetic metabolism, as well as biotransformation of various substances, which makes the liver the major target of drug toxicity (Gomez-Lechon et al. 2010). Consequently, drug-induced liver injury (DILI) is one of the most critical issues during drug development and leads to failure of many drug candidates during preclinical or clinical studies (Jaeschke et al. 2002). In addition, hepatotox- icity is the main reason for drug withdrawal from the market. It is a reported side effect of more than 900 drugs and is responsible for 5 % of all hospital admissions and for 50 % of all acute liver failures, (Ostapowicz et al. 2002; Wilke et al. 2007; Pandit et al. 2012). Unfortu- nately, up to 10 % of DILI patients will develop jaundice and eventually die (Navarro and Senior 2006). For this reason, a major goal of the pharmaceutical industry is to market safer drugs with less adverse effects, predictable pharmacokinetic properties and quantifiable drug-drug interactions. In order to achieve this, the evaluation of potential hepatotoxic ef- fects represents a critical step in drug development (Gomez-Lechon et al. 2010).

During the last decades, several animal models have been used to study cytological, physio- logical, metabolic and morphological endpoints to illustrate clinical and pathophysiological injury (Suter et al. 2004). Among the most frequently used tools in preclinical evaluation are two year repeated dose toxicity rodent studies, as well as conventional toxicity tests, which focus on transaminase levels and histopathological findings (Cheng et al. 2011). Currently, animal in vivo studies represent the best model to mimic the physiological microenviron- ment in humans, but do not allow high-throughput screenings with a large number of com- pounds. For practical, as well as ethical reasons, only a small number of preselected com- pounds can be examined in vivo (Cheng et al. 2011). In addition, screening large sets of chemicals is limited due to high costs, and the large number of animals and extensive time needed to conduct such experiments.

However, due to interspecies differences in hepatocellular function, pharmacokinetics, as

well as administration, distribution, metabolism and excretion (ADME) information for a par-

ticular test compound or drug gained from animal models cannot simply be transferred to

the human system. It is estimated that preclinical evaluation of drug candidates using con-

ventional clinical pathology and animal testing fails to detect up to 40% of potentially hepa-

totoxic drugs in humans (Aubrecht et al. 2013). Since human in vivo studies cannot be per-

formed for ethical reasons, human hepatocyte in vitro systems are frequently applied to

mimic the human in vivo situation. These in vitro models generally comprise immortalized

human hepatic cell lines, such as HepG2 or HepaRG cells, primary hepatocytes, liver slices,

stem cell derived hepatocytes and 3D systems, such as liver spheroids. Furthermore, co-

(22)

Introduction

2 cultures with non-parenchymal liver cells are used to enable cross-talk between hepatocytes and further liver cells, thus stabilizing hepatic functionality and thereby minimizing discrep- ancies between in vitro and in vivo models (Jiang et al. 2015; Nibourg et al. 2012). These sys- tems offer the possibility to investigate specific parameters in a controlled environment (Tuschl et al. 2008). On the other hand, in vitro test systems do not fully reflect systemic in- fluences and hepatocellular toxic effects, such as transaminase induction and toxicity related to in vivo metabolites or mitochondrial dysfunction (Cheng et al. 2011).

To reduce the number of animals and to minimize the risk of hepatotoxicity in humans, the early detection of drug-induced hepatotoxicity is essential before compounds are tested in animals or clinical trials (O'Brien et al. 2006). In the current clinical practice, liver injury is detected by measuring circulating molecules, indicating alterations in liver function and ho- meostasis, or changes in tissue or cell integrity (Aubrecht et al. 2013). These biomarkers en- compass for example, total bilirubin, total bile acids, alanine- (ALT) and aspartate ami- notransferase (AST) levels, alkaline phosphatase (ALP), lactate dehydrogenase and

-glutamyl transpeptidase concentrations (Aubrecht et al. 2013; Giannini et al. 2005; Navarro and Senior 2006). However, these clinical biomarkers detect liver injury only after a signifi- cant injury has already occurred, but not before liver function is compromised. Total biliru- bin levels for example, increase only after the liver has lost approximately half of its excreto- ry capacity (Navarro and Senior 2006). In general, the listed biomarkers are often sensitive, but not necessarily specific for the target organ. Some markers are more sensitive than oth- ers or are elevated by non-hepatic injury. For example, ALT is not necessarily specific for liver injury and ALT levels do not always correlate to the extent of liver injury (Sun et al. 2014;

Yang et al. 2012).

Since the currently-available toxicity test systems are obviously not sufficient to predict hu- man hepatotoxicity, and because current serum markers indicate hepatotoxicity only at a progressed state of liver injury, there is an urgent need for novel tools to predict human hepatotoxicity. Ideally, new test systems should be robust, cheaper, faster and more conven- ient for screening than the so far available test systems and cover even complex in vivo pro- cesses, such as ADME and different mechanisms of toxicity. The overall aim of this work is therefore to identify novel biomarkers which are organ specific and can identify the hepato- toxic potential of compounds prior to the development of clinical signs. Optimally, these biomarkers are applicable in in vitro systems to predict the risk of hepatotoxicity of a particu- lar compound in vivo.

1.2 Toxicogenomics for the identification of novel biomarkers of toxicity

Technological advances in the field of omics technologies have shown promise in the area of

biomarker development. Genomics, proteomics and metabolomics play an important role in

uncovering novel biochemical pathways and are used in preclinical animal studies, as well as

clinical investigations to evaluate markers of hepatotoxicity in tissues and in easily-obtained

body fluids, such as urine or serum (Yang et al. 2012).

(23)

Introduction

3 While proteomics are used as a tool to identify cytokines and cellular stress markers of hepa- totoxicity, metabolomics analyze for example, bile acid metabolism or hepatic glutathione depletion (Yang et al. 2012). Another important aspect is the use of genomics, particularly toxicogenomics to get insight into the molecular mechanisms of drug toxicity.

Toxicogenomics combines conventional toxicology with genomics and bioinformatics to study adverse effects of chemicals. Genome wide expression data are analyzed for gene ex- pression changes that influence, predict or help to define drug toxicity (Suter et al. 2004).

Although the relationship between changes of gene expression and adverse effects in vivo are not yet fully understood, the evaluation and characterization of differentially expressed genes in chemically-exposed cells can be used to predict toxicologic outcomes and to identi- fy mechanisms of action. Several studies demonstrate that compounds, which cause the same toxic end points, also generate a unique gene expression pattern (Gomez-Lechon et al.

2010). For example, a previous study successfully showed the usefulness of clustering hepa- totoxins by gene expression profiling (Ellinger-Ziegelbauer et al. 2008). In this study gene expression profiles of drug-exposed rat livers were analyzed and the authors were able to distinguish between genotoxic and non-genotoxic carcinogens. Another study has shown that gene expression profiles can discriminate between hepatotoxic and non-hepatotoxic compounds in rats (Zidek et al. 2007). This study identified a set of marker genes, which re- flected typical hepatotoxic responses and allowed the prediction of compound classes. Fur- thermore, differently acting hepatotoxins can be distinguished according to their gene ex- pression profile. This was for example shown by a research group who identified highly dis- criminating genes which differentiated between enzyme inducing compounds and peroxi- some proliferators in exposed rat livers (Hamadeh et al. 2002a; Hamadeh et al. 2002b).

However, although the results of the aforementioned studies are promising, it is unclear how relevant biomarkers identified in in vivo animal models are representative of the situa- tion in the human liver.

Besides the rodent in vivo studies, other groups focused on toxicogenomics-based hepato- toxicity prediction in human hepatic cell lines. Cha et al. identified 77 specific genes, which may be indicative of early, as well as the later onset of non-steroidal anti-inflammatory drug (NSAID) - induced hepatotoxicity in HepG2 cells (Cha et al. 2010). A set of hepatotoxic and non-hepatotoxic compounds were used to validate the model and 100 % prediction accuracy was achieved. However, gene expression of HepG2 cells does not represent the real situa- tion of gene expression in the human liver in vivo and the reliability of the prediction system has not yet been confirmed in primary hepatocytes or in vivo studies (Godoy et al. 2013).

Currently, the best available modeling systems to identify novel biomarkers for the predic- tion of hepatotoxicity include a combination of in vivo animal data and data from exposed human cell lines and cultivated primary cells in vitro. It is a long term goal to identify bi- omarkers in in vitro systems, which are capable to predict mechanisms of toxicity in vivo.

However, this requires comprehensive knowledge of ideally all mechanisms leading to ad- verse effects, as well as an in vitro system that reflects critical mechanisms of in vivo toxicity.

Since the link between gene expression alteration and adverse effects in vivo is not com-

pletely understood, it is of great importance to understand which of the responses observed

(24)

Introduction

4 in the in vitro systems are relevant for the situation in vivo. It was shown that clusters of genes are up or down regulated simply by the hepatocyte isolation and cultivation proce- dure (Zellmer et al. 2010). Consequently, this response represents a pure in vitro artifact.

Likewise, it is reported that cultivated primary hepatocytes become resistant to apoptosis in culture, which might result in a repression of certain in vivo relevant responses (Godoy et al.

2009; Godoy et al. 2010a; Godoy et al. 2010b). In contrast, a systematic comparison of gene expression profiles from exposed rat livers in vivo and cultivated rat hepatocytes in vitro re- vealed a good correlation for some cellular stress, as well as DNA damage and metabolism associated genes (Heise et al. 2012).

To bridge the gap between biomarkers of toxicity identified from in vitro systems and their potential function in vivo, one research group focused on a set of genes that are associated with elevated serum ALT levels after exposure to six heterogeneous compounds (Cheng et al. 2011). Thirty-two genes were used as a multi gene expression signature to predict hepa- totoxicity in rats in vivo, and in HepG2 cells, as well as primary human hepatocytes in vitro.

Different degrees of toxicity in response to drug concentrations were evaluated, allowing the estimation of the general hepatotoxic potential of a compound and its toxic concentration.

However, pharmacokinetic differences between the in vivo and in vitro systems might lead to discrepancies in the drug-induced gene expression alterations (Schug et al. 2013). In gen- eral it is recommended that in vitro concentrations are selected, which reflect critical con- centrations in vivo. For instance, physiologically-based pharmacokinetic (PBPK) models are used to predict doses that result in critical concentrations in the target cells in vivo. One study was able to show that the gene expression pattern induced by a histamine 3 receptor inverse agonist was comparable between exposed rat livers in vivo and corresponding con- centrations in primary human hepatocytes in vitro, representing the maximal blood concen- tration (Roth et al. 2011). The group focused on genes that were critical for the hepatotoxici- ty induced by the compound, and was able to extrapolate the toxic effects to an unknown compound of the same compound class. This example demonstrates the identification of specific biomarkers for a selected compound and the applicability of the toxicogenomics tool to predict hepatotoxicity for uncharacterized compounds. Nevertheless, the identification of predictive biomarkers of toxicity remains challenging, since different compounds may induce different forms of liver toxicity (such as metabolic perturbations, cell death or mitochondrial dysfunction), which could result in unique gene expression profiles (Cheng et al. 2011).

Ideally, novel biomarkers of hepatotoxicity will cover a broad range of toxic mechanisms to

capture as many compounds as possible. To identify potentially hepatotoxic drugs in preclin-

ical studies, these biomarkers should give alerts independent of the chemical structure or

the toxic mode of action. To evaluate which biomarker candidate genes might be of interest,

it is critical to obtain a comprehensive overview of chemically-induced gene expression al-

terations.

(25)

Introduction

5

1.3 Publically available transcriptomics databases – challenges and limita- tions

In recent years, several public databases, such as DrugMatrix, diXa and Toxicogenomics Pro- ject-Genomics Assisted Toxicity Evaluation System (TG-GATES), have emerged, providing gene array data of chemically-exposed hepatocytes and other cells from different organs (Jiang et al. 2015). All three databases encompass in vitro and in vivo transcriptomics data of compound-exposed rat organs or cultivated primary cells with multiple doses and time points (Chen et al. 2012; Hendrickx et al. 2015). Hundreds of compounds acting via various mechanisms were tested, including therapeutic, industrial, and environmental chemicals at both non-toxic and toxic doses. In addition to the transcriptomics data, some of the data- bases also provide additional information for each compound, also collecting including tox- icity data and relevant sources from literature, together with available proteomics, metabo- lomics and epigenetics data (Hendrickx et al. 2015).

The scope of this thesis utilizes the transcriptomics data set of the publically available data- base, Open-TG-GATE. The database consists of transcriptomics data from 158 chemicals tested in cultivated primary human and primary rat hepatocytes, as well as in vivo data of exposed rat livers. Hepatotoxic and non-hepatotoxic drugs and some experimental hepato- toxic compounds were tested at three different time points, in three different concentra- tions, with the highest dose approaching cytotoxicity.

Although the vast amount of transcriptomics data may provide useful insights into various

toxic mechanisms, the handling of this huge amount of data is not trivial. On the one hand,

working with large data sets, especially when generated by several research consortia with

independent contributors, is challenging because experimental errors and artifacts cannot

be excluded (Grinberg et al. 2014). Having to combine several analytical batches, which will

undoubtedly contain experimental errors in a subset of samples, is often unavoidable, and

may lead to misinterpretation of the data. Exclusion of implausible data may improve the

reliability of the Open TG GATEs transcriptomics data and form a basis for the identification

of novel biomarkers of toxicity. On the other hand, the extraction of specific biomarkers of

toxicity from such a large amount of data requires a general understanding, not only of pos-

sible mechanisms of action, but also of the typical changes in the cells as they undergo

chemically-induced stress. Understanding the patterns of up or down regulated genes of

chemically-exposed cells in vitro could provide valuable information for the extraction of

potential biomarker genes and for the identification of toxic mechanisms. However, despite

the frequent use of the previously mentioned in vitro test systems, a comprehensive analysis

of genes altered by chemicals in vitro has not been performed. Therefore, in order to obtain

a better understanding of global gene expression profiles after chemical exposure, this thesis

summarizes key features of chemically-influenced genes and provides a guideline for the

identification of novel biomarkers of hepatotoxicity.

(26)

Introduction

6

1.4 Aim of this work

The aim of this thesis was to establish a guideline to describe how transcriptomics data of large data sets can be used to extract specific biomarkers of human hepatotoxicity.

For this purpose, genome wide expression data obtained from chemical-exposed primary human hepatocytes from the Open TG-GATES database is considered. The first part of this thesis focusses on the in silico characterization and curation of the Open TG-GATES data- base. To improve the reliability of the data, batch effects are identified and controlled, the data reproducibility across replicates is assessed and compounds following an implausible concentration are excluded from further analysis. With the curated data set, comprehensive bio-statistical analysis is performed and a novel toxicogenomics directory is established. The goal of establishing such a directory is to improve the understanding of how genes are typi- cally altered by chemicals in vitro, which may contribute towards the identification of poten- tial biomarkers of toxicity.

Since the heterogeneity of compounds involves various mechanisms of toxicity, it was as- sumed that the database comprised a comprehensive overview of all genes that could be deregulated in primary human hepatocytes after compound exposure. To enable the extrac- tion of potential biomarker candidate genes, the structure of chemical-induced gene expres- sion is analyzed and the altered genes are categorized using the following strategy:

 Identification of genes which are altered by many compounds. A change in the ex- pression of these frequently altered genes represents a stereotypical response to cel- lular stress.

 Identification of genes which are also associated with human liver diseases.

 Exclusion of unstable baseline genes, which are altered because of the hepatocyte isolation and cultivation conditions.

 Identification of biological motifs to cover the most relevant toxic mechanisms.

Based on these key principles, the second part of the thesis focusses on the identification of novel biomarkers of human hepatotoxicity. Two different in vitro systems, namely HepG2 cells and cultivated primary human hepatocytes will be used to analyze the expression of the selected marker genes and to evaluate their applicability to predict human hepatotoxic blood concentrations that are associated with an increased risk of hepatotoxicity in vivo.

A set of hepatotoxic, as well as non-hepatotoxic chemicals is used to validate the expression

of the selected biomarkers at concentrations, which reflect critical, as well as therapeutic

doses in vivo. In the event that the set of biomarkers is able to differentiate between hepa-

totoxic and non-hepatotoxic compounds at therapeutic doses, the novel prediction system

will provide a promising tool to identify hazardous compounds during early screening pro-

cesses in drug development. Furthermore, predicting the blood concentrations that are as-

sociated with an increased risk of hepatotoxicity in vivo will provide a valuable method to

evaluate the safety of novel drugs at therapeutic doses in humans.

(27)

Material and methods

7

2 Material and methods

2.1 Material

2.1.1 Technical equipment

Table 2.1: Technical equipment in the laboratory

Equipment Company

Balance EW, Kern

Bunsen Burner IBS Fireboy Plus, Integra Bioscences Bright Field Microscope Primo Vert, Zeiss, Software ZEN from Zeiss

Casy

Innovatis

Centrifuge Megafuge 1.0R, Thermo Scientific

Centrifuge Centrifuge 5415 R, Eppendorf

Centrifuge with cooling function 5424R, Eppendorf Centrifuge with cooling function Biofuge Fresco, Heraeus

Incubators CO

2

Incubator C150 R Hinge 230, Binder Laminar Flow Hood Electronics FAZ 2, Waldner

Magnetic stirrer IKAMAG RCT, IKA

Microcentrifuge Mini Spin Plus, Eppendorf

Microscope CCD-Camera AxioCam ICm 1

Minicentrifuge FVL-2400N Combi-Spin, Biosan

pH meter CG 842, Schott

Pipetteboy Integra

Pipettes Research and Reference, Eppendorf

Infinite M200 Pro Plate reader Tecan

Precision balance EW 150-3M, Kern

Real Time PCR System 7500 Real-Time PCR System, Applied Biosystems Real Time PCR System 7900 HT, Applied Biosystems

Sonicator Bandelin, SONOPLUS

Spectrometer NanoDrop 2000, Thermo Scientific

Thermocycler TGRADIENT, Biometra

Vacuum pump Diaphragm Vacuum Pump, Vacuumbrand

Vortex Vortex-Genie 2, Bender&Hobein

Water purification system Maxima Ultra-Pure Water, ELGA

Waterbath GFL 1083, Gesellschaft für Labortechnik

(28)

Material and methods

8 2.1.2 Chemicals and kits

Table 2.2: Compounds and kits

Compound Company Catalog number

2-Propanol Carl Roth, Karlsruhe, Germany 7590.1

Acetaminophen Sigma-Aldrich Corp., St. Louis, MO, USA A7085

Acetic acid Carl Roth, Karlsruhe, Germany 3738.5

Aspirin Sigma-Aldrich Corp., St. Louis, MO, USA A5376

Buspirone Sigma-Aldrich Corp., St. Louis, MO, USA B7148

Carbamazepine Sigma-Aldrich Corp., St. Louis, MO, USA C4024

Cell Titer Blue Assay Promega G8081

Chloroform Carl Roth, Karlsruhe, Germany 7331.2

Chlorpheniramine Sigma-Aldrich Corp., St. Louis, MO, USA C3025

Clonidine Sigma-Aldrich Corp., St. Louis, MO, USA C7897

DEPC sterile water Invitrogen

Diclofenac Sigma-Aldrich Corp., St. Louis, MO, USA D6899

Disodium hydrogen phosphate Carl Roth, Karlsruhe, Germany T876.2

Ethanol VWR Chemicals, Germany 20821.33

Famotidine Sigma-Aldrich Corp., St. Louis, MO, USA F6889

High Capaccity cDNA Reverse Transcription Kit Applied Biosystems 4368813 Hydroxyzine Sigma-Aldrich Corp., St. Louis, MO, USA H8885

Isoniazid Sigma-Aldrich Corp., St. Louis, MO, USA I3377

Ketoconazole Sigma-Aldrich Corp., St. Louis, MO, USA K1003

Labetalol Sigma-Aldrich Corp., St. Louis, MO, USA L1011

Levofloxacin Sigma-Aldrich Corp., St. Louis, MO, USA 40922

Melatonin Sigma-Aldrich Corp., St. Louis, MO, USA M5250

Nimesulide Sigma-Aldrich Corp., St. Louis, MO, USA N1016

Nitrofurantoin Sigma-Aldrich Corp., St. Louis, MO, USA N7878 Phenylbutazone Sigma-Aldrich Corp., St. Louis, MO, USA P8386

Potassium chloride Fluka Chemie AG, Switzerland 60129

Potassium dihydrogen phosphate Merk, Darmstadt, Germany 1.04873.1000 Promethazine Sigma-Aldrich Corp., St. Louis, MO, USA P4651

Propranolol Sigma-Aldrich Corp., St. Louis, MO, USA P0884 Qiazol

Lysis Reagent Qiagen Sciences, Maryland, USA 79306

Rifampicin Sigma-Aldrich Corp., St. Louis, MO, USA R3501

Sodium chloride Carl Roth, Karlsruhe, Germany 3957.2

Sodium hydroxid Merk, Darmstadt, Germany 1.06482

Valproic acid Sigma-Aldrich Corp., St. Louis, MO, USA PHR1061

(29)

Material and methods

9 2.1.3 Consumables

Table 2.3: Consumables

Compound Company Catalog number

Biosphere Filtered Tip, 1000uL Sarstedt, Numbrecht, Germany 70.762.211 Biosphere Filtered Tip, 100uL Sarstedt, Numbrecht, Germany 70.760.212 Biosphere Filtered Tip, 200uL Sarstedt, Numbrecht, Germany 70.760.211 Biosphere Filtered Tip, 20uL Sarstedt, Numbrecht, Germany 70.1116.210

Cell culture microtiter plate, 96 well Greiner bio-one 655986

Cell Scraper, 25cm Sarstedt, Numbrecht, Germany 83.183

Falcon tube, 15mL Sarstedt, Numbrecht, Germany 62.554.512

Falcon tube, 50mL Sarstedt, Numbrecht, Germany 62.547.254

Parafilm Wrap Cole-Parmer, Kehl/Rhein, Germany PM-992

Pipette Tips, 1000uL Sarstedt, Numbrecht, Germany 70.762

Pipette Tips, 200uL Sarstedt, Numbrecht, Germany 70.760.002

Pipette Tips, 20uL Sarstedt, Numbrecht, Germany 70.1116

RNase-free Microfuge Tubes 1.5 mL Ambion, Thermo Fischer Scientific, USA AM12400 RNaseZap® RNase Decontamination Solution Ambion, Thermo Fischer Scientific, USA AM9780/AM9782

SafeSeal 0.5mL microtube Sarstedt, Numbrecht, Germany 72.699

SafeSeal 1.5mL micotube Sarstedt, Numbrecht, Germany 72.706

SafeSeal 2.0mL microtube Sarstedt, Numbrecht, Germany 72.695.500 Serological Pipette, 10mL Sarstedt, Numbrecht, Germany 86.1254.001 Serological Pipette, 25mL Sarstedt, Numbrecht, Germany 86.1685.001 Serological Pipette, 5mL Sarstedt, Numbrecht, Germany 86.1253.001 Tissue Culture Plate Flat-Bottom 12-Well Plate VWR Chemicals, Germany 734-2324 Tissue Culture Plate Flat-Bottom 24-Well Plate Sarstedt, Numbrecht, Germany 83.1836

Tissue Culture Plate Flat-Bottom 6-Well Plate Sarstedt, Numbrecht, Germany 83.1839

Vacuum Filtration Unit, 0.22um, 250mL Sarstedt, Numbrecht, Germany 83.1822.001

(30)

Material and methods

10 2.1.4 Cell culture material and buffers

Table 2.4: Cell culture supplies

Compound Company Catalog

number

Casyton solution Roche Diagnostics GmbH, Manheim 5651808001

Collagen lyophilize (rat-tail), 10mg Roche Diagnostics GmbH, Manheim 11171179001 Dexamethason Sigma-Aldrich Corp., St. Louis, MO, USA D4902-25MG Dimethyl sulfoxid (DMSO) Sigma-Aldrich Corp., St. Louis, MO, USA 472301 DMEM low glucose 1.0 g/L 10x BioConcept, Allschwil, Switzerland 1-25K03-I Dulbecco's modified eagle's medium (DMEM) PAN Biotech GmbH, Aidenbach, Germany P04-04500

Gentamicin PAN Biotech GmbH, Aidenbach, Germany P06-13001

Insulin supplement (ITS) Sigma-Aldrich Corp., St. Louis, MO, USA 3146 Penicillin/Streptomycin PAN Biotech GmbH, Aidenbach, Germany P06-07100 Sera Plus (Special Processed FBS) PAN Biotech GmbH, Aidenbach, Germany 3702-P103009

Stable L-Glutamin PAN Biotech GmbH, Aidenbach, Germany P04-82100 Trypan blue solution Sigma-Aldrich Corp., St. Louis, MO, USA T8154

Trypsin/EDTA Sigma-Aldrich Corp., St. Louis, MO, USA P10-023100 William's E medium PAN Biotech GmbH, Aidenbach, Germany P04_29510

2.1.4.1 Phosphate buffered saline (PBS) buffer for cell culture For 5 L 10x PBS:

KCl 10 g

KH 2 PO4 10 g NaCl 400 g Na 2 HPO4 46 g

All reagents were dissolved in double distilled water and the pH was adjusted to pH 7.4. Af- terwards the buffer was sterile filtered. For application in the cell culture, 10x PBS was dilut- ed to 1x PBS with double distilled water and autoclaved before usage.

2.1.4.2 HepG2 cell line

HepG2 liver cells were purchased from ATCC LGC Standards, product number HB-8065. The

cell line was generated from a 15 year old Caucasian male with hepatocellular carcinoma.

(31)

Material and methods

11

2.2 Methods

2.2.1 Cell culture of HepG2 cells 2.2.1.1 Cultivation of HepG2 cells

HepG2 cells were cultivated in Dulbecco's modified eagle's medium (DMEM) containing 4.5 % glucose, 1 % penicillin/streptomycin mixture and 10 % heat inactivated FCS. The FCS heat inactivation was performed at 56 °C for 30 minutes in a water bath. The cells were seeded in conventional T75 or T175 flask and kept at 37°C with constant humidity and 5 % CO 2 content.

2.2.1.2 Thawing and freezing HepG2 cells

For thawing, the frozen cell suspension was thawed in a water bath (37 °C) and immediately transferred into a Falcon tube. Afterwards the suspension was diluted in 7-8 mL medium and centrifuged for 5 minutes at 600 rpm at room temperature to remove the freezing medium.

The cell pellet was re-suspended in 1 mL medium and given into a T75 cell culture flask with 9 mL medium.

For storage, cells were preserved in freezing media containing the regular media plus 10 % DMSO. Cells were usually frozen when reaching 80-90 % confluency. The cells were tryp- sinized by adding 1 mL trypsin per T75 flask or 2 mL per T175 flask and subsequently re- suspended in 5 mL (for T75 flask) or 10 mL media (for T175 flasks). The cell suspension was then transferred into a Falcon tube and centrifuged at 800 xg for 5 minutes to form a clear pellet. The supernatant was aspirated and the cells were re-suspended in freezing media (3 mL per T75 flask, 6 mL per T175 flask). 1 mL cryo vial aliquots were prepared and kept on ice for 20 minutes before storage at -80°C. For long time incubation the cells were stored in liquid nitrogen.

2.2.1.3 Passaging HepG2 cells

Upon 80-90 % confluency, the HepG2 cells were either sub-cultured or seeded in multi well

plates for further experiments. For splitting, the cells were washed once with 10 mL sterile

PBS, the PBS was aspirated and 4 mL Trypsin/EDTA were added. The cells were incubated for

7 minutes in Trypsin/EDTA at 37°C in the incubator to detach from the plastic surface. The

enzymatic reaction was stopped by adding 20 mL of warm cultivation medium. The trypsin

was removed by centrifugation at 600 rpm for 5 minutes at room temperature. The obtained

cell pellet was re-suspended initially in 1 mL cultivation medium and gently pipetted up and

down with a 1 mL tip of an Eppendorf pipette. Subsequently the dense cell suspension was

diluted with further 9 mL medium and distributed 1:3 or 1:10 into new T175 cell culture

flasks. In a total volume of 25 mL, cells were kept at 37°C until 80-95 % confluency was

reached again.

(32)

Material and methods

12 2.2.1.4 Seeding and treatment of HepG2 cells

For counting cells with the CASY Cell Counter, 100 µL of the cell suspension diluted in 10 mL Casyton.

For gene expression analysis (two days in culture, 24h compound exposure) 500,000 cells per well were seeded in conventional 6-well plates in 2 mL medium per well. For cytotoxicity tests (three days in culture, 48 h compound exposure) the cells were cultivated in 24-well plates, 62,500 cells seeded per well in 500 µL medium. Compound exposure was started the next morning after plating the cells.

For gene expression analysis as well as cytotoxicity experiments each compound was tested in 5 different concentrations plus vehicle control. The chemical amount for the highest con- centration was weighed and dilution series were prepared for the lower concentrated solu- tions. In case of water soluble compounds, substances were dissolved in medium and sterile filtered before adding to the cells. If the compound amount for the highest concentration was below 1 mg, 100x higher concentrated stock solutions in sterile water were prepared.

DMSO soluble compounds were dissolved in a higher concentrated DMSO stock solution and dilution series were prepared (see Table 3.17). Cells were exposed for 24 hours at 37°C at constant humidity and 5 % CO 2 .

2.2.2 Cell culture of primary human hepatocytes 2.2.2.1 Medium for cultivated primary human hepatocytes

Primary hepatocytes were cultivated in William’s E medium (PAN Biotech, P04_29510) with 100 U/mL penicillin, 0,1 mg/mL streptomycin, 10 µg/mL gentamicin, 2 mM stable glutamin, 100 nM dexa-methasone and 2 nM insulin-transferrin- selenite (ITS) supplement. When plat- ing cells, 10 % fetal calf serum was added for the first 3-4 h of cultivation.

2.2.2.2 Isolation of primary human hepatocytes

Primary human hepatocytes were isolated from liver sections of patients undergoing surgical liver resection. Prior to the resection, informed content was obtained from each patient. The isolation procedure was performed in three cooperating clinics, the Charité Berlin, and the university hospitals Munich and Regensburg.

Resected tissue samples were immediately transported into a sterile vessel containing PBS

or culture medium, in order to prevent warm ischemia. Upon arrival in the laboratory, the

tissue was placed on a sterile Petri dish and prepared for perfusion: Remaining blood was

removed by using an aseptic gauze and buttoned cannula were placed into several vessels of

(33)

Material and methods

13 the resection side and fixed with tissue glue. Depending on the size of the tissue and by us- ing the biological blood vessel architecture, 3-8 cannula are sufficient to perfuse the whole piece of liver (Godoy et al. 2013). Liver perfusion for hepatocyte isolation was implemented by a two-step isolation procedure which was developed by Seglen et al. and processed as recently described by Shinde et al. (Seglen 1976; Shinde et al. 2015). During the first perfu- sion step, the piece of liver is rinsed for approximately 10 minutes with a pre-warmed EGTA containing buffer (Godoy et al. 2013). EGTA is added to prevent coagulation, to remove the residual blood and to deplete calcium from the vessels. Calcium is important for cellular ad- hesion, therefore, the washing out of these ions depletes adhesion factors, results in loosen- ing of the tissue and promotes the perfusion process (Moscona et al. 1956 and Gingell et al.

1970). The flow rate of the perfusion solution through the tissue is about 15mL/min. An op- timal rinsing of the tissue with the buffer is accompanied by a tissue color change from brownish red to beige. In the second perfusion step, the piece of liver is perfused with a pre- warmed collagenase containing buffer (Godoy et al. 2013). For optimal enzymatic activity, calcium has to be added to the perfusion solution. In this perfusion step the extracellular matrix of the liver tissue is gradually digested within 5-15 minutes. Cannula have to be pulled out quickly before the piece of digested liver is placed in a Petri dish with stop solution for enzyme inactivation. By cutting the perfused liver piece into two halves and gently shaking the tissue, hepatocytes are released into the stop solution. The cell suspension was passed through a funnel of gauze in order to remove tissue debris. A centrifugation step was includ- ed to separate non parenchymal liver cells from the more heavy hepatocytes. The centrifu- gation was carried out at 50-100xg at 4°C for 5 minutes. The cell pellet was re-suspended in PBS or hepatocyte culture medium and placed on ice. The transport of the cells from the surgical departments to our laboratory was accomplished overnight in cold stored suspen- sions on ice. Upon arrival, cells were re-suspended in fresh cultivation medium and the via- bility was determined using trypan blue exclusion method.

2.2.2.3 Determination of cell viability and cell yield with trypan blue vital stain

Trypan blue is a commonly used dye to selectively stain dead cells or tissue. Vital cells with intact cell membranes cannot incorporate the dye, but dead cells with perforated, destroyed cell membranes easily take up the stain. In order to determine cell yield and viability, an ali- quot of cell suspension was diluted 1:10 in hepatocyte culture medium and mixed 1:2 with a 0,4 % sterile filtered trypan blue solution. The obtained mixture (1:20 dilution) was filled into the chamber of a hemocytometer and the cells in the outer four counting grid squares were counted. Vital, unstained cells as well as dead, blue colored cells were counted and the cell yield as well as the cell viability was calculated as follows:

(i) Total amount of cells per m = (counted cells/number of counted square grids) x 10 4 x dilution factor

(ii) Cell viability (%) = number of vital cells x 100 / total number of cells

(34)

Material and methods

14 2.2.2.4 Cultivation of primary hepatocytes in collagen sandwich system

Primary hepatocytes were seeded in conventional 6-well plates between two soft layers of collagen gel. For the gel preparation, a bottle of 10 mg lyophilized rat tail collagen was dis- solved overnight in 9 mL 0.2 % acetic acid at 4°C. Before plating cells dissolved collagen was placed on ice, mixed 1:10 with 10x DMEM and drop wise neutralized with 1M NaOH until the color turned from yellow to pink. The obtained gel has now a concentration of 1 mg/mL.

Using conventional 6-well plates, each well was coated with 350 µL of collagen gel for the first layer (Godoy et al. 2013) and left for polymerization for 30-45 minutes at 37°C. After successful gelation, cells were plated in FCS containing medium into the wells of each plate and kept at 37°C in the incubator for at least 3 hours. During this time the cells attach to the collagen matrix. For homogenous distribution of the cells, the plate was carefully shaken every 5-10 minutes during the first half hour of incubation. After the incubation period, the cells were carefully washed 3 x with warm sterile PBS before the second layer of collagen was added. The gel of the second layer polymerized at 37 °C for 30-45 min in the incubator.

Afterwards, 2mL warm FCS free medium was added per well and the cells were kept at 37°C in the incubator overnight.

2.2.2.5 Treatment of cultivated primary human hepatocytes

Gene expression experiments were carried out using 1,500,000 cells per well plated in con- ventional 6-well plates between the two soft collagen gel layers and 2 mL medium per well.

Analogue to HepG2 cells, compound exposure was started the morning after the day of plat- ing. For gene expression analysis, the cells were exposed for 24 hours before RNA was col- lected. Cytotoxicity experiments followed an incubation period of 48 hours.

2.2.3 RNA sample collection and isolation procedure

For RNA sample collection, the plates were transferred on ice and the medium supernatant

was immediately aspirated. QIAzol lysis reagent was applied according to the manufacturer’s

protocol (1mL QIAzol/well in a 6-well plate format) and the cells were lysed by mechanical

scraping with a cell scraper. After transferring the liquid into a sterile 2 mL Eppendorf tube,

the lysates were sonicated on ice for 30 seconds (5 sec pulse, 2 sec break). Samples from

freshly isolated hepatocytes were processes similarly: 1-1.5 Mio cells were transferred in a

reaction tube on ice for some minutes. During this time, the cells accumulate at the bottom

of the reaction tube and the supernatant can be removed carefully. 1mL QIAzol was added

and the lysate was sonicated as described.

(35)

Material and methods

15 RNA was isolated by using QIAzol lysis reagent for phenol-chloroform extraction. QIAzol comprises a guanidinium-thiocyanat-phenol mixture, which lyses the cells and supports deg- radation of proteins. Addition of chloroform results into a phase separation. Under acidic conditions the denaturated proteins and DNA partition in the organic phase and interphase, while the RNA remains soluble and accumulates in the aqueous phase. Subsequently, the aqueous phase was separated and RNA was precipitated by addition of isopropanol. Several washing and centrifugation steps with ethanol were performed to increase the RNA purity.

The amount of QIAzol as well as the following sample procession was modified depending on the plate format.

Samples were further processed as followed: 200 µL chloroform was added to each reaction tube and the samples were strongly shaken for approximately 15 seconds. After 2-3 minutes incubation at room temperature, a first phase separation was observed. After a centrifuga- tion step at 4°C for 15 minutes at 12,000xg the upper aqueous phase was transferred into a new reaction tube and the RNA was precipitated with adding 500 µL of isopropanol. The samples were incubated at room temperature for 10 minutes, centrifuged at 12,000xg for 15 minutes at 4°C and the supernatant was removed from the RNA pellet. 1 mL of 100% ethanol was added to wash the RNA pellet, followed by a centrifugation step at 7,500xg and 4°C for 5 minutes. After two more washing and centrifugation steps with 80 % and 75 % ethanol (each 1 mL), the supernatant was again removed carefully and the RNA pellet was air dried for some minutes. Depending on the RNA pellet size, 7.5-15 µL RNAse free DEPC water was used to re-suspend the RNA. Isolated RNA was stored at -80°C until further usage. The RNA quan- tity of each sample was determined photometrically with the NanoDrop 2000.

2.2.4 cDNA synthesis

For quantification of gene expression, the isolated RNA had to be reversely transcribed into

cDNA. This reaction step is catalyzed by the enzyme reverse transcriptase, which is capable

to create single stranded DNA from a RNA template. For this purpose the High Capacity

cDNA Reverse Transcription Kit from Applied Biosystems was used. 500 ng – 2 µg RNA were

reversely transcribed according to the manufacturer’s protocol. The volumes for the reaction

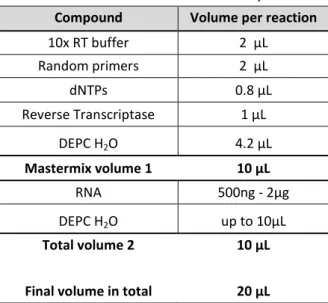
mixture are listed in Table 2.5.

Abbildung

Table 2.5: Reaction mixture for cDNA synthesis  Compound  Volume per reaction
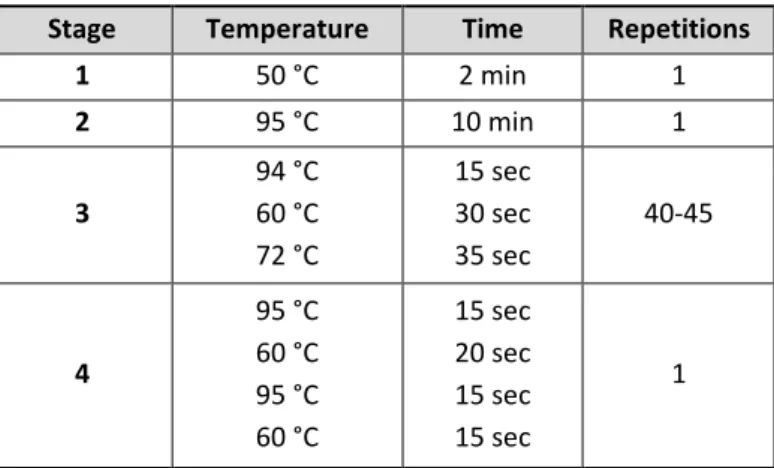
Table 2.9: Thermal conditions for qRT-PCR measurements  Stage  Temperature  Time  Repetitions
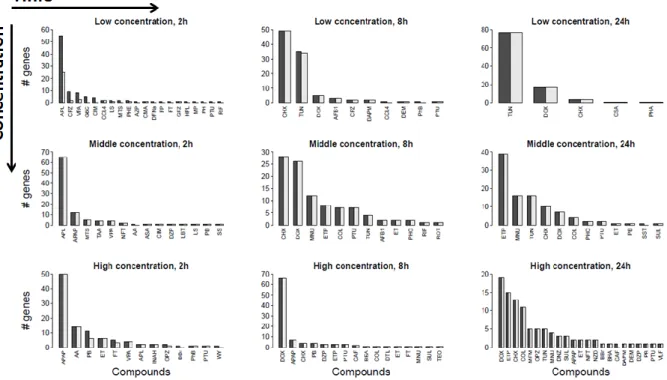
Figure  3.1:  Principal component analysis of gene expression data from primary human hepatocytes after 24h  incubation  with  148  chemicals  (green)  and  7  cytokines  (red)  at  the  highest  concentration
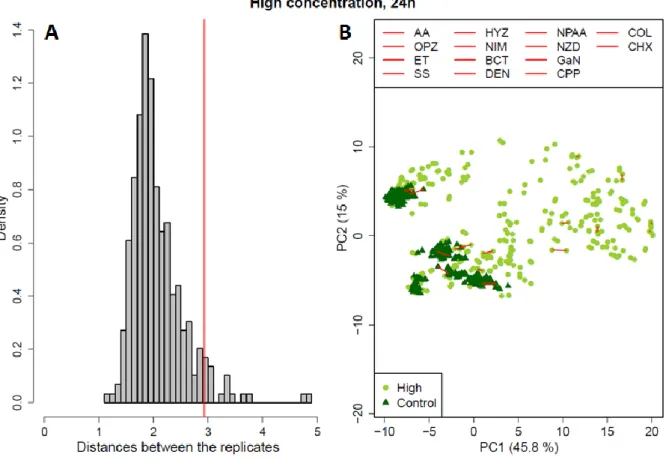
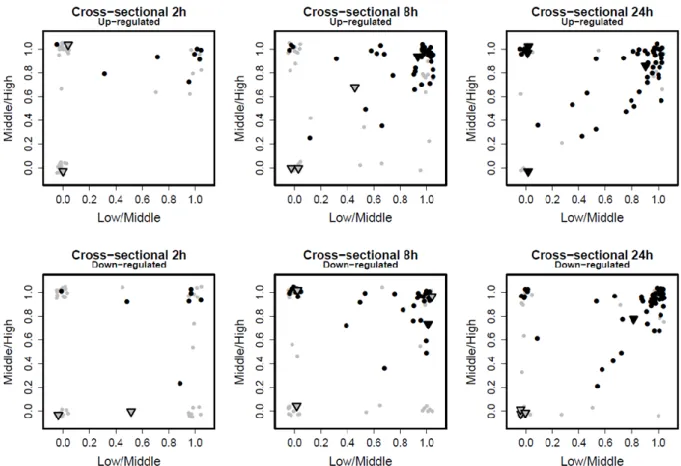
Figure 3.2: Reproducibility between replicates. A Frequency distribution of the Euclidean distance between all  pairs of sample replicates
+7

Referenzen

ÄHNLICHE DOKUMENTE

Several studies already proved that ESCs are suitable for the in vitro derivation of male gametes using different strategies. Since it was shown that mouse SSCs

way  are  the  steroid  5α‐reductase  type  1  (SRD5A1)  and  the  aldo‐keto  reductase  1C2  (AKR1C2). A 

This PhD thesis was undertaken to investigate functional TRPM8 and TRPV1 expression in human conjunctival epithelial cells (HCjEC) and ocular tumor cells such as uveal

1) To establish robust methods for isolation of human meniscus cells from native meniscus tissue and for in vitro cell expansion. To investigate their cell morphology

The review with the title “Application of New Cellular and Microphysiological Systems to Drug Metabolism Optimization and Their Positioning Respective to In Silico Tools” (195)

Sorensen (2009) Differences in gene expression of granulosa cells from women undergoing controlled ovarian hyperstimulation with either recombinant follicle-stimulating hormone

The amino acid at position 226, according to H3 numbering, has changed from glutamine (Q) to lysine (L), which is known to be important for the binding preference of human

the principle finding of the cPPIAs strongly supports the finding that MC congeners have comparable PP inhibiting capacities in human cell lines (HEI<293) as well as