https://doi.org/10.1007/s10858-020-00326-w ARTICLE
Pressure dependence of side chain 1 H and 15 N‑chemical shifts in the model peptides Ac‑Gly‑Gly‑Xxx‑Ala‑NH 2
Markus Beck Erlach
1· Joerg Koehler
1· Claudia E. Munte
1· Werner Kremer
1· Edson Crusca Jr
2· Masatsune Kainosho
3· Hans Robert Kalbitzer
1Received: 24 March 2020 / Accepted: 5 June 2020 / Published online: 22 June 2020
© The Author(s) 2020
Abstract
For interpreting the pressure induced shifts of resonance lines of folded as well as unfolded proteins the availability of data from well-defined model systems is indispensable. Here, we report the pressure dependence of
1H and
15N chemical shifts of the side chain atoms in the protected tetrapeptides Ac-Gly-Gly-Xxx-Ala-NH
2(Xxx is one of the 20 canonical amino acids) measured at 800 MHz proton frequency. As observed earlier for other nuclei the chemical shifts of the side chain nuclei have a nonlinear dependence on pressure in the range from 0.1 to 200 MPa. The pressure response is described by a second degree polynomial with the pressure coefficients B
1and B
2that are dependent on the atom type and type of amino acid studied. A number of resonances could be assigned stereospecifically including the
1H and
15N resonances of the guanidine group of arginine. In addition, stereoselectively isotope labeled SAIL amino acids were used to support the stereochemical assignments. The random-coil pressure coefficients are also dependent on the neighbor in the sequence as an analysis of the data shows. For H
αand H
Ncorrection factors for different amino acids were derived. In addition, a simple correction of compression effects in thermodynamic analysis of structural transitions in proteins was derived on the basis of random-coil pressure coefficients.
Keywords High pressure NMR · Pressure coefficients · model peptides · Random-coil · Chemical shift · 1H · 15N · multi- state equilibria
Introduction
The study of the pressure response of polypeptides and pro- teins by high pressure NMR spectroscopy can be used for characterization of the free energy landscape of proteins (for reviews see e.g. Kitahara et al. 2013; Akasaka and Matsuki 2015). The pressure response allows the detection of rare
“excited” conformational states of proteins that are impor- tant for folding and function (see e.g. Kalbitzer et al. 2009).
Excited states also provide the basis for the development of
a new type of allosteric inhibitors of proteins involved in sig- nal transduction, called intrinsic allosteric inhibitors (Ros- nizeck et al. 2010, 2012; Kalbitzer et al. 2013a; Kalbitzer and Spoerner b).
For the detection of rare states of proteins, mainly pres- sure dependent changes of chemical shifts are evaluated that are in many cases non-linear and can often be fitted with an appropriate thermodynamical model. These conformational contributions have to be separated from other chemical shift contributions as they are observed even in non-folded model compounds as a consequence of compression and rearrange- ment of the water shell. A non-linear pressure response of chemical shifts can even be determined experimentally in the peptide bond model N-methyl acetamide and is sup- ported by quantum chemical calculations (Frach et al. 2016).
However, random-coil peptides are better suited models for protein work. Arnold et al. (2002) reported the first data set for the main chain and side chain protons of the tetrapeptide Gly-Gly-Xxx-Ala in the pressure range up to 200 MPa. The pressure dependence of chemical shifts δ can sufficiently
* Hans Robert Kalbitzer
hans-robert.kalbitzer@biologie.uni-regensburg.de
1
Institute of Biophysics and Physical Biochemistry and Centre of Magnetic Resonance in Chemistry and Biomedicine, University of Regensburg, 93040 Regensburg, Germany
2
Physics Institute of São Carlos, University of São Paulo, São Carlos 13566-590, Brazil
3
Graduate School of Science, Tokyo Metropolitan University,
1-1 Minami-Ohsawa, Hachioji, Tokyo 192-0397, Japan
well be described by a second order polynomial with the chemical shift at pressure P
0(0.1 MPa) and the first and second order pressure coefficients B
1and B
2. A data set recorded at 800 MHz was also published for all backbone atoms and the carbon resonances of the side chains of the protected tetrapeptide Ac-Gly-Gly-Xxx-Ala-NH
2(Koehler et al. 2012; Beck Erlach et al. 2016, 2017).
The quality of data by Arnold et al. (2002) measured at 600 MHz was not sufficient to determine the second order coefficient for the side chain protons. In this paper, we will present such data recorded at the N- and C-terminally pro- tected tetrapeptide together with the pressure response of nitrogen side chain atoms not yet reported. With these data a complete data set for all nuclei of the model tetrapeptide Ac-Gly-Gly-Xxx-Ala-NH
2will be available for the scientific community.
Materials and methods Synthesis of tetrapeptides
Uniformly
13C and
15N enriched and Fmoc (N-(9-Fluorenyl- methoxycarbonyl)) protected amino acids required for the synthesis were purchased from Sigma Aldrich (St. Louis, MO, USA). The isotope enrichment is larger than 98%. All other chemicals were purchased from Merck (Darmstadt, Germany).
The synthesis of the tetrapeptide Ac-Gly-Gly-Xxx-Ala- NH
2, where Xxx stands for one of the 20 canonical amino acids, was already described in detail earlier (Koehler et al.
2012; Beck Erlach et al. 2016). Only the amino acid Xxx at position 3 in the tetrapeptide Ac-Gly-Gly-Xxx-Ala-NH
2was uniformly
13C and
15N enriched. The purity of the tetra- peptides was confirmed by ESI–MS (Bruker, Billerica, MA, USA) and RP-HPLC (Waters, Milford, MA, USA).
Selectively enriched SAIL amino acids
Stereoselectively
2H,
15N and
13C labeled amino acids were obtained from SAIL Technologies Inc. (Tokyo, Japan). For more details, see Kainosho et al. (2006), Kainosho and Gün- tert (2009).
Sample preparation
Tetrapeptide samples were prepared by dissolving 2.5 µmol of the peptide in 500 µL of a buffer containing 20 mM perdeuterated Tris-d
11(Tris(hydroxymethyl-d
3)amino- d
2-methane) and 0.5 mM DSS (4,4-dimethyl-4-silapentane- 1-sulfonic acid) with a ratio H
2O:D
2O of 90:10. Thus a final peptide concentration of 5 mM was obtained. The pH value was adjusted to 6.7 using a Hamilton Spintrode attached to a
Beckman Coulter pH meter. Histidine was also measured at pH 4.0 and pH 8.5. The pH values have not been corrected for the deuterium isotope effect.
For the stereospecific assignment of amino acids, unla- beled amino acids or (stereo)-selectively
2H,
13C enriched SAIL amino acids were dissolved in 20 mM Tris-d
11, 0.5 mM DSS and 10% D
2O, pH 6.7, to obtain a final amino acid concentration of 4 to 10 mM.
NMR spectroscopy
Most of the experiments were performed on an 800 MHz Bruker Avance spectrometer (Bruker, Billerica, MA, USA) with a room temperature probe head (QXI). The experi- ments were performed at 283 K, with a temperature calibra- tion carried out after each sample change by measuring the difference of the proton resonance of the hydroxyl and the methyl group in 100% methanol as described by Raiford et al. (1979).
1
H-NMR spectra were directly referenced to the methyl resonances of internal DSS,
15N signals were indirectly ref- erenced to DSS using a Ξ-value of 0.101329118 (
15N/
1H) (Wishart et al. 1995b). Atom labels were named according to IUPAC recommendations (Markley et al. 1998).
1
H and
15N chemical shifts were obtained from highly resolved 1D proton and 2D [
1H,
15N]-HSQC spectra with a typical digital resolution of the time domain data of 0.04 Hz (
1H) and 0.32 Hz (
15N). A Lorentzian-to-Gaussian transfor- mation was applied to the FID to obtain signals as narrow as possible.
Data acquisition and processing was performed with Bruker TopSpin 3.2 PL6. For peak picking the software AUREMOL (Gronwald and Kalbitzer, 2004) was used. Data evaluation and fitting was done with the software package R (R Core Team 2019).
High pressure system
The high pressure system, especially the autoclave holding the ceramic cell was described in detail by Koehler et al.
(2012). Pressure was applied to the NMR sample via pres-
surized fluids (methylcyclohexane or water) contained in
high pressure lines. For generating the pressure a manually
operated piston compressor and an air-to-liquid pressure
intensifier (Barocycler®, HUB440, Pressure BioSciences
Inc., South Easton, MA, USA), which is controlled by the
spectrometer, were used. The ceramic cell was purchased
from Daedalus Innovations LLC (Aston, PA, USA) with a
maximum pressure limit of 250 MPa. For safety reasons
pressure was only applied up to 200 MPa. The autoclave
holding the ceramic cell is similar to the original auto-
clave (Peterson and Wand 2005) provided by Daedalus
Innovations LLC but has an integrated safety valve, similar to the security valve described by Beck Erlach et al. (2010).
Data evaluation
For all 20 model peptides a pressure series from 1 to 200 MPa was performed. The obtained pressure dependent chemical shifts δ were fitted as a function of pressure P with a second degree polynomial
with P
0the atmospheric pressure of 0.1 MPa and δ
0the chemical shift at pressure P
0. B
1and B
2are the first and sec- ond order pressure coefficients. For random coil peptides, a second degree polynomial as defined by Eq. 1 is sufficient in the pressure range studied here (Arnold et al. 2002; Koehler et al. 2012; Beck Erlach et al. 2016, 2017). The description of the pressure response of small molecules such as the GTP analog GTPγS sometimes requires a third degree polynomial (Spoerner et al. 2017). When the ratio of B
2/B
1is negative, an extremum with slope zero would be reached at a pressure P
exwith
An extremum has not observed for our model peptides in the range up to 200 MP. With the mean value of B
2/B
1for H
β(Table 2) of − 1.4 GPa
−1the maximum value would be expected at 375 MPa, far outside the pressure range stud- ied. The dependence of the chemical shifts δ on pressure leads to an expression that is dependent on tanh (ΔG/2RT) (Beck Erlach et al. 2014). However, in a two state-model an extremum at high pressures is not expected from a thermo- dynamic description when ΔG is only linearly dependent on pressure P. This is the case when ΔG does not contain a second degree term, since he compressibility difference Δβ′ = -
𝜕ΔV𝜕P0ij= 0 as most authors assume in their data evalu- ation. The tanh function can be described by a second order differential equation typical for physical processes that show a saturation like behavior (Kepner 2010). In contrast to our second degree polynomial, it shows an asymptotic behavior at high pressures that we call saturation-like in the following.
In fact, the Taylor-series of tanh itself has a second order term of zero, therefore the second degree polynomial that is traditionally used for a fit of the data is not suitable for the (1) 𝛿 (P) = 𝛿 (
P
0) + d 𝛿
dP ( P
0)(
P − P
0) + 1
2 d
2𝛿 dP
2( P
0)(
P − P
0)
2= 𝛿
0
+ B
1( P − P
0)
+ B
2(
P − P
0)
2(2) P
ex− P
0= − B
12B
2description of two-state equilibrium with ΔG only linearily dependent on P. However, when Δβ′ is not zero, again a maximum is obtained and a second degree term is required for a proper description of the data.
Sequence dependent corrections for the pressure coefficients
Analogously to the method proposed by Schwarzinger et al.
(2001) for the correction of the random-coil chemical shifts of atom a in amino acid x in position i by amino acid y in position i + j correction factors C
−1,a1,2(y), C
1,2+1,a(y), and C
+2,a1,2(y) for the pressure coefficients B
1and B
2were calculated.
They can be obtained from the pressure response of Gly1, Gly2, and Ala4 by subtracting the B
1and B
2values obtained for Ac-GGGA-NH
2from those obtained for Ac-GGyA-NH
2. The correction factors C
−1,a1,2(y) for the atom a (H
Nor H
α) of amino acid x in position i by amino acid y in position i-1 are given by
with B
a1,2the pressure coefficients of atom a in Ala4.
Analogously, the correction factors C
+1,a1,2(y), and C
+2,a1,2(y) are obtained from Gly2 and Gly1, respectively. The sequence corrected B
1and B
2values B
a,corr1,2for atom a in amino acid x in the sequence -uxyz- are than given as
Results and discussion Assignment of resonance lines
By applying pressure to the tetrapeptides and fitting the resulting pressure dependence of the chemical shift to Eq. 1, we obtained a complete dataset of
1H and
15N random coil chemical shift values for side chains of the amino acid 3 in the model peptides Ac-Gly-Gly-Xxx-Ala-NH
2. The assign- ments of most
1H-resonances could be done on the basis of the already published proton assignments from Bundi and Wüthrich (1979) of Gly-Gly-Xxx-Ala and an analysis of the multiplet patterns. When necessary classical two-dimen- sional COSY, TOCSY and NOESY spectra were recorded.
The
15N resonances could be assigned by HSQC-spectra from the adjacent protons already assigned.
(3) C
1,2−1,a(y) = B
a1,2(
Ac − GGy 𝐀 − NH
2)
− B
a1,2(
Ac − GGG 𝐀 − NH
2)
(4)
B
a,corr1,2(x) = B
a1,2(x) + C
−1,a1,2(u) + C
1,2+1,a(y) + C
1,2+2,a(z)
Stereospecific assignments
Geminal proton resonances in stereo selectively labeled SAIL amino acids
At 800 MHz proton resonance frequency most of the geminal proton in the tetrapeptides are resolved and can be observed separately. The typical geminal coupling con- stant in sp
3bonds is -12 Hz, corresponding to 0.015 ppm at 800 MHz. For most methylene protons the peak separation is significantly larger. They can be observed separately but still strong coupling effects are visible (see below). This is also true for the isolated amino acids (Table 1). Since stereo selectively deuterated SAIL amino acids (Kainosho et al.
2006; Kainosho and Güntert 2009) are available, at least in the amino acids the geminal proton resonances can unequiv- ocally be assigned. When comparing the spectra of isotope labeled with the corresponding unlabeled amino acids, a difficulty is the isotope shift that occurs in the SAIL amino acids since these are not only stereoselectively deuterated but also
15N and
13C enriched. In general, these isotope shifts are smaller than the separation of the corresponding proton resonances. The isotope labelling induces an upfield shift of the order of 0.014 to 0.043 ppm (Table 1). Since deuteration is not 100% complete because of the limited purity of the starting materials, for many geminal protons a weak signal of the unlabeled group can be detected (values in brackets in Table 1). But even here an upfield isotope shift is observed caused by the other nuclei (especially also the
13C-nuclei of the methylene groups). When the resonances of geminal protons are separated, the H
β2resonances are always shifted upfield relative to the H
β3resonances. The only exception is cysteine. These relative shifts also apply for the methylene resonances in γ-position of Ile and Met. However, for the H
γ2and H
γ3resonances of Lys and the H
δ2and H
δ3resonances of Pro the order is interchanged. These assignments give also a hint to the stereospecific assignments in the protected tetrapeptides (Table 2) but cannot prove their stereospecific assignment definitively.
Stereochemical assignment of H
β‑proton resonances in Ac‑GGXA‑NH
2Also in the protected tetrapeptides, a large number of gemi- nal proton resonances are non-equivalent at 800 MHz pro- ton resonance frequency and can be observed separately (Table 2). However, in literature most of them were not assigned stereospecifically, since the high internal mobility in random coil peptides does complicate the use of sim- ple NMR methods developed for folded proteins that are based on the assumption of a single conformer in solution.
Here, only a combination of 2D-NOESY-spectroscopy with extended molecular dynamic runs allows a safe assignment,
Table 1 Stereochemical assignments in SAIL amino acids
aa
Values in brackets, remaining
1H signals from incomplete deutera- tion. Temperature 283 K, 800 MHz proton frequency, 4 to 10 mM amino acid in 20 mM Tris-d
11pH 6.7, 0.5 mM DSS, 10% D
2O
b
Δδ
0= δ
0(unlabeled)–δ
0(SAIL)
c
Not detected
Xxx Atom SAIL Unlabeled Difference
δ
0δ
0Δδ
0b(ppm) (ppm) (ppm)
Arg H
β2(1.862) 1.898 0.036
H
β31.881 1.898 0.017
H
γ2(−
c) 1.708 (−
c)
H
γ31.594 1.629 0.035
H
δ2/δ33.205 3.233 0.028
Asn H
β22.820 2.842 0.022
H
β3(2.918) 2.939 0.021
Asp H
β22.641 2.661 0.020
H
β3(−
c) 2.805 (−
c)
Cys
redH
β23.070 3.090 0.020
H
β3(−
c) 3.010 (−
c)
Cys
oxH
β23.137 3.160 0.023
H
β3(−
c) 3.374 (−
c)
Gln H
β2/β32.095 2.122 0.027
H
γ2/γ32.422 2.437 0.015
Glu H
β22.020 2.050 0.030
H
β3(2.103) 2.118 0.015
H
γ2/γ32.323 2.339 0.016
His H
β23.103 3.129 0.026
H
β3(−
c) 3.226 (−
c)
Ile H
γ121.206 1.247 0.041
H
γ13(1.414) 1.451 0.037
Leu H
β2(−
c) 1.677 (−
c)
H
β31.693 1.713 0.020
H
γ1.652 1.691 0.039
Lys H
β2/β31.864 1.889 0.025
H
γ2(1.459) 1.489 0.030
H
γ31.376 1.419 0.043
H
δ2/δ31.674 1.709 0.035
H
ε2 ε32.984 3.009 0.025
Met H
β22.085 2.117 0.032
H
β3(2.160) 2.182 0.022
H
γ2/γ32.592 2.623 0.031
Phe H
β2(−
c) 3.110 (−
c)
H
β33.255 3.272 0.017
Pro H
β22.028 2.054 0.026
H
β3(2.325) 2.339 0.014
H
γ2/γ31.950 1.996 0.046
H
δ23.386 3.406 0.020
H
δ3(3.301) 3.320 0.019
Ser H
β2(3.916) 3.935 0.019
H
β33.948 3.971 0.023
Trp H
β2(−
c) 3.293 (−
c)
H
β33.454 3.473 0.019
Tyr H
β2(3.026) 3.040 0.014
H
β33.166 3.185 0.019
Table 2 Pressure dependence of the H
β-chemical shifts
aa
δ
0, B
1, and B
2were obtained by a fit of the data to Eq. 1. The sample contained 5 mM tetrapeptide in 20 mM perdeuterated Tris-d
11, 0.5 mM DSS, H
2O/D
2O 9:1. Temperature 283 K. The pH value was adjusted to 6.7. The errors correspond to a confidence level of 95%. A B
2/B
1-value is given in brackets when its error is equal/larger than the value itself
b
Stereospecific assignments from Harsch et al. (2013)
c
Tentative stereospecific assignment taken from free amino acids (Table 1)
d
Mean values with standard deviation in brackets
e
B
2/B
1determined from the slope in the correlation plot (Fig. 4)
Xxx Atom δ
0B
1B
2B
2/B
1(ppm) (ppm GPa
−1) (ppm GPa
−2) (GPa
−1)
Ala (H
β)
31.392 − 0.022 ± 0.001 0.02 ± 0.01 − 0.91 ± 0.46
Arg H
β2/β31.769 − 0.026 ± 0.005 0.00 ± 0.02 0.00 ± −
H
β2/β31.874 − 0.077 ± 0.005 0.03 ± 0.02 − 0.39 ± 0.26
Asn H
β2 b2.839 0.042 ± 0.011 − 0.13 ± 0.06 − 3.10 ± 1.64
H
β3 b2.746 0.072 ± 0.014 − 0.12 ± 0.07 − 1.67 ± 1.03
Asp H
β2 c2.623 0.083 ± 0.008 − 0.06 ± 0.04 − 0.72 ± 0.49
H
β3 c2.704 0.073 ± 0.007 − 0.05 ± 0.03 − 0.68 ± 0.42
Cys
redH
β22.938 − 0.001 ± 0.001 − 0.01 ± 0.01 (10.0 ± 14.1)
H
β32.938 − 0.001 ± 0.001 − 0.01 ± 0.01 (10.0 ± 14.1)
Cys
oxH
β2/β32.982 0.053 ± 0.007 − 0.03 ± 0.03 (− 0.49 ± 0.55)
H
β2/β33.256 − 0.050 ± 0.001 0.03 ± 0.01 − 0.52 ± 0.14
Gln H
β2 b2.133 − 0.099 ± 0.013 0.09 ± 0.06 − 0.91 ± 0.62
H
β3 b1.987 − 0.041 ± 0.010 0.05 ± 0.05 (− 1.22 ± 1.26)
Glu H
β2 c1.948 0.018 ± 0.010 − 0.11 ± 0.05 − 6.11 ± 4.39
H
β3 c2.095 − 0.190 ± 0.035 0.24 ± 0.17 − 1.26 ± 0.92
His H
β2 c3.163 0.020 ± 0.003 − 0.01 ± 0.01 (− 0.5 ± 0.5)
(pH 4.0) H
β3 c3.284 − 0.085 ± 0.010 0.18 ± 0.05 − 2.12 ± 0.64
His H
β2 c3.036 0.027 ± 0.012 − 0.02 ± 0.06 (− 0.74 ± 2.25)
(pH 8.5) H
β3 c3.101 − 0.059 ± 0.008 0.10 ± 0.04 − 1.69 ± 0.72
Ile H
β1.881 − 0.018 ± 0.006 0.04 ± 0.03 − 2.22 ± 1.82
Leu H
β2 c1.584 − 0.028 ± 0.001 0.04 ± 0.01 − 1.43 ± 0.36
H
β3 c1.652 − 0.048 ± 0.001 0.04 ± 0.01 − 0.83 ± 0.21
Lys H
β2/β31.758 − 0.041 ± 0.002 0.02 ± 0.01 − 0.49 ± 0.29
H
β2/β31.846 − 0.103 ± 0.007 0.07 ± 0.03 − 0.68 ± 0.39
Met H
β2 c2.004 − 0.026 ± 0.003 0.02 ± 0.01 − 0.77 ± 0.40
H
β3 c2.114 − 0.087 ± 0.005 0.10 ± 0.02 − 1.15 ± 0.24
Phe H
β2 c3.049 0.013 ± 0.010 − 0.02 ± 0.05 (− 1.54 ± 4.02)
H
β3 c3.129 − 0.049 ± 0.007 0.14 ± 0.03 − 2.86 ± 0.74
Pro
cisH
β2 c2.189 − 0.083 ± 0.013 0.10 ± 0.06 − 1.20 ± 0.75
bH
β3 c2.359 − 0.076 ± 0.009 0.08 ± 0.04 − 1.05 ± 0.54
Pro
transH
β2 c2.033 − 0.078 ± 0.009 0.13 ± 0.04 − 1.67 ± 0.55
H
β3 c2.205 − 0.070 ± 0.010 0.10 ± 0.05 − 1.43 ± 0.74
Ser H
β2/β33.881 − 0.015 ± 0.005 − 0.01 ± 0.03 (0.67 ± 2.01)
H
β2/β33.881 − 0.015 ± 0.005 0.03 ± 0.03 (− 2.00 ± 2.11)
Thr H
β4.255 0.001 ± 0.003 0.06 ± 0.01 (60 ± 180)
Trp H
β23.277 − 0.024 ± 0.008 0.02 ± 0.04 (− 0.83 ± 1.69)
H
β33.277 − 0.024 ± 0.008 0.02 ± 0.04 (− 0.83 ± 1.69)
Tyr H
β2 c2.972 0.037 ± 0.010 − 0.13 ± 0.05 − 3.51 ± 1.65
H
β3 c3.037 − 0.090 ± 0.019 0.34 ± 0.09 − 3.78 ± 1.28
Val H
β2.093 0.007 ± 0.004 − 0.09 ± 0.02 − 12.86 ± 7.88
Mean
d2.58 (0.70) − 0.027 (0.056) 0.03 (0.09) 0.4 (10.2)
− 1.38 ± 0.16
eas previously reported by Harsch et al. (2013) for GGNA- NH
2and GGQA-NH
2. Although our tetrapeptides are addi- tionally acetylated at N-terminus, these assignments can safely be transferred to our peptides since the N-terminal protection has only minor effects on the chemical shifts of the β-methylene groups (GGNA-NH
2: 2.84 ppm, 2.75 ppm;
Ac-GGNA-NH
2: 2.84 ppm, 2.75 ppm; GGQA-NH
2: 2.12 ppm, 1.99 ppm; Ac-GGQA-NH
2; 2.13 ppm, 1.99 ppm).
However, the SAIL data do not further corroborate these assignments. The H
β2resonances of glutamine are not sepa- rated in the free amino acid glutamine. The H
β2resonance in Ac-GGNA-NH
2has the same chemical shift as in the isolated amino acid (2.84 ppm) but instead of being upfield shifted the H
β3resonance is strongly downfield shifted by 0.19 ppm (Tables 1 and 2), indicating that other factors influ- encing the chemical shifts play a role here. A comparison of H
βchemical shifts in the tetrapeptide and the SAIL amino acids allows a tentative stereochemical assignment of the resonances in Asp, Glu, His, Leu, Met, Phe, Pro, and Tyr.
However, one has to be careful when using this assignment method since the peak separation is not very large: In Asn, one would have ended up with the wrong decision by just using the order of the chemical shifts (see above) in the free amino acid.
Methyl groups of Val and Leu
The stereochemical assignments of the methyl carbon reso- nances of Leu and Val in our tetrapeptides by selective deu- teration were reported earlier by Beck Erlach et al. (2017).
The assignment of corresponding proton resonances can be made directly from these data (see Table 3).
Amide and amino groups of Asn, Gln, and Arg
The stereochemical assignments of the side chain and C-ter- minal amide groups of Asn and Gln were earlier reported for the C-terminal protected tetrapeptides GGNA-NH
2and GGQA-NH
2by Harsch et al. (2013). As already stated above, our tetrapeptides are additionally acetylated at N-ter- minus. These assignments can safely transferred since the N-terminal protection has only minor effects on the chemical shifts. For the amide groups of GGNA-NH
2and Ac-GGNA- NH
2the shifts are (7.65, 6.96) ppm and (7.69, 6.99) ppm, respectively. The corresponding values of GGQA-NH
2and Ac-GGQA-NH
2are (7.59, 6.90) ppm and (7.64, 6.94) ppm, respectively. In fact, a general analysis of the BMRB data base shows that also in folded proteins the downfield shifted resonance lines can be assigned to H
δ21and H
ε21, with a separation of the chemical shifts of the two amide resonance lines s ≥ 0.40 ppm for asparagine and ≥ 0.42 ppm for glutamine, at a confidence level > 95% (Harsch et al.
2017). In the past, the proton and nitrogen resonances of
the guanidino group of Arg in the tetrapeptides have not been stereospecifically assigned, since at ambient tempera- ture the moderately fast flip around the N–C-bonds averages expected NOEs between the H
ε-proton and the H
η21-protons.
In the amino acid Arg the flip rate around the N
ε–C
ζ-bond is about 900 to 1000 s
−1at room temperature in the presence of 30% methanol-d
6(Henry and Sykes, 1995). As a conse- quence, the chemical shifts of the H
η-protons are averaged at 500 MHz at room temperature. At 263 K and at 500 MHz proton resonance frequency the rotation around the N
ε–C
ζ- bond is sufficiently slowed down in this solution for observ- ing two separated H
η/N
η-cross peaks at (6.52, 70.78) ppm and at (6.97, 72.78) ppm. At 223 K in the presence of 50% methanol the rotation rate around the C
ζ-N
η-bond is decreased in such a way that the two H
ηsignals bound to the downfield shifted nitrogen can be observed separately but not those of the highfield shifted nitrogen (Yamazaki et al. 1995). Unfortunately, stereospecific assignments have not been reported. In our tetrapeptide, the guanidino proton and nitrogen resonances are well separated at 283 K and at 800 MHz
1H-resonance frequency. A stereospecific NOE- based assignment cannot be performed at this temperature because of the motional averaging of the NOEs. However, the motions can be slowed down sufficiently by decreasing the pH to 2.4 and by decreasing the temperature to 260 K at 195 MPa where the solvent is still fluid. In the 3D-[
1H,
15N]- NOESY-HSQC it shows a strong NOE from the H
εreso- nance at 7.29 ppm to one set of the H
η-resonances (data not shown). This indicates that the downfield shifted resonance at 6.98 ppm corresponds to H
η21/η22bound to N
η2under these experimental conditions. The assignment of the resonances at ambient conditions (Table 4) was performed by follow- ing the continuous temperature and pressure dependent shift changes. Interestingly, the H
η21/η22resonance corresponds to the downfield shifted resonance that shows a smaller rota- tion rate around the C
ζ–N
η-bond than the high field shifted resonance. This is in line with a small sterical hindrance by the N
ε-group.
Imidazole nitrogen atoms of histidine
The histidine N
δ1and N
ε2resonances were assigned by [
1H,
15N]-HSQC spectroscopy using the two-bond coupling to the ring protons. In agreement with this assignment are the chemical shift values given by Platzer et al. (2014) for Ac-GHG-NH
2. In addition, a stronger pH dependence of chemical shifts is expected and observed for N
δ1.
Pressure dependence of 1 H chemical shifts of side chain protons bound to a carbon atom
The resonances of side chain protons bound to a carbon
atom are listed in Tables 2 and 3. Here, besides long range
Table 3 Pressure dependence of chemical shifts of other carbon bound side chain proton resonances
aXxx Atom δ
0B
1B
2B
2/B
1(ppm) (ppm GPa
−1) (ppm GPa
−2) (GPa
−1)
Arg H
γ21.633 − 0.104 ± 0.009 0.06 ± 0.04 − 0.58 ± 0.39
H
γ31.633 − 0.104 ± 0.009 0.06 ± 0.04 − 0.58 ± 0.39
H
δ23.204 − 0.088 ± 0.007 0.04 ± 0.03 − 0.45 ± 0.34
H
δ33.204 − 0.088 ± 0.007 0.04 ± 0.03 − 0.45 ± 0.34
Gln H
γ22.371 − 0.037 ± 0.010 − 0.01 ± 0.05 (0.27 ± 1.35)
H
γ32.371 − 0.037 ± 0.010 − 0.01 ± 0.05 (0.27 ± 1.35)
Glu H
γ22.324 − 0.078 ± 0.014 − 0.11 ± 0.07 1.41 ± 0.93
H
γ32.324 − 0.078 ± 0.014 − 0.11 ± 0.07 1.41 ± 0.93
His H
δ27.284 0.013 ± 0.005 0.01 ± 0.02 (0.77 ± 1.57)
(pH 4.0) H
ε18.598 0.064 ± 0.003 − 0.03 ± 0.01 − 0.47 ± 0.16
His H
δ26.971 0.094 ± 0.057 − 0.23 ± 0.28 (− 2.45 ± 3.33)
(pH 8.5) H
ε17.702 0.137 ± 0.061 0.07 ± 0.30 0.51 ± 2.20
Ile H
γ12 b1.188 − 0.117 ± 0.020 0.18 ± 0.10 − 1.54 ± 0.89
H
γ13 b1.452 − 0.143 ± 0.018 − 0.12 ± 0.09 0.84 ± 0.64
(H
γ2)
30.924 − 0.087 ± 0.005 0.04 ± 0.03 − 0.46 ± 0.35 (H
δ1)
30.866 − 0.099 ± 0.006 0.07 ± 0.03 − 0.71 ± 0.31
Leu H
γ1.634 − 0.125 ± 0.002 − 0.005 ± 0.008 (0.04 ± 0.06)
(H
δ1)
3c0.928 − 0.070 ± 0.001 0.030 ± 0.005 − 0.43 ± 0.07 (H
δ2)
3c0.874 − 0.064 ± 0.002 0.01 ± 0.01 (− 0.16 ± 0.16)
Lys H
γ21.433 − 0.159 ± 0.012 0.15 ± 0.06 − 0.94 ± 0.38
H
γ31.433 − 0.159 ± 0.012 0.15 ± 0.06 − 0.94 ± 0.38
H
δ21.678 − 0.108 ± 0.007 0.06 ± 0.03 − 0.56 ± 0.28
H
δ31.678 − 0.108 ± 0.007 0.06 ± 0.03 − 0.56 ± 0.28
H
ε22.989 − 0.071 ± 0.003 0.03 ± 0.01 − 0.42 ± 0.14
H
ε32.989 − 0.071 ± 0.003 0.03 ± 0.01 − 0.42 ± 0.14
Met H
γ2/γ32.542 − 0.109 ± 0.004 0.05 ± 0.02 − 0.46 ± 0.18
H
γ2/γ32.614 − 0.131 ± 0.002 0.13 ± 0.01 − 0.99 ± 0.08
(H
ε)
32.098 − 0.070 ± 0.003 0.04 ± 0.01 − 0.57 ± 0.14
Phe H
δ1/δ27.277 − 0.065 ± 0.007 0.15 ± 0.03 − 2.31 ± 0.52
H
ε1/ε27.375 − 0.019 ± 0.008 0.12 ± 0.04 − 6.32 ± 3.39
H
ζ7.346 − 0.008 ± 0.009 0.10 ± 0.04 (− 12.5 ± 14.9)
Pro
cisH
γ2/γ31.848 − 0.162 ± 0.010 0.24 ± 0.05 − 1.48 ± 0.32
H
γ2/γ31.943 − 0.076 ± 0.010 0.15 ± 0.05 − 1.97 ± 0.71
H
δ2/ δ33.530 − 0.121 ± 0.005 0.12 ± 0.02 − 0.99 ± 0.17
H
δ2/δ33.575 − 0.079 ± 0.005 0.11 ± 0.02 − 1.39 ± 0.27
Pro
transH
γ22.021 − 0.110 ± 0.005 0.12 ± 0.02 − 1.09 ± 0.19
H
γ32.021 − 0.110 ± 0.005 0.12 ± 0.02 − 1.09 ± 0.19
H
δ23.638 − 0.089 ± 0.020 − 0.05 ± 0.10 (0.56 ± 1.13)
H
δ33.638 − 0.089 ± 0.020 − 0.05 ± 0.10 (0.56 ± 1.13)
Thr (H
γ)
31.212 − 0.049 ± 0.002 0.02 ± 0.01 − 0.41 ± 0.20
Trp H
δ17.264 0.015 ± 0.009 0.19 ± 0.05 12.67 ± 8.30
H
ε37.642 − 0.113 ± 0.010 0.08 ± 0.05 − 0.71 ± 0.45
H
ζ27.498 0.003 ± 0.006 0.08 ± 0.03 (26.7 ± 54.3)
H
ζ37.171 − 0.047 ± 0.014 0.12 ± 0.07 − 2.55 ± 1.67
H
η27.247 − 0.030 ± 0.018 0.14 ± 0.09 − 4.67 ± 4.10
Tyr H
δ1/δ27.139 − 0.058 ± 0.007 0.09 ± 0.03 − 1.55 ± .55
H
ε1/ε26.848 − 0.023 ± 0.005 0.10 ± 0.03 − 4.35 ± 1.61
Val (H
γ1)
3c0.945 − 0.067 ± 0.002 0.04 ± 0.01 − 0.60 ± 0.15
(H
γ2)
3c0.931 − 0.068 ± 0.003 0.04 ± 0.01 − 0.59 ± 0.15
Mean
d3.57 (2.55) − 0.069 (0.061) 0.06 (0.09) − 0.3 (4.9)
structural effects the pressure response is expected to depend on the type of the group the proton is attached to as well as on the position in the side chain.
Pressure dependent shifts of H
β‑protons
As an example, Fig. 1 shows the pressure response of the H
β-resonances of histidine in the tetrapeptide that is clearly non-linear. Such a deviation from the linearity is observed for most of the other H
β-resonances. The size and direction of the pressure induced shifts is strongly depend- ent on the amino acid under consideration. In Table 2 the parameters δ
0, B
1and B
2obtained from a fit of the data are summarized. Most of the resonances show an upfield shift with pressure. In addition, the sign of the second
order pressure coefficient B
2is opposite to that of the first order coefficient B
1for all values with a reasonable error estimate (Table 2). This leads to a saturation-like behav- ior where the pressure response gets weaker with higher pressures. In some residues, the two methylene resonances move in different directions with pressure, namely in the aromatic residues His, Phe, and Tyr as well as in Glu and cysteine (see e.g. Fig. 1). According to the SAIL data, the H
β2-resonances are always shifted upfield relative to the H
β3-resonances and have a negative first order coefficient B
1. In contrast, the H
β3-resonances have a B
1> 0, experi- encing a downfield shift in the low pressure range. As a result, the two resonances become further separated with pressure. Since the absolute value of the first order pres- sure coefficient of the H
β2-resonances is always larger than
Table 3 (continued)
aδ
0, B
1, and B
2were obtained by a fit of the data to Eq. 1. The errors correspond to a confidence level of 95%. Experimental conditions see Table 2. A B
2/B
1–value is given in brackets when its error is equal/
larger than the value itself
b
Tentative stereospecific assignment taken from free amino acids (Table 1)
c
Stereospecific assignments from Beck Erlach et al. (2017) using stereoselectively isotope labelled tetra- peptides
d
Mean values with standard deviation in brackets
Table 4 Pressure induced shifts in side chain nitrogen groups and their directly bonded protons
aa
δ
0, B
1, and B
2were obtained by a fit of the data to Eq. 1. The errors correspond to a confidence level of 95%. Experimental conditions see Table 2. A B
2/B
1-value is given in brackets when its error is equal/larger than the value itself
b
Stereospecific assignments from Harsch et al. (2013)
c
Mean values with standard deviation in brackets
Xxx Atom δ
0B
1B
2B
2/B
1(ppm) (ppm GPa
−1) (ppm GPa
−2) (GPa
−1)
Arg N
ε84.34 1.8 ± 0.3 − 4 ± 2 − 2.22 ± 1.17
H
ε7.245 − 0.14 ± 0.01 − 0.13 ± 0.07 0.93 ± 0.50
N
η170.48 5.4 ± 0.2 − 6.0 ± 0.9 − 1.11 ± 0.17
H
η11/η126.490 0.025 ± 0.001 − 0.02 ± 0.01 − 0.80 ± 0.40
N
η271.78 5.6 ± 0.2 − 8.8 ± 0.9 − 1.57 ± 0.17
H
η21/η226.892 − 0.026 ± 0.006 − 0.14 ± 0.04 5.38 ± 1.98
Asn N
δ113.25 7.7 ± 0.2 − 3.2 ± 0.9 − 0.42 ± 0.12
H
δ21 b7.691 0.14 ± 0.01 0.25 ± 0.05 1.79 ± 0.38
H
δ22 b6.990 0.39 ± 0.01 − 0.07 ± 0.05 − 0.18 ± 0.13
Gln N
ε112.93 7.5 ± 0.1 − 5.7 ± 0.7 − 0.76 ± 0.09
H
ε21 b7.639 0.09 ± 0.01 0.16 ± 0.05 1.78 ± 0.59
H
ε22 b6.939 0.41 ± 0.01 − 0.28 ± 0.05 − 0.68 ± 0.12
His N
δ1175.84 0.216 ± 0.005 − 0.19 ± 0.02 − 0.88 ± 0.09
(pH 4.0) N
ε2173.14 2.08 ± 0.06 − 4.7 ± 0.3 − 2.26 ± 0.16
Lys N
ζ32.61 3.0 ± 0.3 − 2.0 ± 1.5 − 0.67 ± 0.51
(H
ζ)
3+7.57 − 0.44 ± 0.03 0.2 ± 0.2 − 0.45 ± 0.46
Trp N
ε129.51 2.84 ± 0.08 − 1.4 ± 0.3 − 0.49 ± 0.11
H
ε110.197 − 0.24 ± 0.01 0.63 ± 0.05 − 2.63 ± 0.24
Mean
cN 107.1 (47.8) 4.0 (2.6) − 4.0 (2.7) − 1.15 (0.71)
H 7.52 (1.08) 0.023 (0.277) − 0.067 (0.275) − 0.57 (2.28)
that of the H
β3-resonances, the center of gravity of the two resonances moves upfield with pressure as also observed for all other unresolved methylene resonances except Asn and Asp. Here, both methylene resonances move down- field with pressure. This is probably due to the close-by carbonyl group of the side chain. In contrast to most of the methylene resonances, the resonances of the methine groups of Val and Thr shift downfield with pressure.
Pressure dependent shifts of side chain H
γ‑, H
δ‑, and H
ε‑methylene protons
The proton resonances of all γ-, δ-, and ε-methylene groups have a negative first order pressure coefficient (B
1< 0) and therefore shift upfield with pressure (Table 3). Most of them show a saturation-like behavior (B
2/B
1< 0). Omit- ting all resonances with an uncertainty equal/larger the value itself (values in brackets in Figs. 2 and 3), significant exceptions are the H
γ2- and H
γ3-resonances of Glu and the H
γ13-resonance of Ile.
Pressure response of methine protons in γ‑position and methyl protons
The methine resonances of Leu and Thr shift again upfield with pressure (B
1< 0) as already described for the methine group of valine. Thr shows a clear saturation-like behavior since B
2is positive. For Leu the error of is so large that a positive or negative sign of B
1is allowed within the limits of error. The methyl resonances of Ile, Leu, Val, Met, and Thr, shift upfield with pressure and all of them exhibit a saturation like behavior (Table 3). An analogous pressure response is also observed for the methyl group of Ala in β-position (Table 2).
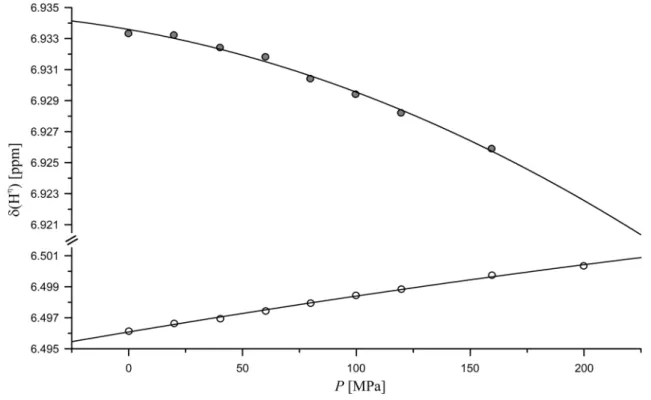
Pressure dependent shifts of protons in aromatic ring systems
All ring protons of Phe and Tyr show an upfield shift with pressure (B
1< 0) with a saturation like behavior (B
2> 0) (Table 3). This is also true for most of the ring proton reso- nances of Trp with exception of the H
δ1and the H
ζ2reso- nances. The latter resonances have positive first and second order pressure coefficients and shift therefore downfield with pressure. Both resonances are relatively close to the ring nitrogen and may be influenced by the pressure dependent polarization of the NH group. In line with this hypothesis,
Fig. 1 Pressure dependence of chemical shifts of the histidine H
β- resonances in Ac-GGHA-NH
2. Experimental conditions and fit parameters see Table 2, pH 8.5, temperature 283 K. (filled circle) H
β2,
(open circle) H
β3according to the tentative stereospecific assignment
obtained by comparison with the SAIL amino acids
also the proton resonances of His show an analogous pres- sure response at pH 4.0 and pH 8.5 with positive first order pressure coefficients. The B
2/B
1-ratio of the H
ε1–resonance of His at pH 4.0 is negative but positive at pH 8.5.
Pressure dependence of chemical shifts of side chain nitrogen and their directly bound hydrogen atoms
The resonances of side chain nitrogen atoms and their directly bonded hydrogen atoms are listed in Table 4. All side chain nitrogen resonances shift downfield with increas- ing pressure and show a slower increase of chemical shifts at higher pressures since B
2is always negative. The same behavior was observed earlier (Koehler et al, 2012) for the main chain nitrogen resonances.
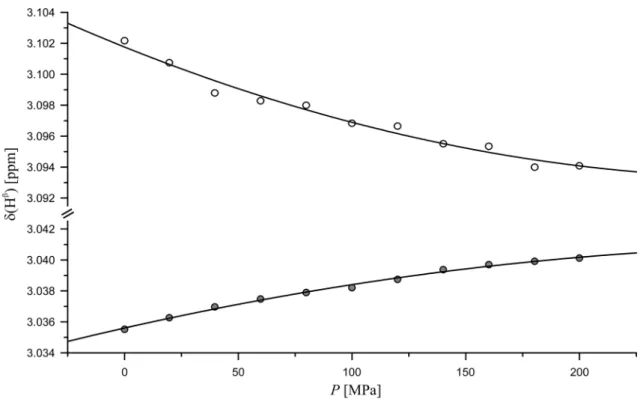
Pressure response of the arginine guanidino group
The
1H as well as the
15N resonances of the arginine guan- idino group are separated at 283 K and 800 MHz proton frequency and could be assigned stereospecifically (see above). At ambient pressure the H
η1and H
η2resonances are separated only by 0.44 ppm, the N
η1and N
η2resonances by 2.12 ppm (Table 4). At increasing pressure, the H
η1reso- nances, that are highfield shifted relative to the H
η2reso- nances, shift downfield and the H
η2resonances shift upfield
with pressure (Fig. 2). This means that these resonances become less separated at higher pressures. However, com- pared to their initial chemical shift difference this effect is rather small. Both N
η1and N
η2resonances first shift down- field with pressure (B
1> 0). At higher pressures they again become closer because of the more negative second order pressure coefficient of the downfield shifted resonance (Table 4). With higher pressure the corresponding proton resonances get broader probably because of the increased exchange rate with the water. Compared to the N
ηreso- nances, the N
εresonance shows with 1.8 ppm GPa
−1a sev- eral times weaker pressure response that get smaller at high pressure. This is because the second order pressure coef- ficient has the opposite sign of the first order pressure coef- ficient. The corresponding proton resonance shifts upfield with pressure; the shift changes get stronger with higher pressures since here both pressure coefficients have the same negative sign.
Pressure response of resonances of the nitrogen and its attached protons of the histidine and tryptophan rings The pressure dependence of the histidine nitrogen reso- nances could only followed at pH 4.0 with sufficient spec- tral quality. Under these conditions, the ring is positively charged and the two nitrogen atoms are protonated. The proton as well as the nitrogen resonances have positive
Fig. 2 Pressure dependence of the guanidino resonances in Ac-GGRA-NH
2. Experimental conditions and fit parameters see Table 4, pH 6.7,
temperature 283 K, (open circle) H
η11/η12, (filled circle) H
η21/η22B
1-values that is, they shift downfield with pressure in our pressure range. Since the B
2-values have signs opposite to the B
1-values, at higher pressure the downfield shifts are
attenuated. The B
1- and B
2-value of the N
ε2atom are approx- imately one order of magnitude larger than those of the N
δ1that shows only a very small pressure dependence. At higher
Fig. 3 Influence of N- and C- terminal protection on chemical shifts and first order pres- sure coefficients in the model peptides. The chemical shifts δ
0and the first order pressure coefficients B
1of side chain pro- tons of GGXA (Arnold et al..
2002) at pH 5.4 und T = 305 K are plotted versus those of Ac-GGXA-NH
2at pH 6.7 and 283 K. a H
N, b H
α, c H
β, d H
Xwith X other side chain protons.
The linear correlation coef-
ficients for δ
0for groups A to D
are 0.90, 0.99, 0.99, and 0.99,
respectively. For B
1they are
0.74, 0.65
pH values, histidine exists in two tautomers, the τ- and the π-tautomer, with either the N
ε2or the N
δ1being protonated.
At pH 8.5 preferentially the N
ε2atom remains protonated and is therefore characterized by relatively small chemical shift changes with pH. In contrast, the N
δ1atom shows much stronger pH-dependence of its chemical shift (Blomberg et al. 1977; Platzer et al. 2014) because of its deprotonation with increasing pH. This means that the relatively strong chemical shift response of the N
ε2atom is not due to a partial deprotonation because of a change of the pK
aof the histidine ring, as this would primarily influence the N
δ1shifts. The pressure response of the resonances of the protons directly bound to the ring nitrogens of histidine could not be esti- mated here since they are exchange broadened considerably.
The nitrogen resonance of Trp shows a chemical shift response similar to that of the histidine N
ε2. It is character- ized by a downfield shift with pressure that is slowed down at very high pressures. With a first order pressure coefficient of − 0.24 ppm GPa
−1, an upfield shift with pressure of the attached proton is observed that is opposite in direction and smaller than the backbone amide shifts with an average first order pressure coefficient of 0.52 ppm GPa
−1(Koehler et al.
2012).
Pressure response of the lysyl side chain amino group The nitrogen resonance of the lysyl amino group is shift- ing downfield with pressure as all side chain and back- bone nitrogen resonances. The corresponding protons shift upfield with pressure, in contrast to the expectation that the a decrease of the N–H bond length with pressure would induce a downfield shift (Wagner et al. 1983; Asakawa et al. 1998;
Li et al. 1998). The
1H linewidth of the amino group in the non-decoupled spectrum is approximately 62 Hz and is not influenced significantly by pressure at 283 K.
Pressure response of the amide group of Asn and Gln The amide side chain nitrogen resonances of Asn and Gln show the largest pressure response of all side chain nitrogen atoms, with B
1values of 7.7 and 7.5 ppm GPa
−1, respec- tively (Table 4). The observed downfield shifts with pres- sure are also significantly larger than the average backbone amide nitrogen shifts. Their mean B
1value is 2.91 ppm; the largest first order coefficient is found for Gly with 3.79 ppm GPa
−1, still smaller than the side chain amide shifts (Koe- hler et al. 2012). The amide side chain protons of Asn and Gln were assigned stereospecifically earlier (Harsch et al.
2013). Both proton resonances shift downfield with pres- sure. The two protons show a different pressure response with a larger shift for H
δ22in Asn as well as for H
ε22in Gln.
In HPr from S. carnosus almost all (7 out of 9) Asn and Gln amide protons could be assigned stereospecifically by
3D-NOESY spectroscopy and their pressure response could be analysed (Kalbitzer et al. 2000). In all side chains the first order pressure coefficients of the two protons are positive as in the tetrapeptide. At 298 K, except of Asn38 the B
1-values of the upfield shifted resonance (H
δ22in Asn and H
ε22in Gln) are much larger than the downfield shifted resonances.
However, at 278 K also in Asn38 the B
1-value of H
δ22is larger than that of H
δ21indicating a temperature induced exchange averaging of the two values. Also the nitrogen first order pressure coefficients are relatively large and posi- tive (average 7.67 ppm GPa
−1at 278 K). This value is very close to 7.6 ppm GPa
−1at 283 K, the mean value for Asn and Gln in our random-coil model although HPr is a quite rigid, well-folded protein. The hydrogen bonding expected in the protein appears to have no larger effect on the amide nitrogen pressure response. This is different for the hydrogen resonances: Here, the mean values for HPr at 278 K are with 0.22 and 1.11 ppm GPa
−1significantly larger than 0.12 and 0.40 ppm GPa
−1in the tetra peptide at 283 K indicating pressure induced changes in hydrogen bond lengths. The pressure coefficients of the amide side chains in the tetra- peptides predict that at lower pressures the shift difference between the two resonances decreases but increases again at pressures higher than 350 to 400 MPa, since the second order coefficients have different signs. It is expected that a similar behavior is found in the protein but no second order pressure coefficients have been determined here.
Influence of the N‑ and C‑terminal protection on the pressure response
Protection of the N- and C-terminus of tetrapeptides by
acetylation and amidation may influence also the pressure
response of amino acid Xxx in position 3. The chemical
shifts at ambient pressure δ
0and the first order pressure
coefficients B
1of different groups of atoms of the unpro-
tected tetrapeptides are plotted against the corresponding
values in the protected tetrapeptides in Fig. 3. For the indi-
vidual chemical shifts δ
0of the main chain amide protons
significant deviations from the correlation line are observed,
although the Pearson correlation coefficient is with 0.90 still
quite high. For the other three groups of atoms investigated
here (H
α, H
β, H
X) (Fig. 3) almost perfect correlations of
the chemical shifts at ambient pressure are observed with
correlation coefficients of 0.99 indicating that they are not
influenced significantly by the protecting groups. The vari-
ations of the H
N-shifts may mainly be due to the different
experimental temperatures in the two data sets, since the
temperature dependence of these shifts is known to vary
from amino acid to amino acid (Jimenez et al. 1986; Kjaer-
gaard et al.2011a). In general, for the first order pressure
coefficients much larger deviations from a linear correla-
tion are observed. A simple reason for these deviations may
be that only the pressure response of the H
N-resonances was fitted by a second degree polynomial by Arnold et al.
(2002) but that of the other proton resonances only by a first degree polynomial. In contrast, in the present paper the data quality was high enough to fit all data with a sec- ond degree polynomial. In addition, temperature and pH is different in the two studies and protected tetrapeptides are compared with unprotected tetrapeptides where the termini are at least partly charged. In agreement with the effect of the fitting procedure, the correlation of the B
1-values of the amide proton resonances is with 0.74 significantly higher than 0.65, 0.61, and 0.57 found for the H
α-, H
β-, and the H
X- (X, other side chain protons than H
αor H
β) resonances, respectively (Fig. 3). A few amino acids show deviations of the first order pressure coefficients from the correlation line, the largest deviations are observed for the H
αof Asp and Glu, the H
βand the H
ζof Lys (Fig. 3). For Asp and Glu pH-dependent differences in protonation states of the car- boxyl groups may be the reason and/or the interaction of the charged side chain with the charged N-or C-termini in the unprotected tetrapeptides. For H
ζof Lys only the latter effect can apply. For GGEA the effect of the terminal charges on the pressure response was already published by Kremer et al.
(2003), where the modification of the C-terminal carboxyl group strongly changes the pressure response. However, also polar uncharged residues such as Asn or Tyr show a strong effect on their pressure response when the terminal groups are modified. This again stresses the effects of the charged groups of the termini on the pressure response.
Neighborhood effects on the pressure response The chemical shifts of a given amino acid in random-coil peptides are dependent on the next neighbors in the sequence.
They can be corrected by using a simple additive model (Braun et al. 1994; Wishart et al. 1995a; Schwarzinger et al.
2001; Tamiola et al. 2010; Kjaergaard et al. 2011a; Kjaer- gaard and Poulsen 2011b). A similar effect from neighboring amino acids in the sequence can be expected for the pres- sure response. The data were evaluated analogously to the method applied by Schwarzinger et al. (2001) to the penta- peptide Ac-GGXGG-NH
2in 8 M urea at pH 2.3 and 293 K.
However, since we have a tetrapeptide, only the correction factors C
−1,a1,2(y), C
1,2+1,a(y), and C
+2,a1,2(y) for atoms a could be determined (see “Materials and methods” Section) with C
−j,a1,2(y) correction factors for atom a in amino acid X in posi- tion i when amino acid y is located at position i + j in the sequence. The mean sequence correction factors calculated in our peptide for H
Nand H
αfor the shifts at ambient pressure agree well with those obtained by the others groups. They are − 0.03, − 0.08, and 0.09 ppm for H
Nand − 0.03, − 0.03,
− 0.03 ppm for H
αfor Gly1, Gly2, and Ala4, respectively. In Ac-GGXGG-NH
2, they are − 0.01, − 0.05, 0.15 ppm for H
Nand − 0.03 − 0.02, − 0.03 ppm for H
αfor Gly1, Gly2, and Gly4 as reported by Schwarzinger et al. (2001). The average correction factors reported by Kjaergaard et al. (2011a) are even closer to our values with − 0.02, − 0.07, 0.09 ppm for H
Nand − 0.02, − -0.02, − 0.03 ppm for H
αfor Gly1, Gly2, and Gly4. However, the individual values correlate relatively weakly between all three data sets. This is probably due to different experimental conditions, especially the urea concen- tration, the pH, and the experimental temperatures. Most of the correction factors for the first order pressure coefficients of amide backbone protons are positive (Table 5). The strongest effects on the pressure response are observed when the amino acid directly preceding amino acid X is not a Gly. In aver- age, B
1is increased by 0.08 ppm GPa
−1and B
2decreased by 0.08 ppm GPa
−2. Since also all experimental first order coef- ficients of amide protons are positive (Koehler et al. 2012), the positive correction factor leads to a larger downfield shift with pressure except of Ser, His and Gln that cause a quite small decrease of the pressure response. The largest corrections are observed for aromatic residues and amino acids with long side chains in position i−1. The maximum correction for B
1is required for Leu with 0.18 ppm GPa
−1. The effect of amino acids following amino acid X is in the average smaller than that due to the preceding amino acid. It is similar in position i + 1 and i + 2. For the amino acid in position i + 1 the average corrections for the first order and second order pressure coef- ficient are 0.01 GPa
−1and − 0.05 ppm GPa
−2; in position i + 2 they are 0.04 GPa
−1and − 0.05 ppm GPa
−2.
The corrections for the H
αpressure induced shifts are substantially smaller than those for the amide protons.
Again, the effects of the preceding amino acid are stronger than the effects of the succeeding amino acids. The average corrections required for B
1and B
2by amino acids in position i−1 are − 0.03 GPa
−1and 0.03 ppm GPa
−2, respectively. The corresponding values for the succeeding amino acids are
− 0.02 GPa
−1and 0.01 ppm GPa
−2(i + 1), and 0.00 GPa
−1and 0.01 ppm GPa
−2(i + 2).
Since most of the H
αresonances shift upfield with pres- sure (Beck Erlach et al. 2016), the negative correction fac- tors for B
1values intensify the downfield shift. It has been observed earlier and also verified here for the side chain atoms that most second order coefficients have an opposite sign relative to the first order coefficient (Beck Erlach et al.
2016). The same is true for the correction factors, meaning that in most cases the curvature is enhanced by amino acids other than Gly in the neighborhood.
From our data set, also the correction factors C
1,2−1,a(y) for
the β-methyl group of Ala can be derived. The correction
factors C
−1,a1vary between − 0.12 and 0.01 ppm GPa
−1and
the correction factors C
2−1,abetween − 0.05 and 0.03 ppm
GPa
−2and thus are of the same order of magnitude than the
corresponding B
1and B
2values themselves of − 0.022 ppm
GPa
−1and 0.02 ppm GPa
−2, respectively (Table 3 and 4).
Table 5 Sequence dependent correction factors for the pressure coefficients B
1and B
2Yyy Atom B
1B
2(ppm GPa
−1) (ppm GPa
−2)
C
−1,a1
C
+1,a1
C
+2,a1
C
−1,a2
C
+1,a2
C
+2,a2