MBT and SRF
Grain Size Dependent Distribution of Contaminants in Coarse-Shredded Commercial Waste –
As, Cd, Co, Cr, Hg, Ni, Pb, Sb, and Cl*
Sandra A. Viczek, Karim Khodier, Roland Pomberger and Renato Sarc
1. SRF relevant contaminants ...414
1.1. Accumulation of specific contaminants in the fine fraction – reports in literature and discussion of possible origins...414
1.2. Aim ...415
2. Materials and methods ...415
3. Results and discussion ...416
3.1. Grain size dependent distribution ...416
3.1.1. Arsenic, cobalt, chromium, mercury, nickel ...417
3.1.2. Lead ...420
3.1.3. Cadmium, antimony, and chlorine ...422
3.1.4. Percentage distribution of the total loads of the investigated analytes ....424
3.2. Estimating the effect on SRF quality by removing fine fractions during waste processing ...425
4. Conclusions and outlook ...427
5. Literature ...427 Several elements that can be considered as pollutants or contaminants (from an envi- ronmental perspective) are nowadays used in a broad range of products for technical, chemical and other reasons. As soon as these products reach the end of their life cycle, they become part of the waste streams together with the contained contaminants. In Austria as well as in several other countries where landfilling of untreated waste has been restricted, mixed municipal and commercial wastes are frequently processed to solid recovered fuel (SRF). SRF can be used to substitute primary fuels in energy- intensive industries such as cement industry, provided that quality criteria defined by the cement plant operators as well as legal restrictions are met [12, 16].
In order to produce quality assured SRF that meets these requirements, selected chemical parameters have to be monitored and streams of specific elements have to be managed and – if necessary – altered. This task requires previous knowledge about the main fractions containing the relevant chemical elements. Such fractions can either be defined by materials, but also by grain size, as suggested by sieving experiments of
* peer reviewed paper
MBT and SRF
commercial waste: Adam et al. [1] observed different distribution patterns of antimony (Sb), cadmium (Cd), chromium (Cr), and nickel (Ni) among different grain sizes. This implies that comparably simple measures, such as screening, can be used to manage contaminant streams and to maintain or improve SRF quality. For this reason, the work at hand aims at studying the grain size dependent distribution of several chemical elements in mixed commercial waste in more detail, focusing on contaminants that are relevant to SRF and its application in the Austrian cement industry.
1. SRF relevant contaminants
Relevant contaminants for SRF can be identified based on legal directives and process requirements. In Austria, the national waste incineration ordinance (WIO) [5] defines legal limit values for arsenic (As), cadmium (Cd), cobalt (Co), chromium (Cr), mercury (Hg), nickel (Ni), lead (Pb), and antimony (Sb). These limit values need to be complied with when SRF is designated to be used in the industry, e.g. in cement manufacturing.
In addition, cement plant operators usually restrict the chlorine (Cl) content in order to avoid problems in the clinker burning process. Cl values are usually required to range below 1 or even 0.8 %DM [12]. Although stricter or additional limit values are possible, these nine elements represent the most relevant ones to be met by Austrian SRF producers and cement plants, and therefore will be focused on in this paper.
1.1. Accumulation of specific contaminants in the fine fraction – reports in literature and discussion of possible origins
Some elements that accumulate in the fine fractions of waste streams have already been observed in literature as results of sorting analyses. For example, in comparison with other investigated material fractions, high concentrations of Cl were reported in the fine fraction [7] and were linked to the presence of table salt or wood shavings from pressboards. Furthermore, elevated concentrations of Pb [4, 6, 13, 15], Hg [3, 4, 13], Cr [4], Co [4, 13], and Ni [2, 4, 13, 14] were reported for fine fractions with different grain sizes. Some of these metals, especially Cr, Ni, and Co, but also Pb, are frequently used in metal alloys [8, 9], and high concentrations of these elements seem to occur in the fine fractions together [4, 13], sometimes also in combination with iron (Fe) [13]. This leads to the assumption that small metal parts could be responsible for the elevated concentrations of these elements that were observed and reported in the above mentioned publications [2-4, 6, 13-15].
High concentrations of Pb were furthermore reported in ash [10], which could be an- other possible explanation for elevated Pb concentrations in the fine fraction. Elemental Hg, in contrast, is assumed to attach to all materials with a high specific surface area [3], which is probably causing the elevated levels of Hg that are reported for vacuum cleaner bags [3]. Based on its industrial applications, high Hg concentrations in fine waste fractions could also be a result of fluorescent tubes that still end up in mixed waste to some extent as well as mercury thermometers, or small coin cell batteries (depending on the sample preparation prior to analysis).
MBT and SRF
1.2. Aim
The aim of this work is to determine specific grain size dependent distributions of several chemical elements in mixed commercial waste and to point out possible trends in order to draw conclusions regarding the removal of these elements for improving or maintaining a high SRF quality. Although many more chemical elements have been analysed, the present work focuses on the nine main chemical elements relevant to SRF that were introduced in Chapter 1.1. Furthermore, in the present approach, variations in and the heterogeneity of the investigated waste stream are accounted for by processing and analysing a total of ten representative samples. This allows for a better interpretation of the data achieved and considerably increases the confidence in the observed trends.
2. Materials and methods
Approximately 40 metric tons of mixed commercial waste from the area of Graz, Aus- tria, were coarsely shredded using a mobile single-shaft coarse shredder (Terminator 5000 SD with F-type cutting unit) at 18.6 rpm and with a completely closed cutting gap. The shredder was fed using a wheel loader while slowly moving forward, forming a windrow of the material that was discharged via the conveyor belt included in the machine. In time intervals of 30 seconds, a total of 200 sample increments (each of them with a mass of ~12 kg) were taken from the falling waste stream at the end of the conveyor belt using sampling troughs (dimensions: 1.17 x 0.37 x 0.30 m). Represent- ative samples were extracted by combining 20 of the sample increments taken in time intervals of five minutes each. In total, ten representative samples, each with a mass of
~ 240 kg, were generated.
The ten representative samples were subsequently screened with a batch drum screen and – if appropriate – reduced in size to generate nine grain size fractions, i.e.:
< 5 mm, 5 to 10 mm, 10 to 20 mm, 20 to 40 mm, 40 to 60 mm, 60 to 80 mm, 80 to 100 mm, 100 to 200 mm, and 200 to 400 mm. The sampling procedure, sample process- ing, and calculations are described in detail elsewhere [11]. Every grain size fraction
> 20 mm was manually sorted to determine the material composition, and was reunited for chemical analyses afterwards.
All nine grain size fractions of each qualified sample (i.e. a total of 90 samples) were chemically analysed in order to determine the grain size dependent distribution of altogether 34 chemical elements. The samples were dried to constant mass at 105 °C, comminuted to a size < 0.5 mm, reduced in mass, and homogenized. Interfering impu- rities (e.g. solid metals parts) were removed during sample preparation, weighed, and their weight was accounted for when the results were calculated. For this reason, metal parts (unless very small, e.g. abrasions) and other hard impurities were not part of the analysis, which is usually the state of the art in laboratory analyses of waste samples.
Microwave-assisted acid-digestion (ÖNORM EN 13656) followed by ICP-MS analy- sis (based on ÖNORM EN 15411 and ÖNORM EN 17294-2) was used to determine the concentrations of lithium (Li), beryllium (Be), sodium (Na), magnesium (Mg),
MBT and SRF
aluminium (Al), silicon (Si), phosphorus (P), potassium (K), calcium (Ca), titanium (Ti), vanadium (V), manganese (Mn), iron (Fe), cobalt (Co), nickel (Ni), copper (Cu), zinc (Zn), arsenic (As), selenium (Se), strontium (Sr), molybdenum (Mo), palladium (Pd), silver (Ag), cadmium (Cd), tin (Sn), antimony (Sb), tellurium (Te), barium (Ba), tungsten (W), mercury (Hg), thallium (Tl), and lead (Pb). The chlorine (Cl) content was determined by ion chromatography (DIN EN ISO 10304-1) after calorimetric digestion (ÖNORM EN 14582).
It has to be noted that because of the volatility of elemental Hg waste samples are usually dried at 40 °C before Hg analysis. In the present experiments, all samples were dried at 105 °C. It is assumed that elemental Hg is also volatilized when the samples are dried at 40 °C. Furthermore, it has to be considered that the waste samples already passed several process steps (coarse shredding, sieving) and are further comminuted in the laboratory during sample preparation. Especially during the comminution steps temperatures exceeding 40 °C cannot be excluded. In light of these facts the authors assume that the drying temperature does not significantly influence the analysis results, and that mainly Hg that is somehow bound is determined. The need of a drying step at lower temperatures is currently also reevaluated by the Environment Agency Austria (Umweltbundesamt) [18].
3. Results and discussion
3.1. Grain size dependent distribution
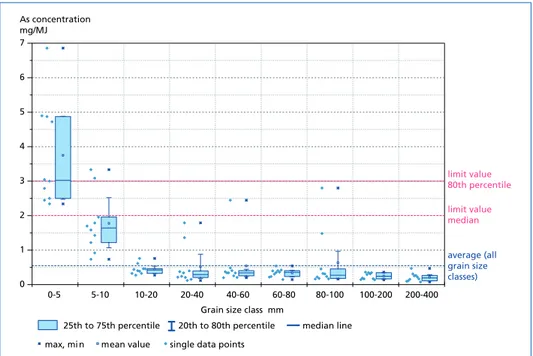
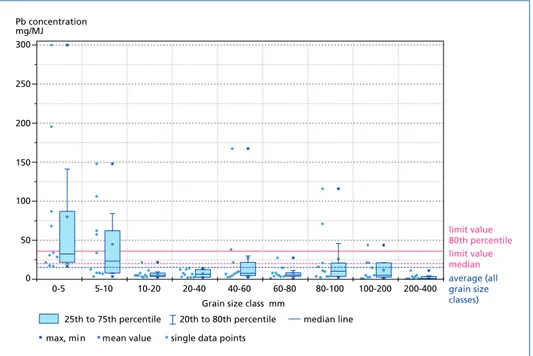
To assess the grain size dependent distribution of the investigated elements and to identify possible trends or tendencies, the concentrations of the analytes in the nine grain size fractions are plotted as boxplots. To facilitate the comparison of the observed analyte concentrations in each grain size class with the limit values stated in the Austrian WIO, the analyte concentrations are given in mg/MJ, and the median and 80th percentile limit values are indicated in the diagrams. The whiskers of the boxplot represent the 20th and 80th percentile of the obtained results. For every gain size, the single data points are presented left to the corresponding boxplot. Furthermore, the calculated average concentration [mg/MJ] for the original waste mix is indicated.
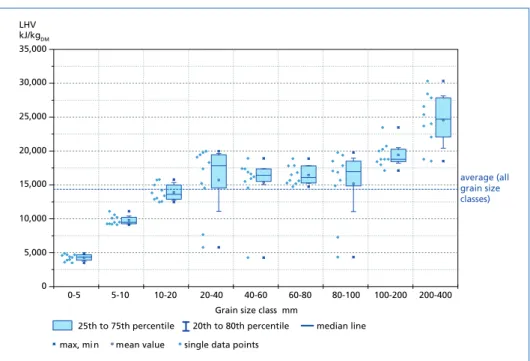
As the values are stated in mg/MJ, attention has to be paid to the lower heating value (LHV), which is presented for all nine grain size fractions of all ten representative samples in Figure 1. Apart from some outliers, a clear trend for the LHV is visible:
it increases with increasing grain sizes and stays rather constant at middle grain size classes between 20 and 100 mm. The overall LHV of the investigated waste stream is 14.35 MJ/kgDM. It is important to acknowledge that this trend for the LHV also influences the concentrations of the determined analytes when calculated in mg/MJ according to the Austrian WIO [5].
Three different patterns were identified for the grain size dependent distribution of analyte concentrations, which is why the results are presented in three groups:
MBT and SRF
1. analytes that occur in higher concentrations (mg/MJ or mg/kg) in small grain size fractions and show a a trend of decreasing concentrations with increasing grain sizes (e.g. As, Co, Cr, Hg, and Ni),
2. analytes that only show this trend when plotted in mg/MJ (e.g. Pb),
3. analytes that show no specific trend when plotted in mg/MJ or mg/kg (e.g. Cd, Sb, Cl), or analytes that even show a trend of increasing concentrations towards larger grain sizes when plotted in mg/kg (e.g. Sb and Cl).
Figure 1: Lower heating value (LHV) of the separated grain size classes of coarsely shredded mixed commercial waste
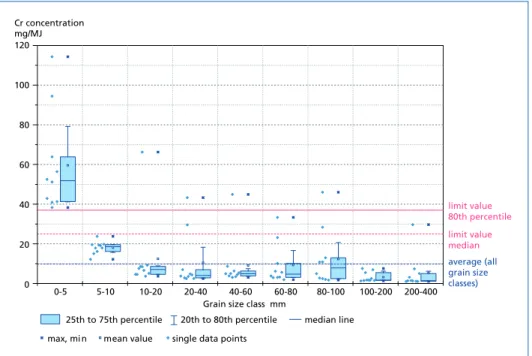
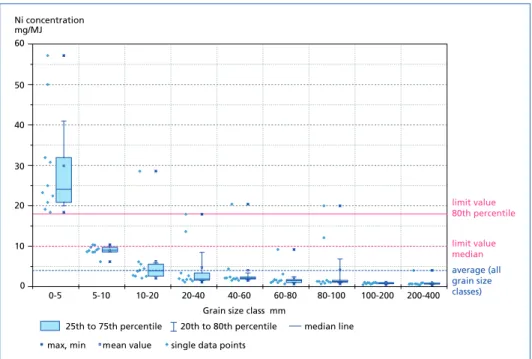
3.1.1. Arsenic, cobalt, chromium, mercury, nickel The highest concentrations (both in mg/kg and mg/MJ) for As, Co, Cr, Hg, and Ni were found in the grain size fraction of 0 to 5 mm, followed by the grain size fraction 5 to 10 mm. A clear trend of increasing concentrations with decreasing grain sizes becomes visible, especially when the data is plotted as mg/MJ and compared with the median and 80th percentile WIO limit values (Figure 2 to 6). The data show that the fraction < 5 mm often exceeds these limit values. This is particularly the case for Co, Cr, Hg, and Ni (Figures 3 to 6), where every single data point of the fraction 0 to 5 mm exceeds the 80th percentile limit value. For arsenic, 50 % of the data points (for 0 to 5 mm) exceed the 80th percentile limit value but all data points for this fine fraction exceed the median limit value.
25th to 75th percentile 20th to 80th percentile median line max, min mean value single data points
35,000 LHV kJ/kgDM
30,000
25,000
20,000
15,000
10,000
5,000
0-5 5-10 10-20 20-40
Grain size class mm
40-60 60-80 80-100 100-200 200-400
average (all grain size classes)
0
MBT and SRF
Figure 2: Arsenic concentration of different grain size classes of coarsely shredded mixed com- mercial waste
Figure 3: Cobalt concentration of different grain size classes of coarsely shredded mixed commercial waste
0 1 2 3 4 5 6 7
25th to 75th percentile 20th to 80th percentile median line max, min mean value single data points
0-5 5-10
mg/MJ As concentration
10-20 20-40
Grain size class mm
40-60 60-80 80-100 100-200 200-400
limit value 80th percentile limit value median
average (all grain size classes)
25th to 75th percentile 20th to 80th percentile median line max, min mean value single data points
0-5 5-10
mg/MJ Co concentration
10-20 20-40
Grain size class mm
40-60 60-80 80-100 100-200 200-400
limit value 80th percentile limit value median average (all grain size classes) 0
1 2 3 4 5 6 7 8 9
MBT and SRF Figure 4: Chromium concentration of different grain size classes of coarsely shredded mixed
commercial waste
Figure 5: Mercury concentration of different grain size classes of coarsely shredded mixed com- mercial waste
25th to 75th percentile 20th to 80th percentile median line max, min mean value single data points
0-5 5-10 10-20 20-40
Grain size class mm
40-60 60-80 80-100 100-200 200-400
limit value 80th percentile limit value median average (all grain size classes) 0
20 40 60 80 100 120 mg/MJ Cr concentration
0 0.2 0.4 0.6 0.8 mg/MJ Hg concentration
25th to 75th percentile 20th to 80th percentile median line max, min mean value single data points
0-5 5-10 10-20 20-40
Grain size class mm
40-60 60-80 80-100 100-200 200-400
limit value 80th percentile limit value median average (all grain size classes)
MBT and SRF
Figure 6: Nickel concentration of different grain size classes of coarsely shredded mixed commercial waste
Possible reasons for the high concentrations of some of these elements were brief- ly discussed in Chapter 1.1. In the examined waste stream, high concentrations of Co, Cr, and Ni all occur in the same small grain sizes, and the data suggests slight correlations in the grain sizes < 20 mm between Co and Ni (R² = 0.71), Co and Cr (R² = 0.83), Cr and Ni (R² = 0.91), and between Fe and Co, Fe and Ni, and Fe and Cr (R² > 0.7). Therefore, it is well possible that the increased concentrations are caused by small metal parts, e.g. abrasions from stainless steel, etc. These metal parts were not part of the analysis in larger grain size fractions, as they were removed during sample preparation. A final conclusion would need further investigations including scanning electron microscope (SEM) analyses.
3.1.2. Lead (Pb)
As for the elements discussed above, the highest Pb concentrations in mg/kg were as well observed in the small grain size fractions of 0 to 5 and 5 to 10 mm. However, no real trend in analyte concentrations is visible (Figure 8) unless the concentrations are given as mg/MJ (Figure 7). A comparison of the lead concentrations found with the WIO limit values shows that also the limit values for lead are frequently exceeded in the fractions 0 to 5 mm and 5 to 10 mm.
0 10 20 30 40 50 60 mg/MJ Ni concentration
25th to 75th percentile 20th to 80th percentile median line max, min mean value single data points
0-5 5-10 10-20 20-40
Grain size class mm
40-60 60-80 80-100 100-200 200-400
limit value 80th percentile limit value median average (all grain size classes)
MBT and SRF Figure 7: Lead concentration of different grain size classes of coarsely shredded mixed commercial
waste
Figure 8: Lead concentration of different grain size classes of coarsely shredded mixed commercial waste
0-5 5-10 10-20 20-40 40-60 60-80 80-100 100-200 200-400
mg/MJ Pb concentration
25th to 75th percentile 20th to 80th percentile median line max, min mean value single data points
Grain size class mm
limit value 80th percentile limit value median average (all grain size classes) 300
250
200
150
100
50
0
Pb concentration mg/kgDM
0-5 1,400
1,200
1,000
800
600
400
200
0 5-10 10-20 20-40 40-60 60-80 80-100 100-200 200-400
25th to 75th percentile 20th to 80th percentile median line max, min mean value single data points
Grain size class mm
average (all grain size classes)
MBT and SRF
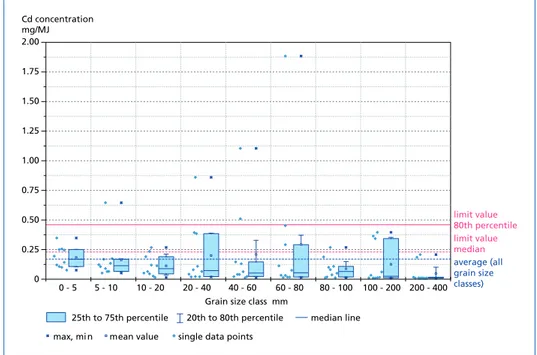
3.1.3. Cadmium, antimony, and chlorine
The third group of investigated elements consists of analytes that – due to their industrial uses – are rather associated with plastics, i.e. a material fraction having a high LHV.
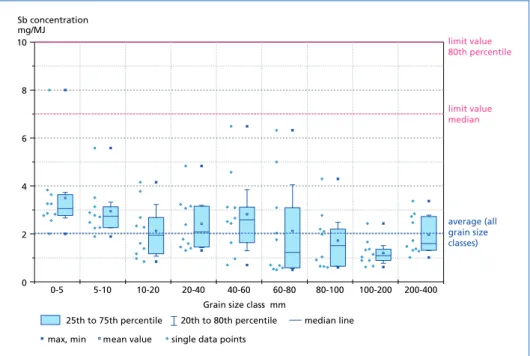
Therefore, these elements do not show concentration and grain size related trends when plotted in mg/MJ, as the amount of the analyte and the LHV of the fraction increase at the same time. However, while Cd does not show a trend at all, the concentrations of Sb and Cl in mg/kg or mass-%, respectively, increase with increasing grain sizes.
This can probably be linked to the flexibility of the materials that Sb and Cl usually occur in. Sb, for example, is used as a flame retardant synergist in textiles and plastics and as a catalyst for the production of polyethylene terephthalate (PET) [17]. Cl is often introduced into the waste stream in the form of polyvinyl chloride (PVC) [7]. It is likely that major parts of these flexible materials are not comminuted to very small sizes with just one shredding step and therefore end up in larger grain size fractions.
A comparison of the observed concentrations with the WIO limit values shows that apart from some outliers, Cd concentrations usually remain below the 80th percentile limit value (Figure 9). Not a single data point for Sb exceeds the 80th percentile limit value and just one data point in the fraction < 5 mm exceeds the WIO median limit value (Figure 10). The Cl content of single grain size classes however frequently and significantly exceeds the desired Cl content of 1 %DM. Based on these results, screening does not appear to be a suitable approach for decreasing the Cd, Sb, and Cl contents in waste fractions for SRF processing.
Figure 9: Cadmium concentration of different grain size classes of coarsely shredded mixed com- mercial waste
0 - 5 5 - 10 10 - 20 20 - 40 40 - 60 60 - 80 80 - 100 100 - 200 200 - 400 Grain size class mm
limit value 80th percentile limit value median average (all grain size classes) mg/MJ
2.00
1.75
1.50
1.25
1.00
0.75
0.50
0.25
0
Cd concentration
25th to 75th percentile 20th to 80th percentile median line max, min mean value single data points
MBT and SRF Figure 10: Antimony concentration of different grain size classes of coarsely shredded mixed
commercial waste
Figure 11: Chlorine concentration of different grain size classes of coarsely shredded mixed commercial waste (Cl is not limited by the WIO; SRF users desire a Cl concentration
< 1 %DM)
mg/MJ Sb concentration 10
8
6
4
2
0 0-5 5-10 10-20 20-40 40-60 60-80 80-100 100-200 200-400
25th to 75th percentile 20th to 80th percentile median line max, min mean value single data points
Grain size class mm
limit value 80th percentile
limit value median
average (all grain size classes)
0 0.5 1.0 1.5 2.0 2.5 3.0
Cl concentration mass-%DM
0-5 5-10 10-20 20-40 40-60 60-80 80-100 100-200 200-400
25th to 75th percentile 20th to 80th percentile median line max, min mean value single data points
Grain size class mm
average (all grain size classes)
MBT and SRF
3.1.4. Percentage distribution of the total loads of the investigated analytes To identify the grain size fraction that contributes the highest amount of contaminants, the total mass of the fractions needs to be taken into account. The percentage distri- bution of the total load of the analytes is depicted in Figure 12. Results show that the fine fraction < 5 mm contributes the maximum amount (percentage) of Hg, Co, Ni, As, Cr, and Pb. In case of Hg, even 40 % of the element is located in the fine fraction
< 5 mm. On the contrary, the largest loads of Cd, Sb, and Cl are located in larger grain size fractions. The average contaminant concentration in mg/kg and mg/MJ in the original waste mix (calculated from the analyses of the single grain size fractions) is given in Table 1.
Table 1:
Average analyte concentrations in mixed commercial waste (n=10; mix of all grain size frac- tions based on fraction masses and analyte concentrations in fractions, calculated)
Figure 12:
Average contributions of the different grain size fractions to the total content [mg analyte]
of Hg, Co, Ni, As, Cr, Pb, Cd, Sb, and Cl in coarsely shredded mixed commercial waste
Parameter Concentration
mg/kgDM mg/MJ
Hg 0.52 0.036
Co 9.1 0.65
Ni 57 4.0
As 7.9 0.55
Cr 140 9.8
Pb 220 15.3
Cd 2.4 0.17
Sb 29 2.0
Cl 7,600 530
40
10 9 11 7 6 5
10 2 Hg %
32
13 9 8 8 8
6 12 3
As %
31
8 11 9 8 12
7 9 4
Cr % 39
9 10 8 12
6 5 8 3
Co %
37
13 10 11 8
8 5 6 2
Ni %
10 7
12
17 11 15 6
19 4 Cd %
8 6 10
16 15 13 8
17 7 Sb %
24
11 7 5 13 8 11
20 2 Pb %
4 3 10
13
15 17 7 24
7 Cl %
0-5 mm 60-80 mm
5-10 mm 80-100 mm
10-20 mm 100-200 mm
20-40 mm 200-400 mm
40-60 mm
MBT and SRF
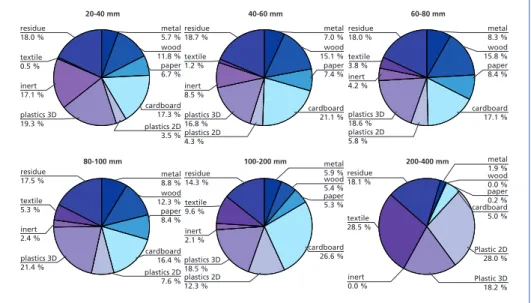
The material composition of the different grain size classes > 20 mm is depicted in Figure 13. It shows that especially the grain size fraction 200 to 400 mm significantly differs from the other fractions, as it mainly consists of textiles, plastics 2D (e.g. plastic foils) and plastics 3D (three-dimensional plastic parts).
residue
18.0 % residue
18.7 % textile
0.5 %
textile 1.2 % inert 8.5 %
residue 18.0 % textile 3.8 % inert 4.2 %
plastics 3D 16.8 % plastics 2D 4.3 %
plastics 3D 18.6 % plastics 2D 5.8 % inert
17.1 % plastics 3D 19.3 %
residue 17.5 % textile 5.3 % inert 2.4 %
residue 14.3 % textile 9.6 %
residue 18.1 %
textile 28.5 % inert
2.1 % plastics 3D
21.4 % plastics 3D
18.5 % plastics 2D 12.3 % plastics 2D
3.5 % cardboard 17.3 % paper 6.7 % wood 11.8 % metal 5.7 %
plastics 2D 7.6 % cardboard 16.4 % paper 8.4 % wood 12.3 % metal 8.8 %
cardboard 26.6 % paper 5.3 % wood 5.4 % metal 5.9 %
metal 1.9 % wood 0.0 % paper 0.2 % cardboard 5.0 %
Plastic 2D 28.0 % Plastic 3D 18.2 % cardboard
21.1 % paper 7.4 % wood 15.1 % metal 7.0 %
cardboard 17.1 % paper 8.4 % wood 15.8 % metal 8.3 %
20-40 mm 40-60 mm 60-80 mm
80-100 mm 100-200 mm 200-400 mm
inert 0.0 %
Figure 13: Average composition of the different grain size fractions of coarsely shredded mixed commercial waste with respect to material classes.
Adapted and extended from: Khodier, K., Viczek, S. A., Curtis, A., Aldrian, A., O’Leary, P., Lehner, M., and Sarc, R.: (submitted).
Sampling and analysis of coarsely shredded mixed commercial waste; Part I: procedure, particle size and sorting analysis. Inter- national Journal of Environmental Science and Technology [under review], 2019.
3.2. Estimating the effect on SRF quality by removing fine fractions during waste processing
Based on the analytical data obtained, the average effect of screening at 5 mm or 10 mm and removing the underflow material on the contaminant concentrations of SRF in mg/kg and mg/MJ can be calculated.
The reported results show that removing the material fraction with a grain size be- low 5 mm leads to an increase in heating value, and simultaneously to a decrease of Hg, As, Cr, Co, Ni, and Pb concentrations expressed both in mg/kg and in mg/MJ (Figure 14). The reduction of element concentrations calculated in mg/MJ is in general higher than the reduction in mg/kg. This results from the overall increase of the LHV in MJ/kg by about 14% when the fine fraction with a low LHV is removed. For Cd, Sb, and Cl an increase of concentrations in mg/kg is observed, as the grain size fraction containing only little amounts of these elements is removed, but the mass of the waste stream is reduced by 16.6 % on average. However, when the change in concentration of Cd, Sb, and Cl in mg/MJ is calculated, a decrease can be observed for Cd and Sb,
MBT and SRF
and the overall concentration of Cl remains the same as in the original waste. However, unlike the elements regulated by the Austrian WIO, the chlorine content is usually not expressed in mg/MJ, but in mass percent. For this reason, the chlorine concentration needs to be considered as experiencing a significant increase.
Figure 14: Average effect of removing the screen underflow < 5 mm on contaminant concentrations, LHV, and total mass of the waste stream; the effect is depicted as the percentage change in mass (referring to kg), LHV (referring to MJ/kg), or contaminant concentrations (referring to mg/kg and mg/MJ)
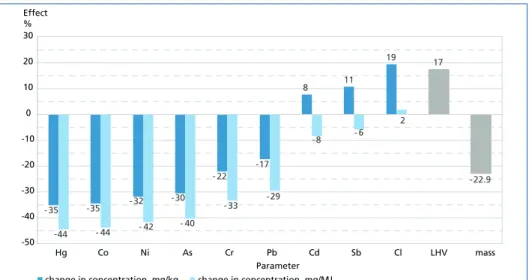
Figure 15: Average effect of removing the screen underflow < 10 mm on contaminant concentrations, LHV, and total mass of the waste stream; the effect is depicted as the percentage change in mass (referring to kg), LHV (referring to MJ/kg), or contaminant concentrations (referring to mg/kg and mg/MJ)
-28 -27 -25
-20 -18
-9
8 10
14 14
-16.6
-37 -36 -34
-29 -28
-20
-5 - 4 0
-50 -40 -30 -20 -10 0 10 20 30
Hg Co Ni As Cr Pb Cd Sb Cl LHV mass
Effect
%
Parameter
change in concentration mg/kg change in concentration mg/MJ
- 35 -35 - 32 -30
- 22 -17
8 11
19 17
-22.9
-44 - 44 - 42 - 40
- 33 -29
-8 - 6
2
-50 -40 -30 -20 -10 0 10 20 30
Hg Co Ni As Cr Pb Cd Sb Cl LHV mass
Effect
%
Parameter change in concentration mg/kg change in concentration mg/MJ
MBT and SRF
When all material with a grain size below 10 mm is removed, which on average amounts for 22.9 % of the mass of the examined waste stream, the LVH is further increased, and the reduction of Hg, As, Cr, Co, Ni, Pb, Cd, and Sb is even higher in mg/MJ while the chlorine concentration in contrast is again substantially increased (Figure 15).
It has to be noted that, while the quality of the screen overflow is improved with respect to heating value and WIO relevant contaminants, the screen underflow represents a poor quality waste fraction with a very low LHV that exceeds many of the limit values for contaminants in SRF defined by the Austrian WIO [5]. For this reason, separate treatment pathways for this low grade fraction have to be discussed if such a fraction is removed from the waste stream during SRF processing (note: classical waste incin- eration is legally and technically a possible option).
4. Conclusions and outlook
The results obtained show that although none of the WIO limit values are exceeded by the original mixed commercial waste sample, single grain size fractions significantly exceed the limits. If an SRF producer aims at increasing the quality by further decreas- ing WIO-relevant concentrations of Hg, Co, Ni, As, Cr, Pb, Cd, and Sb in mg/MJ and improving the heating value, it is likely that this can be achieved by removing the small grain size fraction below 5 or 10 mm of the shredded mixed commercial waste. Losing about 20 % of the mass, the contaminant concentrations can be significantly decreased, and the heating value can be reasonably increased. However, a separate treatment for the removed low grade fraction that is rich in contaminants has to be found.
Future work will include the analysis of the grain size dependent distribution of more than 20 other elements that were analysed as well. The data will be combined with the material composition that was determined by sorting analyses of the grain size fractions, and correlations between different elements as well as elements and material classes will be investigated. Furthermore, the effect of removing specific small grain size fractions will be tested and evaluated in future experiments with different streams of commercial and residual waste in order to validate the obtained results.
Acknowledgment Partial funding for this work was provided by: The Center of Competence for Recycling and Recovery of Waste 4.0 (acronym ReWaste4.0) (contract number 860 884) under the scope of the COMET – Competence Centers for Excellent Technologies – financially supported by BMVIT, BMDW, and the federal states of Styria, managed by the FFG.
5. Literature
[1] Adam, J., Curtis, A., and Sarc, R.: Korngrößenspezifische Charakterisierung eines marktüblichen gemischten Gewerbemülls für die EBS Produktion. In Vorträge-Konferenzband zur 14. Recy &
DepoTech-Konferenz, 2018, pp. 781-786.
[2] ADEME (Agence de l‘Environnement et de la Maîtrise de l‘Energie): La composition des ordures ménagères et assimilées en France, 2010.
MBT and SRF
[3] Bayerisches Landesamt für Umweltschutz: Zusammensetzung und Schadstoffgehalt von Sied- lungsabfällen. Abschlussbericht, 2003.
[4] Beker, D. and Cornelissen, A. A. J.: Chemische analyse van huishoudelijk restafval. Resultaten 1994 en 1995, 1999.
[5] Bundesministerium für Land- und Forstwirtschaft, Umwelt und Wasserwirtschaft: Verord- nung über die Verbrennung von Abfällen (Abfallverbrennungsverordnung – AVV), BGBl. II Nr. 476/2010, Wien, 2010.
[6] Burnley, S. J.: The use of chemical composition data in waste management planning – a case study. Waste management (New York, N.Y.) 27, 3, 2007, pp. 327-336.
[7] Hoffmann, G., Schirmer, M., and Bilitewski, B.: Chlorstudie – Untersuchungen zu Hauptchlor- trägern in verschiedenen Abfallströmen, 2006.
[8] Holleman, A. F., Wiberg, E., and Wiberg, N.: Lehrbuch der anorganischen Chemie. Berlin/New York: Walter de Gruyter & Co., 2007, 102. Auflage.
[9] International Stainless Steel Forum: The Stainless Steel Family. 2019. Retrieved on April 7, 2019 from: http://www.worldstainless.org/Files/issf/non-image-files/PDF/TheStainlessSteelFamily.
pdf.
[10] Janz, A.: Schwermetalle aus Elektroaltgeräten und Batterien im kommunalen Restabfall. Po- tenziale, Mobilisierung und Freisetzung während der Deponierung. Dissertation, Technische Universität Dresden. Beiträge zu Abfallwirtschaft, Altlasten 69. Forum für Abfallwirtschaft und Altlasten e.V, Pirna, 2010.
[11] Khodier, K., Viczek, S. A., Curtis, A., Aldrian, A., O’Leary, P., Lehner, M., and Sarc, R.: (submit- ted). Sampling and analysis of coarsely shredded mixed commercial waste; Part I: procedure, particle size and sorting analysis. International Journal of Environmental Science and Technol- ogy [under review], 2019.
[12] Lorber, K. E., Sarc, R., and Aldrian, A.: Design and quality assurance for solid recovered fuel.
Waste Management & Research 30, 4, 2012, pp. 370-380.
[13] Nasrullah, M., Vainikka, P., Hannula, J., and Hurme, M. 2015. Elemental balance of SRF pro- duction process. Solid recovered fuel produced from commercial and industrial waste. Fuel 145, pp. 1-11.
[14] Prochaska, M., Raber, G., and Lorber, K. E.: Herstellung von Ersatzbrennstoffen. Projekt-End- bericht, 2005.
[15] Rugg, M. and Hanna, N. K.: Metals concentrations in compostable and noncompostable compo- nents of municipal solid waste in cape may county, new jersey. Second United States Conference on Municipal Solid Waste Management, 1992, Arlington, Virginia.
[16] Sarc, R.: Herstellung, Qualität und Qualitätssicherung von Ersatzbrennstoffen zur Erreichung der 100%-igen thermischen Substitution in der Zementindustrie. Dissertation, Montanuniver- sität Leoben, 2015.
[17] Schmidt, M.: Rohstoffrisikobewertung - Antimon (raw material risk evaluation - antimony).
DERA Rohstoffinformationen 18, 2013.
[18] Umweltbundesamt (Environment Agency Austria): Personal notification by the Enviroment Agency Austria to the laboratory of the Chair of Waste Processing Technology and Waste Man- agement, Montanuniversität Leoben, 2019.
MBT and SRF
Contact Person
Sandra A. Viczek, M.Sc. M.Sc.
University of Leoben Scientific staff, PhD student
Chair of Waste Processing Technology and Waste Management Franz-Josef-Straße 18
8700 Leoben AUSTRIA
+43 3842 402-5136
sandra.viczek@unileoben.ac.at
Download Free Articles
on www.vivis.de
waste incineration
photovoltaic
flue gas treatment
balancing and evaluation
bio waste
biogas
biomass
soil steam generator
dismantling
waste incineration
dismantlingwaste incineration
landfill
emission trading
pyrolysis
solid recovered fuels
logistics
district heating, district cooling, process steam
odour
sewage sludge
corrosion and materials
mechanical-biological treatment
mechanical treatment
mineral by-products and wastes
co-incineration
electricity grids
physical- chemical treatment
planning
legislation
recycling
electricity grids
recycling
electricity grids residues
solar thermal energy
recycling
solar thermal energy
recycling energy storage
photovoltaic
energy storage
photovoltaic
drying
turbine and generator underground storage and backfilling of mines
waste generation
fan and stack
gasification
wind power
profitability
About two thousand technical papers have been published so far from us.Tey will give you a good overview of technical, economic, legal and political developments. Many of these posts you can download without registration.
HOW DO I FIND RELEVANT ARTICLES?
Alternative 1: Search by topic
If you are looking for articles regarding a specific topic, please go to Fachaufsätze (i.e. technicalarticles, in the top right corner of our homepage). On the right side you will find the topics. Just click on your topic of interest, and you will find the available relevant articles with their bibliographical data. In order to open and download the article, click on the blue link.
If you like to open in in a different tab, rightclick the site and choose „open in different tab“.
Alternative 2: Search by conference
If you are looking for articles regarding a specific conference/congress or book, please go to Fachbücher (i.e. textbooks, in the top right corner of our homepage). Here you find a list of the themes, which are covered by our publications. Choose your field of interest. You will then see all relevant books. The latest publications are recapped under the categorie Neuerscheinungen (i.e. new releases). Once you find the right book, follow the link mehr . In order to open and download an article published in the book, click on the articles title.
If you are interested in several articles of the same book, you should consider buying. Available books can be ordered via Buchbestellung (ie. book orders).
Dorfstraße 51
D-16816 Nietwerder-Neuruppin
TK Verlag GmbH
Bibliografische Information der Deutschen Nationalbibliothek Die Deutsche Nationalbibliothek verzeichnet diese Publikation in der Deutschen Nationalbibliografie; detaillierte bibliografische Daten sind im Internet über http://dnb.dnb.de abrufbar
Thiel, S.; Thomé-Kozmiensky, E.; Winter, F.; Juchelková, D. (Eds.):
Waste Management, Volume 9 – Waste-to-Energy –
ISBN 978-3-944310-48-0 Thomé-Kozmiensky Verlag GmbH
Copyright: Elisabeth Thomé-Kozmiensky, M.Sc., Dr.-Ing. Stephanie Thiel All rights reserved
Publisher: Thomé-Kozmiensky Verlag GmbH • Neuruppin 2019 Editorial office: Dr.-Ing. Stephanie Thiel, Elisabeth Thomé-Kozmiensky, M.Sc.
Layout: Claudia Naumann-Deppe, Janin Burbott-Seidel, Sarah Pietsch, Ginette Teske, Roland Richter, Cordula Müller, Gabi Spiegel Printing: Universal Medien GmbH, Munich
This work is protected by copyright. The rights founded by this, particularly those of translation, reprinting, lecturing, extraction of illustrations and tables, broadcasting, micro- filming or reproduction by other means and storing in a retrieval system, remain reserved, even for exploitation only of excerpts. Reproduction of this work or of part of this work, also in individual cases, is only permissible within the limits of the legal provisions of the copyright law of the Federal Republic of Germany from 9 September 1965 in the currently valid revision. There is a fundamental duty to pay for this. Infringements are subject to the penal provisions of the copyright law.
The repeating of commonly used names, trade names, goods descriptions etc. in this work does not permit, even without specific mention, the assumption that such names are to be considered free under the terms of the law concerning goods descriptions and trade mark protection and can thus be used by anyone.
Should reference be made in this work, directly or indirectly, to laws, regulations or guide- lines, e.g. DIN, VDI, VDE, VGB, or these are quoted from, then the publisher cannot ac- cept any guarantee for correctness, completeness or currency. It is recommended to refer to the complete regulations or guidelines in their currently valid versions if required for ones own work.