Hortlnfo - a web-based information system for horticultural production
MANFRED ROHRIG, FOULUM, DENMARK ALLAN LECK JENSEN, FOULUM, DENMARK GISELA FELKL, FLAKKEBJERG, DENMARK GITTE KJELDSEN BJORN, ARSLEV, DENMARK
Abstract
A lot o f information exists to optimise the use o f resources in high-input crops such as fruits and vegetables. This information, however, is distributed among a large number o f sources making it difficult fo r growers and advisors to constantly renew their knowledge. Therefore a project was initiated in 1999 to develop an Internet-based information and decision support system fo r integrated horticultural production (Hortlnfo). Its central aspect is to establish a communication platform that is both easy to access and update. Presently, the system contains information about strawberry, carrot and cauliflower including cultivation guides, data on variety qualities and fungicides as well as a picture database on pests and diseases.
Incorporating models running on spatially resolved weather data makes the system not only a general information library but also a dynamic management tool fo r horticultural production.
1 Introduction
Fruits and vegetables are high-value crops where product quality is decisive for the economic yield to a higher degree than yield level. The concept o f Integrated Production (IP) was introduced to optimise the use o f existing knowledge in order to reduce fertiliser and pesticide input. A vast body o f information is available on cultivation techniques, plant protection and variety characteristics. While the number o f approved pesticides is decreasing, it is vital to take advantage o f resistant varieties and to identify pests and diseases as well as to know their biology.
Knowledge transfer in agricultural and horticultural production is still mainly ‘paper-based’ and the information is published by a large number o f sources. To review all is beyond the possibilities of a grower or an advisor. Whereas variety information may be relatively easy to obtain, the knowledge integrated in mathematical models is inaccessible. To remedy these shortcomings, the Hortlnfo project was initiated in 1999 (Henriksen et al., 2000), to centrally collect and prepare relevant information and disseminate it through the Internet. The web- based approach also makes it possible to present the results o f prognosis models o f crop diseases and pests. These models typically require weather data as input, which in contrast to PC-based solutions do not have to be collected by the user but can also be provided centrally.
In the first round, data are presented for strawberry, carrot and cauliflower.
Pl@nteInfo (www.planteinfo.dk) is a Danish web-based information and decision support system (Jensen et al., 2000; Thysen et al., 2000), where most o f the information is generated dynamically. Due to a close collaboration with the Danish Meteorological Institute (DMI) it is possible to provide timely and spatially highly resolved weather data, making Pl@nteInfo an ideal platform for the Hortlnfo project.
This paper presents the variety database for cauliflower and a temperature-sum model to predict the time of harvest for carrot. It demonstrates how information is collected and processed for web output. Extensions and possible future developments are also discussed.
2 Materials and methods
Most of the web pages in the Hortlnfo project are created dynamically; i.e. the page is the output of a so-called presentation programme. When a page is requested, its corresponding
presentation programme on the web server is activated with a number of parameters. The parameters may define the type of requested information, a variety name etc. Depending on these parameters the programme extracts data from a database, processes it and produces a temporary file in HTML code. When the file is complete it is sent to the user, where the HTML code is interpreted by the browser and displayed on the screen.
The presentation programme and the databases are stored on the server. In addition, administration programmes are provided to update and maintain these databases through the Internet. New information coming in is first uploaded to the server. A corresponding administration programme validates the new data and updates the database to secure its integrity. Finally, an HTML output is sent to the uploading user with the results o f the update.
The software package SAS (SAS/IntrNet, 1998) is used for data storage, administration and presentation programmes, real-time generation o f graphics and Internet communication between user and server.
Variety database
Data from all cauliflower variety trials in Denmark are collected and analysed by horticultural researchers. The results o f this analysis are entered into a Microsoft Excel spreadsheet, which is uploaded through an administration programme to the server. The use of Excel spreadsheets was chosen for the ease of use, in particular for horticultural experts with limited experience with IT. The administration programme confirms the upload and converts the data from spreadsheet into SAS format. After a successful upload, the researcher can directly call the presentation programme, which is now using the updated information.
‘Critical harvest m odel'
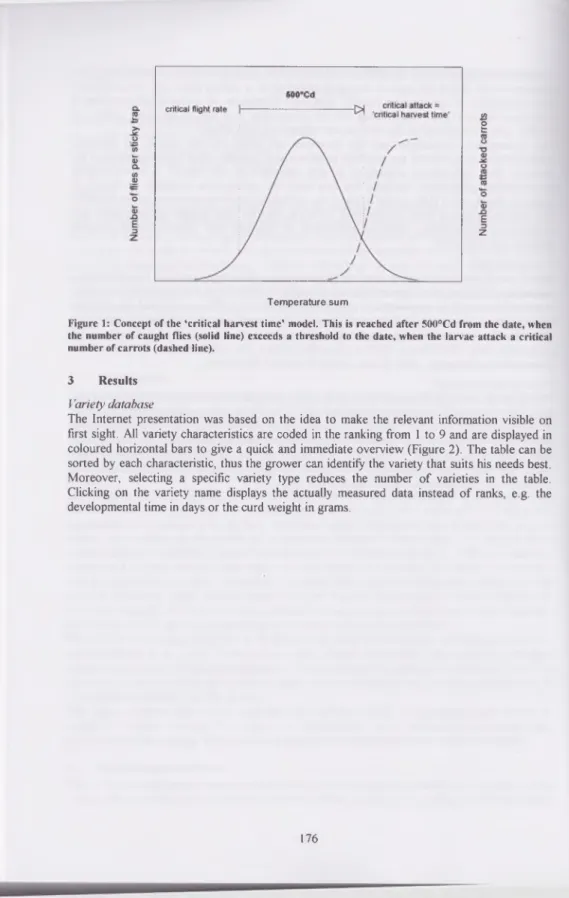
The larvae of carrot fly can cause large yield losses in carrot. In general, the carrot fly has two generations during growing season. Damages caused by the second generation can be avoided, if the carrots are harvested before the larvae reach the third stadium. A Swedish study (Jonsson, 1992) showed that it takes a constant temperature sum from the date, when yellow sticky trap catches exceed a threshold to the date, when the larvae begin to attack the main roots. To evade these losses, the carrots should be harvested once this temperature sum is reached, which is called the ‘critical harvest time’ (Figure 1).
175
&
Ë
E
3z
Temperature sum
Figure 1: Concept of the 'critical harvest time’ model. This is reached after 500°Cd from the date, when the number of caught flies (solid line) exceeds a threshold to the date, when the larvae attack a critical number of carrots (dashed line).
3 Results Variety database
The Internet presentation was based on the idea to make the relevant information visible on first sight. All variety characteristics are coded in the ranking from 1 to 9 and are displayed in coloured horizontal bars to give a quick and immediate overview (Figure 2). The table can be sorted by each characteristic, thus the grower can identify the variety that suits his needs best.
Moreover, selecting a specific variety type reduces the number o f varieties in the table.
Clicking on the variety name displays the actually measured data instead o f ranks, e.g. the developmental time in days or the curd weight in grams.
Figure 2: Sample screen dump from the variety database for strawberry. In this view, all varieties are being shown, sorted after the variety name.
‘Critical harvest model ’
The Internet implementation o f the model first requires the input of the name and location o f a carrot field. From the weather database, which contains information in a 10 x 10 km grid, temperature data are extracted for the grid point closest to the given field. In the next step the grower enters the date when the catch threshold was reached. The program then calculates the temperature sum from the threshold date to the present date and prints it to the screen. If the
‘critical harvest time’ is not yet reached, the expected period is estimated from long-term average temperature values. Evidently, the output of the model strongly depends on the threshold date. As carrot fly activity varies temporarily and spatially, it may in some cases be helpful to look at the catch results o f the whole trapping period. A facility has therefore been implemented to enter these results and to show them graphically. After looking at the graph the experienced grower or advisor should be in the position to select an appropriate threshold date. Moreover, it is possible to examine different threshold dates and to evaluate the effects on the temperature sum and the critical harvest time.
4 Discussion
Although the development o f the administration and presentation programmes requires some effort, the further maintenance o f the programmes is limited. Relevant horticultural information is refreshed by experts at the time new results are coming in. The use of the Internet therefore considerably shortens the time between the assessment of data and the public availability to growers and advisors
Database maintenance based on simple spreadsheets requires little additional work because spreadsheet programmes are frequently used for the analysis o f experimental data. The update o f weather data to be used in the models is fully automated.
For the time being, no in-depth analysis has been made on the user acceptance o f the Hortlnfo web pages. This is due to the relatively short time these pages have been online. But a first
177
feedback from growers, advisors and agro-business companies to the contents and the way of presentation was positive and encouraging.
Though not explicitly planned for the Hortlnfo project, other ways o f information dissemination are currently under test in the Pl@nteInfo system. Some pages are reprogrammed to comply with the WAP standard or the Nokia Communicator format Furthermore, potato late blight warning messages are currently being sent out every morning to potato growers using SMS technology. A subsequent development o f these facilities evidently depends on the user request and utilisation. But it could be shown here that if the respective programmes have been established, they could also be adapted without much effort to the need of horticultural producers.
5 Acknowledgements
Financial support from the Danish Ministry o f Food, Agriculture and Fisheries, the Danish Agricultural Advisory Centre (DAAC) and the Danish Institute of Agricultural Sciences (DIAS) is gratefully acknowledged.
6 Project participants
The project is carried out by Karen E. Henriksen [project responsible], Gisela Felkl, Ole Qvist Bojer (DIAS Flakkebjerg), Gitte K. Bjom, Douglas McCall (DIAS Arslev), Allan Leek Jensen, Manfred Rohrig (DIAS Foulum), Kirsten Friis, Jens Bligaard, Lars Petersen (DAAC Skejby) and Bodil D. Petersen (Fruit and Vegetable Advisory Service Skaelskor).
7 References
HENRIKSEN, K.E.; FELKL, G.; BOJER, O.Q. (2000): Frugt og gronsager pa internettet. 17. Danske Plantevaernskonference 2000. DJF-rapport nr. 25, 39-40.
.IENSEN, A.L.; BOLL, P.S.; THYSEN, I.; PATHAK, B.K. (2000): Pl@nteInfo - a web-based system for personalised decision support in crop management. Computers and Electronics in Agriculture. 25, 271-293.
JONSSON, B. (1992): Forecasting the timing o f damage by the carrot fly. IOBC/WPRS Bulletin.
15, 43-48.
SAS/lNTRNET (1998): SAS/IntrNet software: Delivering web solutions. SAS Institute Inc., Cary NC.
THYSEN, I.; JENSEN, A.L.; ROHRIG, M. (2000): Pl@nteInfo - status og fremtid. 17. Danske Plantevaernskonference 2000. DJF-rapport nr. 24, 101-111.