TEACHERS’ SALARIES IN LATIN AMERICA. HOW MUCH ARE THEY (UNDER OR OVER) PAID?
ALEJANDRA MIZALA - HUGO ÑOPO
DOCUMENTOS DE TRABAJO Serie Economía
Nº 282
1
Teachers’ Salaries in Latin America. How Much are They (under or over) Paid?
Alejandra Mizala and Hugo Ñopo*
Abstract
This paper documents the extent to which teachers are underpaid vis-à-vis workers in other professional and technical occupations in Latin America circa 2007. These labor earnings differences, attributed to observable socio-demographic and job characteristics, are assessed using a matching methodology (Ñopo, 2008). Teachers’ underpayment is found to be stronger than what has been previously reported in the literature, especially among pre-school and primary teachers. Nonetheless, behind the region averages there is an important cross-country heterogeneity.
Teachers’ underpayment is more pronounced among males, older workers, household heads, part-timers, formal workers, those who work in the private sector, and (mostly) among those with complete tertiary education. Two amenities of the teaching profession, namely the longer job tenure and the flexible job schedules within the year, are also explored. Even after accounting for the possible compensating differentials of these two amenities, teachers’ underpayment vis-à-vis that of other professional and technicians prevail.
JEL codes:
J31 - Wage Differentials
J44 - Professional Labor Markets;
J8 - Labor Standards: National and International O54 - Latin America; Caribbean
* Mizala: Centro de Economía Aplicada, Ingeniería Industrial, Universidad de Chile. República 701 Santiago, Chile. Ñopo:
Inter-American Development Bank. Colombia Country Office. Carrera 7ma 71-21, Torre B, piso 19. Bogotá, Colombia.
Felipe Balcazar provided very valuable research assistance. Any mistake within the paper is our own and the findings herein do not necessarily represent the views of the Inter-American Development Bank or its Board of Directors. Mizala thanks financial support from PIA-CONICYT Project CIE-05 and Fondecyt project 1100308.
2 1. Introduction
Research shows that teacher’s performance is a critical factor to explain students’ academic success in the school system (Goldhaber and Brewer 1997; Rivkin et al 2005; Darling-Hammond 2001; Rocoff 2004, OECD 2009; Barber and Mourshed 2007; Clotfelter et. al. 2007; Kukla-Acevedo 2009). Also, the effectiveness of educational policies and the effect of other inputs depend on the quality of the daily work of teachers. Therefore, to improve the quality of education it is essential to pay special attention to teachers and to implement policies to attract, motivate and retain the most talented individuals in the profession.
In this context, the analysis of teachers’ salaries is relevant since in many countries, and Latin America is no exception, they are often perceived to be lower than those of other professionals. If this is the case, low incomes would discourage the best students to choose education major in College, with negative effects on the pool of future teachers. These low incomes would damage their motivation to teach (OECD 2009; Figlio and Kenny 2006; Ortega 2010, Player 2009, Heutel 2009, Loeb and Page, 2000) and cause good teachers to leave the profession (Imazeki 2005; Harris and Adams, 2007; Scafidi et al 2007). These effects would produce inefficiencies in the educational process and negative effects in students’ learning. This concern over teacher quality and motivation has generated renewed interest in both the sufficiency of teacher pay to recruit and retain high quality instructors, and the efficacy of the salary structure (including incentives) to motivate teachers’ performance.
A series of studies have analyzed the issue of teachers’ salaries in Latin America examining whether they are under or over-paid.1 Most of them use National Household Surveys to estimate Mincer wage equations with different control variables, and some studies use the Blinder-Oaxaca wage gap decomposition. The results are mixed, indicating that there is no robust empirical evidence showing that teachers receive lower/higher salaries than a comparative group of workers.
Psacharopoulos et al. (1996) use data for 12 Latin American countries to compare average wages without finding a clear pattern; in some countries teachers’ pay is higher than the comparative group and vice versa. Liang (1999) finds that in 11 out of 12 countries analyzed, hourly wages for teachers are actually higher than their counterparts’ in the labor force with similar observable characteristics. Hernani-Limarino (2005) examines the robustness of conditional wage differentials to the methods used and the definition of the comparable group for 17 Latin American countries.
He concludes that in some countries (i.e. Chile) teachers earn more than the comparable workers;
in others they receive lower salaries (i.e. Nicaragua), while in others the answer depends on the control group and the method used to estimate the wage gap. He also estimates conditional wage
1 There are also several studies addressing this issue for non-Latin American countries, for instance, Taylor (2008), Allegretto et al (2008), Podgursky and Tongrut (2006), Harris and Adams (2005), Stoddard (2005) for United States, Asadullah (2006) for Bangladesh; Komenan and Grootaert (1990) for Cote D’ Ivoire; Zymelman and DeStephano (1989) for Sub-Saharan African countries.
3 differentials for different quantiles of the conditional wage distribution, concluding that teachers are over or under-paid depending on their position in such conditional distribution.
In terms of country studies, Saavedra (2004) finds for Perú that earnings comparisons between teachers and other occupations depend on the geographic zone, in Lima teachers earn less than comparable workers, while in the rest of the country they enjoy a wage premium. Mizala and Romaguera (2005) find for Chile that, once differences in observed characteristics are accounted for, teachers’ salaries are similar to those they would receive in other occupations; however, they find relevant differences between men and women, female teachers earn more than their counterparts, while male teachers earn less than similar workers in other sector of the labor market. In Bolivia, Mexico and Guatemala, teachers enjoy a wage premium, explained by the fact that they are public workers, i.e., teachers working in the public sector earn higher salaries than comparable private sector teachers and similar workers in other occupations (Piras and Savedoff 1998; Lopez-Acevedo 2004; Rivas and Lavarreda 2008). Furthermore, Herreros et al. (2003) for Argentina and Urquiola et al. (2000) for Bolivia show that whether teachers are well paid depends on the comparison group, even when differences in observable characteristics are accounted for.
Conditional wage differentials are favorable to teachers when compared with all workers;
nevertheless, the differentials are not favorable to teachers when compared with workers who had completed at least secondary education.
In sum, the available empirical evidence shows that the sign and the magnitude of the conditional wage differential between teachers and other workers crucially depends on the definition of the comparison group. Moreover, there is some evidence of intra-country heterogeneity, for instance, regarding gender and geography.
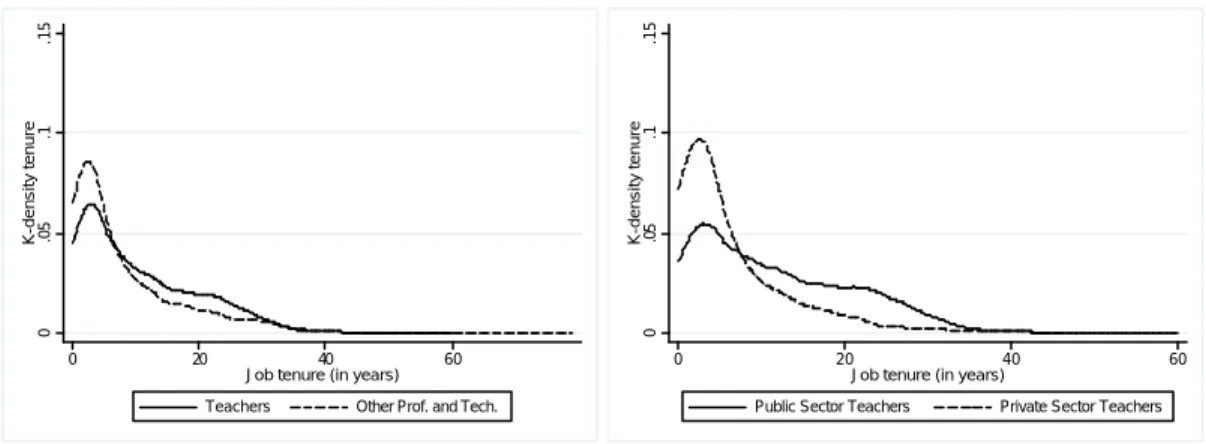
The aim of this paper is to revisit the question of conditional labor earnings differentials between teachers and other professionals and technicians in Latin America, but with a renewed methodological approach. The extent to which earnings differentials can be attributed to differences in observable socio-demographic and job characteristics will be assessed with the non- parametric matching methodology developed in Ñopo (2008). This is an extension of the Blinder- Oaxaca (BO) decomposition for which teachers and non-teachers are matched when showing exactly the same combination of observable characteristics. The method does not require any estimation of earnings equations and, by construction, it allows a more precise salaries comparison for teachers and their counterparts than what the literature has been able to do so far. Furthermore, this approach allows us to obtain not only more precise estimates of the average wage gap between teachers and non-teachers, but also a comprehensive exploration of its distribution. Additionally we explore two amenities that may explain, to a certain exte nt, lower teachers’ earnings in the form of compensating differentials: job tenure and job schedules. While the former is claimed to be longer among teachers, especially in the public sector; the latter are claimed to be more flexible among teachers (that is, more vacation weeks per year) .
4 The results obtained depict a picture in which the extent to which teachers are underpaid is stronger than what has been previously reported in the literature, especially for pre -school and elementary teachers. Nonetheless, behind the region averages there is an important cross-country heterogeneity. Teachers’ underpayment is more pronounced among males, older workers, household heads, part-timers, informal workers, those who work in the private sector, and among those with complete tertiary education. These results are also found after adjusting earnings by job-break periods, although the earnings gap in this case is smaller, and if rather than hourly, monthly and yearly earnings are used. That is, the amenity of part-time schedules, larger vacations periods and more job stability (that in many circumstances could be used as a way of managing the family-work trade-off) are compensating lower earnings.
The rest of the paper proceeds as follows. In the next section we discuss the data sources, our approach to harmonize them across countries and some descriptive statistics comparing teachers with other workers. In section three we present the empirical analysis of the extent to which pay differentials can be attributed to differences in observable characteristics, followed by a an analysis on job tenure, addressing the differences between workers in the public and private sector, and the role of job schedules on earnings gaps. In the fourth and final section we summarize the conclusions.
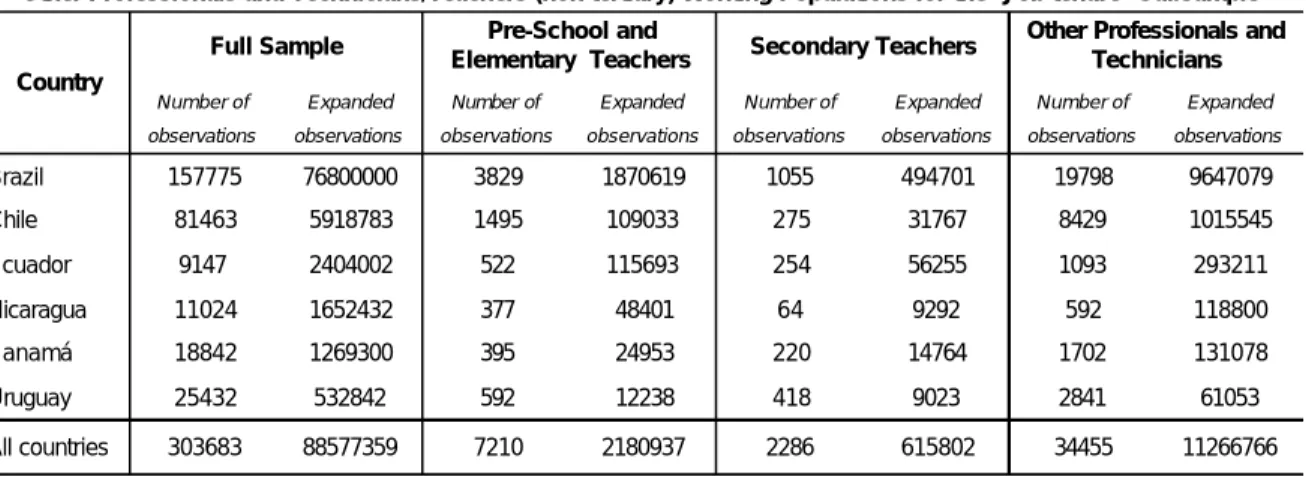
2. The Data
The data sources are household and labor surveys, with national or urban representativeness.
Table 1 reports the specifics of each data source, including the particular survey name, the year and the number of observations, both for the whole data set of the working sample and for the school teachers, office workers, and (other) professionals and technicians populations within the sample (that is, those who will be part of the analysis in subsequent sections). The data will be used considering the expansion factors such that the relative size of each sample proportionally corresponds to the size of each country. Outliers for income in the main occupation were dropped from the data set. This comprised 0.25% of school teachers, 0.25% of office workers and 1.08% of the other professionals and technicians within the working sample.
5 Table 1
Data Sources
Number of Expanded Number of Expanded Number of Expanded Number of Expanded Number of Expanded observations observations observations observations observations observations observations observations observations observations
Brazil Pesquisa Nacional por Amostra de Domicilio (PNAD) 2008 National 157775 76800000 3829 1870619 1055 494701 16070 7787565 19798 9647079
Chile Encuesta de Caracterizacion Socioeconomica Nacional (CASEN) 2009 National 82905 6021479 1521 111737 278 31928 4812 480221 8568 1027836
Ecuador Encuesta de Empleo, Desempleo y Subempleo (ENEMDU) 2006 National 9147 2404002 522 115693 254 56255 901 246601 1093 293211
El Salvador Encuesta de Hogares de Propositos Multiples (EHPM) 2009 National 24299 1961864 518 41415 54 4758 1055 102038 1788 203243
Honduras Encuesta Permanente de Hogares de Propositos Multiples (EPHPM) 2007 National 26203 1910929 688 50867 205 14618 897 59120 2807 188640
Mexico Encuesta Nacional de Ingresos y Gastos de los Hogares (ENIGH) 2008 National 44373 39900000 35 26909 71 50962 5298 4664039 3323 3015056
Nicaragua Encuesta Nacional de Hogares sobre medicion de Niveles de Vida (EMNV) 2005 National 11024 1652432 377 48401 64 9292 258 52396 592 118800
Panamá Encuesta de Hogares (EH) 2007 National 18843 1269338 395 24953 220 14764 1801 141066 1702 131078
Uruguay Encuesta Continua de Hogares (ECH) 2007 Urban 25432 532842 592 12238 418 9023 3343 72151 2841 61053
400001 132452886 8477 2302832 2619 686301 34435 13605197 42512 14685996
All countries
Country Full Set
Office Workers/Other Proessionals and Technicians/Teachers (non tertiary) Working Populations*
Year Coverage Name Of The Survey
Office Workers Other Professionals and Technicians Pre-School and
Elementary Teachers Secondary Teachers
* Working populations in each country are identified as those earning a salary in the main occupation.
6 From now on we restrict our attention to the school teachers, office workers and other professionals and technicians within the data sources, which represents 23.6% of the total number of workers. From those occupational categories we compare those who declare themselves as being teachers with the rest of workers within those categories (the former group represents 2.2%
and the latter 21.4% of workers). The occupational categories used in each country for teachers (devoted to the pre-school, primary and secondary education) and non-teachers, are shown in Table 2. University teachers and those with particular specialties (e.g. teachers for students with special needs, language instructors, sports instructors, driving instructors, and dance or art instructors) are not considered for the analysis. They are neither part of the teachers nor the non- teachers group within this paper. Then, when we refer here to teachers or school teachers, we will be referring to the same group: pre-school and elementary teachers, and secondary teachers.
Table 2
Occupational Codes Included in the Definition of Teachers and Comparison Groups
CIUO codes for teachers* 232 Profesores de la enseñanza secundaria
233 Maestros de nivel superior de la enseñanza primaria y preescolar 331 Maestros de nivel medio de la enseñanza primaria
332 Maestros de nivel medio de la enseñanza preescolar Brazil 2311 Professores de nível superior na educação infantil
2312 Professores de nível superior do ensino fundamental (primeira à quarta série) 2313 Professores de nível superior no ensino fundamental de quinta à oitava série 2321 Professores do ensino médio
2331 Professores do ensino profissional 2332 Instrutores de ensino profissional
3311 Professores de nível médio na educação infantil 3312 Professores de nível médio no ensino fundamental 3313 Professores de nível médio no ensino profissionalizante 3321 Professores leigos no ensino fundamental
Mexico 1310 Profesores de Preparatorias y equivalentes
1320 Profesores de Enseñanza Secundaria 1330 Profesores de Enseñanza Primaria 1340 Profesores de Enseñanza Preescolar
Panamá 266-278 Profesores de universidades y otros establecimientos de la enseñanza superior 279-290 Profesores de la enseñanza secundaria
291-293 Profesores y maestros de enseñanza primaria 294-297 Profesores y maestros de enseñanza preescolar
Group 2 Profesionales Científicos e Intelectuales Group 3 Técnicos y profesionales de nivel medio
Empleados de Oficina Group 4
CIUO codes for office workers (all countries)
Country Code Description
CIUO Codes for other
professionals and technicians (all countries)
* Used in Chile, Ecuador, El Salvador, Honduras, Nicaragua and Uruguay.
7 Table 3 shows the descriptive statistics for observable characteristics in all countries’ data sets and allow us to profile the population groups considered. Data suggests that the panorama of the teaching profession is such that teaching is predominantly a female occupation (approximately eight out of ten teachers are women) as opposed to the other professional and technical occupations (where more than half are men). Office workers tend to be substantially younger than teachers while the other professionals and technicians show an age-distribution that is similar to that of teachers. Among teachers, those in elementary and primary levels are slightly younger than those in secondary. Teachers, especially secondary teachers, are more educated than other professionals and technicians which in turn are more educated than office workers.
Teachers tend to live in households where there is more presence of kids (12 years old or younger), elders (65 years or older) and also presence of another wage earner, not being in most of the cases household heads. This gives credence to the idea that the choice of becoming a teacher is linked to a choice regarding a lifestyle where having a family and raising kids has special importance. A characteristic for which there are important differences between teachers and non- teachers is on job schedule. While nine out of ten non-teachers declare working full time, it is 44.65% of teachers who declare working part-time (30 hours or less per week). Teachers declare working in more formal conditions than their non-teaching peers, at least regarding access to social security (which is the proxy-measure for formality adopted here). Teachers are over represented in the public sector: 75.7% of teachers work in the public sector while only 21.6% of office workers and 26.2% of other professionals and technicians declare working in such sector.
8 Table 3
Descriptive Statistics
Office Workers Other Professionals and Technicians
Other Professionals and Technicians or Office
Workers
Pre-School and
Elementary Teachers Secondary Teachers All School Teachers
(1) (2) (3)=(1 & 2) (4) (5) (6)=(4 &5)
Personal Characteristics
Age Groups
24 and under 29.7% 15.2% 22.2% 10.5% 7.9% 9.9%
25 to 34 31.2% 32.4% 31.8% 32.0% 29.7% 31.5%
35 to 44 20.9% 25.3% 23.2% 30.9% 28.2% 30.3%
45 to 54 13.2% 17.9% 15.6% 19.9% 24.9% 21.1%
54 and over 5.0% 9.1% 7.1% 6.7% 9.3% 7.3%
Education Level
None or primary incomplete 5.0% 3.9% 4.4% 0.3% 0.0% 0.2%
Primary complete or secondary incomplete 20.6% 9.9% 15.0% 3.2% 1.3% 2.8%
Secondary complete or tertiary incomplete 68.4% 69.7% 69.1% 88.6% 75.2% 85.5%
Tertiary complete 5.9% 16.6% 11.5% 7.9% 23.5% 11.5%
Labor Characteristics
By Country
Brazil 57.2% 65.7% 61.6% 81.2% 72.1% 79.1%
Chile 3.5% 7.0% 5.3% 4.9% 4.7% 4.8%
Ecuador 1.8% 2.0% 1.9% 5.0% 8.2% 5.8%
El Salvador 0.4% 1.3% 0.9% 2.2% 2.1% 1.5%
Honduras 34.3% 20.5% 27.1% 1.2% 7.4% 2.2%
Mexico 0.4% 0.8% 0.6% 2.1% 1.4% 2.6%
Nicaragua 1.0% 0.9% 1.0% 1.1% 2.2% 1.9%
Panamá 0.7% 1.4% 1.1% 1.8% 0.7% 1.3%
Uruguay 0.5% 0.4% 0.5% 0.5% 1.3% 1.5%
87.1%
43.3% 38.9% 41.0% 47.4% 38.4% 45.4%
12.6% 13.2% 14.2%
32.7%
78.4%
40.2%
46.6%
74.4%
65.8%
17.5%
6.7% 45.7%
76.3%
44.6%
41.2%
78.8%
72.7%
13.4% 10.2%
67.5%
77.2%
41.0%
34.3%
86.3%
14.3%
30.4%
Formality (has social security)
43.8% 55.3% 49.8% 12.4%
12.9% 14.2%
Men (Gender)
Presence of Children (=12 years) in the Household Presence of Elder (=65 years) in the Household Head of the Household
Presence of Other Household Member with Labor Income
Part time workers (=30 hours)
35.3%
87.4%
69.4%
70.4% 75.7%
Works in the public sector 21.6% 26.2% 24.2% 77.2%
Source: Authors’ compilations.
9 Next, Table 4 shows descriptive statistics regarding relative earnings of the comparison groups with respect to teachers. Earnings are computed as hourly earnings, measured in terms of purchasing power parity (PPP, US$, 2000). Hourly earnings for each individual are computed dividing the monthly income by the number of hours worked in a week and multiplied by 4.2 which is the average number of weeks in a month. Both, the monthly income and the number of hours worked per week are considered only for the main occupation so there is no bunching of multiple occupations in the computation of hourly earnings.2 Average school teachers’ hourly earnings have been set equal to 100 for each country.
Table 4 shows that, on average, teachers earn slightly more than the combined group of other professionals and technicians and office workers. When disaggregating the comparison group, however, it can be seen that teachers earn less than other professionals and technicians but almost 40% more than office workers. When disaggregating the group of teachers it can be seen that secondary teachers earn more than their pre -school counterparts, but neither earn more than other professionals and technicians.
Males earn more than females in all groups under analysis. People that live with kids, live with elder people, are not household heads, live with other wage earner, work in the informal job market, and work in the public sector earn less than those who don’t (although the latter is not true for secondary teachers). Individuals’ earnings show a life cycle pattern, but this is less pronounced among teachers. Additionally, more educated professionals earn more than their less educated peers. However, this income premium decreases with tertiary educational attainment, especially among secondary teachers.
With the exception of Nicaragua, on average, office workers earn less than teachers. On the other hand, with the exception of Honduras, Mexico and El Salvador, other professionals and technicians who are not devoted to the teaching profession earn more than teachers. In most countries under analysis, El Salvador being the only exception, pre-school and elementary teachers earn less than secondary teachers. All in all, the hourly earnings gap is more pronounced in Nicaragua where other professionals and technicians earn around 89% more than teachers. However, Nicaragua’s working population is small within the sample, so this won’t lead to overestimate the earnings gap later on. At the other extreme is Mexico where teachers earn almost 22% more than other professionals and technicians.
2The monthly income corresponds to the monthly earnings received from the main occupation in the month previous to the survey. The job schedule is captured with survey questions of the type: “¿Quantas horas trabalhava normalmente por semana nesse trabalho? ¿Cuántas horas trabaja efectivamente en su empleo o actividad principal? Señale horas semanales, ¿cuántas horas efectivas al día trabajó la semana pasada? ¿Cuántas horas trabajó la semana pasada en la ocupación principal? El mes pasado, ¿cuántas horas a la semana trabajó en este negocio o empresa? ¿Cuántas horas por semana trabaja regularmente como...?; ¿Cuántas horas, días y en qué jornada trabajo efecti vamente la semana anterior?”. So, it can be inferred that teachers are referring not only to their effective class time but to their whole job schedule (including preparation, grading, meeting times and the like).
10 Table 4
Relative Hourly Earnings
Office Workers Other Professionals and Technicians
Other Professionals and Technicians or Office
Workers
Pre-School and Elementary
Teachers Secondary Teachers All School Teachers
(1) (2) (3)=(1 & 2) (4) (5) (6)=(4 &5)
Average Hourly Earninngs 60.25 131.30 97.13 91.16 129.65 100.00
Personal Characteristics Men
No 55.86 112.96 82.24 90.33 123.90 96.47
Yes 65.88 146.13 112.15 97.03 140.67 116.71
Age Groups
24 and under 40.07 62.97 48.23 58.87 83.32 63.35
25 to 34 55.92 113.03 86.09 79.90 117.54 88.05
35 to 44 70.60 138.47 109.07 96.63 126.92 103.10
45 to 54 88.11 173.21 138.78 106.53 150.64 118.51
54 and over 90.33 208.18 168.27 124.76 159.61 135.01
Education Level
None or primary incomplete 44.13 57.16 50.04 41.98 32.73 41.90
Primary complete or secondary incomplete 43.87 66.85 51.68 69.80 99.22 72.88
Secondary complete or tertiary incomplete 63.07 131.93 99.12 89.73 125.58 96.96
Tertiary complete 98.41 184.05 162.83 117.77 144.31 130.27
Presence of Children (<12 years) in the Household
No 62.49 138.24 103.21 94.98 135.72 105.53
Yes 57.32 120.42 88.41 86.94 119.92 93.35
Presence of Elders (>65 years) in the Household
No 60.50 132.23 97.61 91.25 130.09 100.16
Yes 58.51 125.20 93.92 90.64 127.04 99.03
Head of Household
No 52.29 105.00 77.11 87.73 118.62 94.03
Yes 74.86 161.39 125.75 99.00 146.06 112.29
Presence of Other Household Member with Labor Income
No 67.60 149.42 112.93 94.12 138.09 104.77
Yes 57.97 124.50 91.71 90.37 127.16 98.69
Labor Characteristics Part time
No 59.57 121.49 90.57 85.29 114.25 92.38
Yes 69.74 194.93 155.17 98.14 151.83 109.47
Formality
No 49.23 99.80 76.85 61.45 102.57 71.46
Yes 65.12 147.65 106.89 95.46 133.93 104.22
Work in the Public Sector*
No 52.52 138.15 99.63 76.48 146.02 94.98
Yes 87.84 164.74 134.87 95.42 125.95 101.61
By Country
Brazil 59.33 150.42 109.73 90.31 136.65 100.00
Chile 65.57 127.45 107.74 93.98 121.07 100.00
Ecuador 58.41 106.53 84.54 90.91 118.69 100.00
El Salvador 52.82 95.17 81.02 101.27 88.97 100.00
Honduras 48.56 79.77 72.33 99.51 101.69 100.00
Mexico 60.37 78.37 67.44 96.38 101.91 100.00
Nicaragua 118.38 189.44 167.69 96.34 119.04 100.00
Panamá 73.10 109.51 90.64 91.57 114.24 100.00
Uruguay 75.10 121.81 96.51 96.91 104.19 100.00
Relative Hourly Earnings (Base: Average School Teacher Earnings in each Country=100)
Source: Authors’ compilations.
11 The descriptive statistics depict a picture in which office workers are clearly different not only than other professionals and technicians but also, and more importantly, than school teachers. In other pieces of the literature office workers have been part of the analysis, but here, based on the exploration of descriptive statistics outlined above, we restrict the comparison group to that of other professional and technicians. In the next section we compute and decompose earnings gaps between teachers (preschool and primary, and secondary) and other professionals and technicians.
3. Results
3.1 The teaching profession vis-à-vis that of other professionals and technicians
Table 4 shows that, on average, other professionals and technicians earn 31.3% more than teachers. However, as shown in the previous section teachers and other professionals and technicians are strikingly differentiated regarding their socio-demographic composition. Therefore is appropriate to think that these differences in observable characteristics play a role explaining the earnings differentials. Hence, controlling the earnings gap by observable characteristics must provide a better estimation of the underlying earnings gap than only considering the “original earnings gap” (the gap without controlling for anything, the 31.3%).
The extent to which the earnings differential can be attributed to differences in observable characteristics is explored next. This analysis is performed using matching comparisons such that each teacher is paired with a professional or technician with the same observable characteristics.
The characteristics are gender, age, education, presence of kids (12 or younger) in the household, presence of elders (65 or older) in the household, whether the individual is the head of the household or not, presence of other wage earners in the household, part-time work, formality, and whether the individual works in the public sector. These variables are sequentially added as matching variables and the results are reported in Table 5. The decompositions are sequentially calculated for other professionals and technicians vis-à-vis that of (i) all school teachers, (ii) pre- school and elementary teachers, and (iii) secondary school teachers.
The structure of Table 5 is as follows. Each column corresponds to earnings gap decomposition after matching on a set of observable characteristics. The first column corresponds to decomposition where only gender is taken into account. That is, each male teacher is compared to a male professional or technician and each female teacher to a female professional or technician.
Moving to the right of the table, each column adds a matching variable such that in the last column of the table teachers and other professionals and technicians that are compared have the same observable characteristics on the 9 variables. That is, when moving a column to the right on Table 5 the comparison gets restricted to individuals with the same observable characteristics, adding one characteristic at a time . The lines of the table show the overall earnings gap on the first line (the original earnings gap), the four components of the earnings gaps on the second to fifth
12 lines and the two measures of the overlapping supports on the sixth and seventh lines3. The earnings gap that prevails on the restricted situation, in which teachers’ earnings are compared to those of non-teachers’ with the same characteristics, is denoted by ?0 in the table.
As already mentioned, the pay gap between teachers and other professionals and technicians reaches 31.3% of average teachers’ earnings. The first column shows that teachers’ underpayment vis-à-vis other professionals and technicians is explained to a certain extent by gender, to the point that when controlling for gender, non-teachers earn 27.3% more than teachers (the unexplained earnings gap ?0) as opposed to the original 31.3%. When introducing age on top of gender characteristics as control variables, the earnings gap reaches 31.3%. When adding education in to the analysis (that is, when comparing teachers and non-teachers with the same gender, age and education) the earnings gap increases almost 21%. This means that, although teachers are more educated than other professionals and technicians, their higher schooling attainment is not properly rewarded by the labor markets. When adding presence of kids (12 or younger), presence of elders (65 or older), whether the individual is the household head or not and presence of other wage earner in the household, the situation does not change much. However, after adding part- time work and formality the unexplained part of the earnings gaps increases 14% and 3.6%
respectively. Part-time work substantially explains the earnings gap. All in all, when comparing teachers and non-teachers with the set of 9 observable characteristics that Table 5 depicts (which will be referring ahead as the “full set”) , non-teachers earn almost 74.8% more than teachers.
Comparing pre-school and primary teachers with the same comparison group (other professionals and technicians) the gap is higher, 44%. Qualitatively the results are the same: the unexplained earnings gap between teachers and non-teachers increases substantially after the addition of education and part-time work. When using the 9 observable characteristic in the matching, the unexplained earnings gap reaches 80.1%. For secondary teachers vis-à-vis other professionals and technicians the earning gap is 1.3%. It increases to 32.8% after adding education and increases in 7.4% after adding part-time work. When using the 9 observable characteristic in the matching, non-teachers earn almost 62.6% more than teachers.
The last column of Table 5 adds working in the public sector as a control variable. However, this information is not available for Mexico, so the last column reports the results for only 8 countries.
Although the original earnings gap for these 8 countries is slightly higher (45.1% as opposed to the 31.3% that has been previously reported for the 9 countries), the inclusion of public sector as a control variable reduces the unexplained component of the earnings gap.
3The matching methodology used in this paper serves to decompose the original earnings gap into four elements (?0,
?NT, ?T and ?X) by matching teachers and non-teachers with the same observable characteristics . As in the traditional Blinder-Oaxaca decomposition, ?0 is the unexplained component of the gap (that share of the earnings gap that cannot be attributed to differences in characteristics of the individuals). The other three components correspond to differences in observable characteristics between the comparing groups. See Ñopo (2008) for extra methodological details.
13 Table 5
Earnings Gap Decompositions
Gender + Age + Education + Kid(s) in
the Household
+ Elder(s) in the Household
+ Household Head
+ Other Wage Earner
in the Household
+ Part-time
Work + Formality + Public Sector*
All School Teachers vis-à-vis Other Professionals and Technicians
? 31.3% 31.3% 31.3% 31.3% 31.3% 31.3% 31.3% 31.3% 31.3% 45.1%
?0 27.3% 31.3% 51.8% 53.0% 53.3% 54.8% 56.8% 71.2% 74.8% 68.1%
?NT 0.0% -4.2% -14.1% -16.7% -19.0% -19.1% -19.1% -17.0% -20.2% -2.0%
?T 0.0% -0.1% -0.1% -0.2% -0.2% -0.4% -0.4% -1.8% -0.9% -2.9%
?X 4.0% 4.2% -6.3% -4.7% -2.8% -4.0% -6.0% -21.1% -22.4% -18.1%
% CS Other Professionals and Technicians 100.0% 90.9% 72.5% 66.0% 61.1% 54.9% 47.7% 40.1% 33.1% 28.5%
% CS All School Teachers 100.0% 99.8% 98.5% 97.1% 95.1% 92.3% 88.2% 77.7% 70.8% 61.5%
Pre-school and Elementary Teachers vis-à-vis Other Professionals and Technicians
? 44.0% 44.0% 44.0% 44.0% 44.0% 44.0% 44.0% 44.0% 44.0% 59.3%
?0 39.0% 41.9% 57.3% 59.1% 59.4% 60.2% 61.3% 78.7% 80.1% 74.6%
?NT 0.0% -7.6% -14.4% -15.1% -16.9% -15.7% -12.3% -11.9% -15.5% 5.2%
?T 0.0% 0.0% -0.1% -0.3% -0.4% -0.3% -0.3% -1.7% -0.6% -1.4%
?X 5.1% 9.7% 1.3% 0.3% 1.8% -0.1% -4.7% -21.1% -20.1% -19.1%
% CS Other Professionals and Technicians 100.0% 82.5% 65.7% 59.9% 55.5% 49.2% 42.0% 35.0% 29.0% 23.5%
% CS Pre-School and Elementary Teachers 100.0% 99.9% 98.4% 97.0% 95.0% 92.4% 88.3% 77.8% 71.3% 61.8%
Secondary Teachers vis-à-vis Other Professionals and Technicians
? 1.3% 1.3% 1.3% 1.3% 1.3% 1.3% 1.3% 1.3% 1.3% 10.0%
?0 -0.1% 6.2% 39.0% 38.5% 38.8% 41.9% 46.2% 53.6% 62.6% 51.8%
?NT 0.0% -4.3% -23.2% -30.6% -33.6% -35.9% -34.9% -28.9% -34.4% -18.8%
?T 0.0% -0.1% -0.2% -0.1% 0.3% -0.6% -0.7% -2.1% -1.1% -6.2%
?X 1.3% -0.4% -14.3% -6.5% -4.3% -4.1% -9.3% -21.3% -25.7% -16.7%
% CS Other Professionals and Technicians 100.0% 86.3% 54.0% 44.2% 39.9% 34.1% 27.7% 22.1% 17.4% 13.5%
% CS Secondary Teachers 100.0% 99.8% 98.8% 97.7% 95.1% 92.2% 87.8% 77.3% 69.3% 60.4%
Source: National household surveys
* Mexico not considered. Unexplained earnings gaps for the full set were 75.6% for all teachers, 80.1% for pre-school and primary teachers, and 64.7% for secondary teachers.
In Figure 1, we report confidence intervals for the unexplained earnings gap between teachers and non-teachers for our different specifications.
14 Figure 1
Unexplained Earnings for Different Specifications for School Teachers vis-à-vis Professional and Technicians
20406080% of Average School Teachers' Earnings
Gender +Age +Education +Kid(s) +Elder(s) +Hh. Head +Oth. Earner+Time Worked +Formality +Pub. Sector*
CI(90%) CI(99%)
All Teachers vis-à-vis Other Prof. and Tech.
405060708090% of Average School Teachers' Earnings
Gender +Age +Education +Kid(s) +Elder(s) +Hh. Head +Oth. Earner+Time Worked +Formality +Pub. Sector*
CI(90%) CI(99%)
Preschool and Primary Teachers vis-à-vis Other Prof. and Tech.
020406080100% of Average School Teachers' Earnings
Gender +Age +Education +Kid(s) +Elder(s) +Hh. Head +Oth. Earner+Time Worked +Formality +Pub. Sector*
CI(90%) CI(99%)
Secondary Teachers vis-à-vis Other Prof. and Tech.
15 Table 6 presents the four components of the earnings gap decomposition using the full set of control variables by country for average teachers, pre-school and elementary school teachers, and for secondary school teachers, respectively vis-à-vis other professionals and technicians, and provides evidence of notable cross-country heterogeneity behind the region averages reported in Table 34. For two of the three specifications Nicaragua’s unexplained earnings gap is the widest.
Mexico’s unexplained gap is the widest if considering only pre -school and primary teachers.
However this result must be considered with care due to the small common support. Interestingly, although Mexico, Honduras and El Salvador show negative original earnings gaps, suggesting that school teachers earn more than other professionals and technicians, after controlling for the full set of observable characteristics the earnings gap goes from negative to positive. Only for secondary teachers the unexplained earnings gap remains negative in Mexico. Even more interestingly, in Chile the school teacher’s earnings gap is smaller after controlling for the full set of characteristics than the original gap. This last result seems to be driven by pre-school and primary teachers.
Table 6
Earnings Gap Decompositions by Country after matching on the full set of characteristics
Brasil Chile Ecuador El
Salvador Honduras Mexico Nicaragua Panamá Uruguay School Teachers vis-à-vis Other Professionals and Technicians
? 50.4% 27.4% 6.5% -4.8% -20.2% -21.6% 89.4% 9.5% 21.8%
?0 81.7% 13.8% 36.9% 6.2% 20.3% 12.3% 87.7% 23.6% 24.4%
?NT -5.0% -3.8% -13.2% -4.1% -13.3% -11.0% -22.2% -13.5% 2.3%
?T -0.3% 2.2% -19.3% -13.0% -18.0% -10.2% 4.1% -0.5% -5.4%
?X -25.9% 15.2% 2.1% 6.0% -9.2% -12.7% 19.7% -0.1% 0.5%
% CS Other Professionals and Technicians 44.0% 39.6% 21.6% 11.1% 13.5% 2.0% 11.6% 16.5% 9.6%
% CS All School Teachers 79.3% 75.1% 28.9% 18.4% 26.1% 35.7% 13.1% 44.5% 24.8%
Pre-school and Elementary Teachers vis-à-vis Other Professionals and Technicians
? 66.6% 35.6% 17.2% -6.0% -19.8% -18.7% 96.6% 19.6% 25.7%
?0 87.0% 15.3% 33.9% 5.2% 8.2% 91.3% 89.7% 32.8% 22.8%
?NT 2.6% 1.1% -9.0% -6.1% -2.2% -79.1% -9.7% -17.6% 8.1%
?T 0.6% 1.0% -20.1% -13.1% -17.6% -3.0% 6.7% -0.4% -3.8%
?X -23.6% 18.2% 12.3% 8.0% -8.3% -27.9% 9.9% 4.8% -1.4%
% CS Other Professionals and Technicians 39.2% 35.0% 16.1% 9.4% 10.3% 0.4% 10.0% 11.1% 5.0%
% CS Pre-School and Elementary Teachers 78.9% 76.3% 28.0% 17.8% 25.2% 29.5% 11.5% 45.4% 23.5%
Secondary Teachers vis-à-vis Other Professionals and Technicians
? 10.1% 5.3% -10.2% 7.0% -21.6% -23.1% 59.1% -4.1% 16.9%
?0 68.2% 9.8% 40.7% 13.9% 55.7% -17.6% 76.8% 10.6% 26.0%
?NT -21.9% -22.0% -24.8% 10.2% -45.7% 3.9% -41.8% -14.1% -0.4%
?T -2.9% 7.0% -19.3% -9.4% -19.6% -13.4% -9.6% 0.0% -7.6%
?X -33.3% 10.5% -6.8% -7.7% -12.0% 3.9% 33.7% -0.7% -1.1%
% CS Other Professionals and Technicians 24.1% 13.1% 8.5% 1.7% 4.2% 1.6% 2.8% 8.7% 5.7%
% CS Secondary Teachers 80.8% 71.0% 30.8% 23.5% 29.2% 39.0% 21.6% 42.8% 26.6%
Source: National household surveys
4 Confidence intervals by country can be found on Figure A1 of the appendix.
16 3.2 Distribution of the Unexplained Earnings Gap
An advantage of the matching approach over the traditional regression-based decompositions is that it is informative not only about the average unexplained gap but also about its distribution.
The following analysis report confidence intervals for the unexplained earnings gap between teachers and non-teachers by different characteristics, after controlling for all demographic and job-related characteristics. It provides further evidence of the heterogeneity of the unexplained component of the earnings gap. In general, teachers’ underpayment is more pronounced among males, older workers, those with complete tertiary education, household heads, part-timers, formal workers and seemingly for those who work in the private sector. Distributions also suggest that having a family life might come at a cost in income, especially raising kids.
17 Figure 2
Confidence Intervals for the Unexplained Earnings Gap by Different Characteristics for All Teachers versus Other Professional and Technicians
(after matching on the full set of characteristics)
050100150% of Average School Teachers' Earnings
Female Male
CI(90%) CI(99%)
Gender
050100150200% of Average School Teachers' Earnings
24 & under 25 to 34 35 to 44 45 to 54 55 & over
CI(90%) CI(99%)
Age
-100-50050100% of Average School Teachers' Earnings
None/Prim inc. Prim. comp/Sec inc. Sec. comp/Ter inc. Ter comp.
CI(90%) CI(99%)
Education
5060708090100% of Average School Teachers' Earnings
No kids at home Kid(s) at kome
CI(90%) CI(99%)
Kid(s) in the Household
20406080100
% of Average School Teachers' Earnings
No elders at home Elder(s) at home
CI(90%) CI(99%)
Elder(s) in the Household
6080100120
% of Average School Teachers' Earnings
Is not household head Is household head
CI(90%) CI(99%)
Household Head
60708090100
% of Average School Teachers' Earnings
One wage earner at home Oth. wage earner
CI(90%) CI(99%)
Other Wage Earner in the Household
406080100120
% of Average School Teachers' Earnings
Full time work Part-time work
CI(90%) CI(99%)
Part-time Work
20406080100
% of Average School Teachers' Earnings
Informal job Formal job
CI(90%) CI(99%)
Formality
405060708090% of Average School Teachers' Earnings
Public Sector Private Sector
CI(90%) CI(99%)
Work in Public Sector
18 Figure 3
Confidence Intervals for the Unexplained Earnings Gap by Different Characteristics for Pre-School and Elementary School Teachers versus Other Professionals and Technicians
(after matching on the full set of characteristics)
50100150200
% of Average School Teachers' Earnings
Female Male
CI(90%) CI(99%)
Gender
050100150% of Average School Teachers' Earnings
24 & under 25 to 34 35 to 44 45 to 54 55 & over
CI(90%) CI(99%)
Age
-100-50050100
% of Average School Teachers' Earnings
None/Prim inc. Prim. comp/Sec inc. Sec. comp/Ter inc. Ter comp.
CI(90%) CI(99%)
Education
60708090100% of Average School Teachers' Earnings
No kids at home Kid(s) at kome
CI(90%) CI(99%)
Kid(s) in the Household
406080100120
% of Average School Teachers' Earnings
No elders at home Elder(s) at home
CI(90%) CI(99%)
Elder(s) in the Household
6080100120% of Average School Teachers' Earnings
Is not household head Is household head
CI(90%) CI(99%)
Household Head
60708090100110% of Average School Teachers' Earnings
One wage earner at home Oth. wage earner
CI(90%) CI(99%)
Other Wage Earner in the Household
6080100120% of Average School Teachers' Earnings
Full time work Part-time work
CI(90%) CI(99%)
Part-time Work
406080100
% of Average School Teachers' Earnings
Informal job Formal job
CI(90%) CI(99%)
Formality
406080100120% of Average School Teachers' Earnings
Public Sector Private Sector
CI(90%) CI(99%)
Work in Public Sector
19 Figure 4
Confidence Intervals for the Unexplained Earnings Gap by Different Characteristics for Secondary School Teachers versus Other Professionals and Technicians
(after matching on the full set of characteristics)
-50050100150200
% of Average School Teachers' Earnings
Female Male
CI(90%) CI(99%)
Gender
-1000100200300400
% of Average School Teachers' Earnings
24 & under 25 to 34 35 to 44 45 to 54 55 & over
CI(90%) CI(99%)
Age
-50050100150
% of Average School Teachers' Earnings
None/Prim inc. Prim. comp/Sec inc. Sec. comp/Ter inc. Ter comp.
CI(90%) CI(99%)
Education
050100150
% of Average School Teachers' Earnings
No kids at home Kid(s) at kome
CI(90%) CI(99%)
Kid(s) in the Household
-50050100
% of Average School Teachers' Earnings
No elders at home Elder(s) at home
CI(90%) CI(99%)
Elder(s) in the Household
050100150200
% of Average School Teachers' Earnings
Is not household head Is household head
CI(90%) CI(99%)
Household Head
050100150
% of Average School Teachers' Earnings
One wage earner at home Oth. wage earner
CI(90%) CI(99%)
Other Wage Earner in the Household
050100150
% of Average School Teachers' Earnings
Full time work Part-time work
CI(90%) CI(99%)
Part-time Work
-50050100% of Average School Teachers' Earnings
Informal job Formal job
CI(90%) CI(99%)
Formality
-20020406080
% of Average School Teachers' Earnings
Public Sector Private Sector
CI(90%) CI(99%)
Work in Public Sector
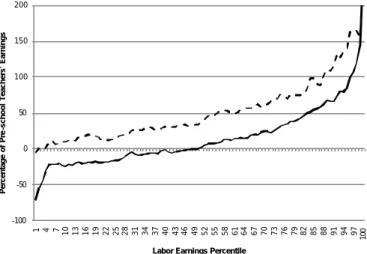
20 The distributions of income disparities are far from homogeneous throughout the conditional hourly earnings distribution. Figure 5 shows that, when considering the full set of observable variables, there are no major differences in hourly earnings between teachers and professional and technicians for the first percentiles of the distribution. On the other hand, there are major differences in favor of teachers when considering the original earnings gap. However, in both cases, it is at the top of the distribution of hourly earnings that the highest differences are found.
The typical teacher who is in the upper part of the earnings distribution faces an income penalty compared with other professionals and technicians5.
Figure 5
Unexplained Earnings Gap between Teachers and Other Professionals and Technicians along percentiles
of the earnings distribution
-100 -50 0 50 100 150 200
1 4 7 10 13 16 19 22 25 28 31 34 37 40 43 46 49 52 55 58 61 64 67 70 73 76 79 82 85 88 91 94 97 100
Percentage of School Teachers' Earnigns
Labor Earnings Percentile Original Gap Full Set
Figure 6 presents a similar analysis to the one in Figure 5 for those teachers in pre-school and primary school levels compared with other professionals and technicians. The Figure shows a similar result to the one obtained for all teachers; it presents evidence that the earnings gap in the bottom percentiles of the distribution do not considerably contribute to the aggregate measure of unexplained earnings differences between teachers and other professionals and technicians; the average earnings gap in Latin America is driven by pay differences at the top percentiles of the earnings distribution.
5 It is important to highlight the fact that the results below must be interpreted carefully. Results in the bottom five percentiles, as well in the upper five percentiles, are not robust. For that reason, the unexplained earnings gap along percentiles of the earnings distribution must be interpreted after the percentile 5 and before the percentile 95.