DISCUSSION PAPER SERIES
Forschungsinstitut zur Zukunft der Arbeit Institute for the Study of Labor
Evolution of Teachers’ Salaries in Latin America at the Turn of the 20th Century:
How Much Are They (Under or Over) Paid?
IZA DP No. 6806
August 2012 Alejandra Mizala Hugo Ñopo
Evolution of Teachers’ Salaries in Latin America at the Turn of the 20th Century:
How Much Are They (Under or Over) Paid?
Alejandra Mizala
Universidad de Chile
Hugo Ñopo
Inter-American Development Bank and IZA
Discussion Paper No. 6806 August 2012
IZA P.O. Box 7240
53072 Bonn Germany
Phone: +49-228-3894-0 Fax: +49-228-3894-180
E-mail: iza@iza.org
Any opinions expressed here are those of the author(s) and not those of IZA. Research published in this series may include views on policy, but the institute itself takes no institutional policy positions.
The Institute for the Study of Labor (IZA) in Bonn is a local and virtual international research center and a place of communication between science, politics and business. IZA is an independent nonprofit organization supported by Deutsche Post Foundation. The center is associated with the University of Bonn and offers a stimulating research environment through its international network, workshops and conferences, data service, project support, research visits and doctoral program. IZA engages in (i) original and internationally competitive research in all fields of labor economics, (ii) development of policy concepts, and (iii) dissemination of research results and concepts to the interested public.
IZA Discussion Papers often represent preliminary work and are circulated to encourage discussion.
Citation of such a paper should account for its provisional character. A revised version may be available directly from the author.
IZA Discussion Paper No. 6806 August 2012
ABSTRACT
Evolution of Teachers’ Salaries in Latin America at the Turn of the 20th Century: How Much Are They (Under or Over) Paid?
*How much are teachers paid in comparison to those in other professions in Latin America?
How have these differences evolved at the turn of the 20th century? This paper reports the evolution, between circa 1997 and circa 2007, of teachers´ salaries vis-à-vis workers in other professional and technical occupations for thirteen Latin-American countries. After controlling the earnings differentials by observable characteristics linked to productivity it is found that the hourly earnings gap, although substantial, decreased throughout the decade. This has been the case for earnings gaps at the main and secondary jobs, and also for those measured in terms of monthly and yearly earnings. Nonetheless, behind the region averages there is an important cross-country heterogeneity.
JEL Classification: J31, J44, J8, O54
Keywords: wage differentials, professional labor markets, national and international labor standards, Latin America, Caribbean
Corresponding author:
Hugo Ñopo
Inter-American Development Bank Colombia Country Office
Carrera 7ma 71‐21, Torre B, Piso 19 Bogotá
Colombia
E-mail: hugon@iadb.org
* Felipe Balcazar provided very valuable research assistance. We thank participants at seminars at the Economics Department at University of Chile, SECHI and LACEA Annual Meetings for comments and suggestions. Any mistake within the paper is our own and the findings herein do not necessarily represent the views of the Inter-American Development Bank or its Board of Directors. Mizala thanks financial support from PIA-CONICYT Project CIE-05 and Fondecyt project 1100308.
2 1. Introduction
School teachers’ salaries are often perceived to be lower than those of other professionals; this perception is especially strong among teachers. This affects the teachers’ motivation to educate (OECD 2009; Figlio and Kenny 2006; Ortega 2010, Player 2009, Heutel 2009, Loeb and Page, 2000);
causes good teachers to leave the profession (Imazeki 2005; Harris and Adams, 2007; Scafidi et al., 2007); and good students to avoid choosing an education major in college. These in turn would produce negative effects in students’ learning. To improve the quality of education it is essential to pay special attention to teachers and to implement policies to attract, motivate and retain the most talented individuals in the profession.
A series of studies have analyzed teachers’ salaries, with mixed results regarding their relative under or over-payment in the labor markets. In fact, the available empirical evidence shows that the sign and the magnitude of the conditional wage differential between teachers and other workers crucially depends on the definition of the comparison group, even when differences in observable characteristics are accounted for, both in Latin America1 and out of the region2.
More recently Mizala and Ñopo (2011), analyzing representative samples of nine Latin American countries circa 2007, found that teachers’ underpayment is stronger than what has been previously reported in the literature for Latin America. Teachers' underpayment with respect to other professionals and technicians was found to be more pronounced among males, older workers, household heads, part-timers, formal workers, those who work in the private sector, and (mostly) among those with complete tertiary education. Exploring the role of job schedules and job tenure (which are claimed to be more flexible and longer, respectively, for teachers) as compensating differentials, it was found that even after accounting for them the conditional earnings gap prevails. This paper builds up on these results, expanding them in three important dimensions: (i) exploring the evolution of those conditional earning gaps between circa 1997 and circa 2007, (ii) expanding the number of countries to thirteen, improving on its representativeness, and (iii) exploring deeper into the role of individuals’ unobservable characteristics by using information from their main and second jobs.
The question of earnings differentials conditioning on observable characteristics is assessed with a non-parametric matching approach developed in Ñopo (2008). The results depict a picture in which teachers, still today, are underpaid vis-à-vis other professionals and technicians. We found, however, that preschool and elementary teachers’ earnings (vis-à-vis those of other professionals and technicians) improved during the decade, especially for the young, females, part-time workers
1 Psacharopoulos et al. (1996), Liang (1999), and Hernani-Limarino (2005) analyze several Latin American countries.
Saavedra (2004) examines Perú, Mizala and Romaguera (2005) Chile, Lopez-Acevedo (2004) Mexico, Rivas and Lavarreda (2008) Guatemala, Herreros et al. (2003) Argentina, Piras and Savedoff (1998) and Urquiola et al. (2000) Bolivia.
2 Taylor (2008), Allegretto et al (2008), Podgursky and Tongrut (2006), Harris and Adams (2005), Stoddard (2005) for United States, Asadullah (2006) for Bangladesh; Komenan and Grootaert (1990) for Cote D’ Ivoire; Zymelman and DeStephano (1989) for Sub-Saharan African countries.
3 and those holding only one job. Also, teachers more frequently report having more than one job compared to other professionals and technicians. We analyze the decision of having a second job, as well the earnings gaps at main and second jobs between teachers and non-teachers (restricting our comparison to those who have a second job). The gap in the second job prevails but is smaller than in the main job, and it also decreased throughout the decade.
The rest of the paper proceeds as follows. In the next section we introduce the data sources, the approach to harmonize them across countries and some descriptive statistics comparing teachers with other professionals and technicians. In section three we present the main empirical analysis of earnings gaps decompositions (analyzing its evolution during the 10-year period), exploring the role of the two extra amenities: (i) shorter and flexible job schedules (with the consequent possibility of holding an extra job), and (ii) more job stability. In the fourth section we summarize and conclude.
2. The Data
The data comes from nationally representative household and labor surveys of thirteen Latin- American countries circa 1997 and circa 2007. Table 1 reports the specifics of each data source:
the country, the survey name, the year and the number of observations for the whole sample of workers (“Full Set”) and the subsamples of workers that will be compared (“Pre-School and Elementary Teachers”, “High School Teachers” and “Other Professionals and Technicians”). The expansion factors of each data set are used such that the relative size of each sample proportionally corresponds to the working population of each country. Table A1 in the Appendix shows the occupational categories that we used in each country to identify teachers and other professionals and technicians. University teachers and those with particular specialties (e.g., teachers for students with special needs, language instructors, sports instructors, driving instructors, and dance or art instructors) are not considered for the analysis. They are neither part of the teachers’ nor of the non-teachers’ population. Then, when we refer here to teachers or school teachers, we will be referring to both high school teachers and pre-school and elementary teachers.
The sample of interest (school teachers and other professionals and technicians) represents 10.2%
and 14.4% of the working sample circa 1997 and circa 2007 respectively. Those who declare being teachers stand for 3.5% and 3.1%, and the other professionals and technicians stand for 6.6% and 11.3% of the working sample for each period, respectively. Outliers for income at the main occupation were dropped from the data set. This comprised 1% of the working sample for both periods under analysis (0.3% and 0.6% percent of the school teachers, and 6% and 5% percent of the other professionals and technicians for each period, respectively).
Table 1 shows that the proportion of teachers ranges from 2% to 5% in both periods and it slightly decreased for many countries: Bolivia, Brazil, Chile, El Salvador, Panama, Paraguay and Peru. On the other hand, the population of other professionals and technicians increased for all countries during the period.
4 Table 1. Data Sources and Sample Sizes, by Group
* Source: Authors’ compilations from household surveys.
Note: Working populations in each country are identified as those earning a salary in the main occupation.
Number of Expanded Number of Expanded Number of Expanded Number of Expanded observations observations observations observations observations observations observations observations
1997 10288 2218471 350 69377 197 41673 708 158542
2009 8537 1478942 254 36549 181 25730 1360 206769
1995 110093 49700000 3406 1546106 719 313631 6217 2715156
2009 162632 78400000 3976 1918232 1150 542706 18352 9006210
1998 61492 4966500 1388 123222 365 40524 4524 579730
2009 82904 6021472 1535 113719 278 31928 8324 1003972
1995 12199 966662 218 16900 81 6541 720 68506
2009 18107 1797512 345 34639 211 19625 3047 366669
2000 8078 3096833 159 62525 29 10793 828 295452
2008 10810 3479268 252 80158 64 19633 757 356222
2000 9374 1967617 257 46650 38 4720 441 92618
2006 21694 5219747 529 117720 255 56533 1372 369388
1995 10950 1553995 265 33192 25 3672 691 110980
2009 24299 1961864 518 41415 54 4758 1733 198244
1995 9005 1539817 232 36542 78 11974 536 70158
2007 26588 1936852 719 53219 211 15042 2755 184566
1998 5739 1078232 181 31456 27 4920 324 71975
2005 11023 1652223 377 48401 64 9292 578 115217
1995 11318 722732 316 17680 207 13360 924 65954
2007 18843 1269338 395 24953 220 14764 1638 126569
Encuesta de Hogares por Muestra (Mano de obra) 1996 4452 1163769 83 22291 48 11779 264 68067
Encuesta Permanente de Hogares (EPH) 2006 6302 1692845 129 26241 51 10119 441 126717
1997 10036 8506517 247 153138 180 141606 774 832518
2009 33905 11600000 670 227592 388 130361 2897 1148469
1998 21202 979846 335 15388 257 12233 1710 81865
2007 25295 530153 592 12238 418 9023 2810 60406
Country Full Set
Other Professionals and Technicians/Teachers (non tertiary) Working Populations*
Year Name Of The Survey
Other Professionals and Technicians Pre-School and
Elementary Teachers High School Teachers
Encuesta Continua de Hogares (ECH) Brazil
Chile
Ecuador
El Salvador Dominican Republic
Nicaragua
Uruguay
Pesquisa Nacional por Amostra de Domicilio (PNAD)
Encuesta de Caracterizacion Socioeconomica Nacional (CASEN)
Encuesta de Empleo, Desempleo y Subempleo (ENEMDU)
Encuesta de Hogares de Propositos Multiples (EHPM)
Honduras Encuesta Permanente de Hogares de Propósitos Múltiples (EPHPM)
Panama Encuesta de Hogares (EH)
Peru Encuesta Nacional de Hogares (ENAHO) Bolivia Encuesta Nacional de Empleo (ENE or EE)
Costa Rica Encuesta de Hogares de Propósitos Múltiples (EHPM)
Paraguay
Encuesta Nacional de Fuerza de Trabajo (ENFT)
Encuesta Nacional de Hogares sobre medicion de Niveles de Vida (EMNV)
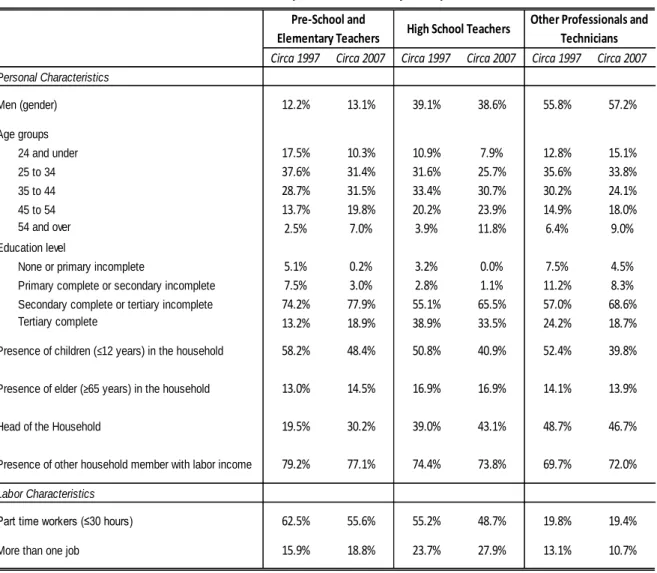
5 Table 2 shows the descriptive statistics for observable characteristics in all countries’ data sets for the two periods of analysis. Teaching is a predominantly female occupation as approximately nine out of ten pre-school and elementary teachers are women, and six out of ten high school teachers are so. On the other hand, the proportion of males among other professionals and technicians is roughly more than 50%. Such compositions remain almost unchanged over the decade. The working population aged during the period. Workers above 45 years old increased their share in all comparison groups but this has been more pronounced in the case of teachers.
Pre-school and elementary school teachers became more professionalized during the decade as the percentage of those with tertiary complete education jumped from 13% to 19%. This did not happen among neither high-school teachers nor other professionals and technicians. In all comparison groups the share of workers with secondary education increased while the share of those with lower education decreased. Teachers’ educational achievement surpasses that of other professionals and technicians and this has not changed during the decade.
In both periods around 50% of pre-school and elementary teachers report living with children (12 years old or younger), while around 45% of high school teachers and non-teachers do so. The trend during the decade, however, shows a decrease in fertility in all workers’ households. Also teachers, particularly high school teachers, report living with elder people (65 years or older) in a higher proportion than the other groups. Household headship has been less prevalent among teachers than among other professionals and technicians, but increased for the former during the decade. Similarly, presence of other household member generating labor income, another proxy for financial responsibility, reveals the shortening of differences between teachers and other professionals and technicians. The proportion of teachers working part-time (30 hours or less per week), although has declined, is almost threefold than that of other professionals and technicians.
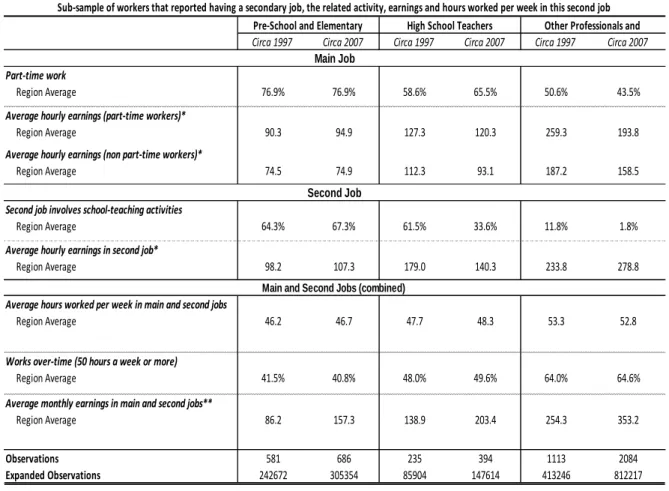
Even more interesting, not only a higher proportion of teachers have a secondary job, but also such share increased over the decade. During the same period such share decreased for other professionals and technicians.
6 Table 2. Descriptive Statistics, by Group
* Source: Authors’ calculations from household surveys.
Table 3 shows the relative earnings at the main job of the groups being compared by observable characteristics. Earnings are computed as hourly earnings, measured in terms of purchasing power parity (PPP, US$, 2000). Hourly earnings for each individual are computed dividing the monthly income by 4.3 times the number of hours worked in a week.3 Average school teachers’ hourly earnings circa 1997 have been set equal to 100 for each country (i.e., the average hourly earnings of both, pre-school and elementary teachers and high school teachers altogether).
3The monthly income corresponds to the monthly earnings received from the main occupation in the month previous to the survey. The job schedule is captured with survey questions of the type, for example: “¿Quantas horas trabalhava normalmente por semana nesse trabalho? ¿Cuántas horas trabaja efectivamente en su empleo o actividad principal?
Señale horas semanales, ¿cuántas horas efectivas al día trabajó la semana pasada? ¿Cuántas horas trabajó la semana pasada en la ocupación principal? El mes pasado, ¿cuántas horas a la semana trabajó en este negocio o empresa?
¿Cuántas horas por semana trabaja regularmente como...?; ¿Cuántas horas, días y en qué jornada trabajo efectivamente la semana anterior?”. So, it can be inferred that teachers are referring not only to their effective class time but to their whole job schedule (including preparation, grading, meeting times and the like).
Circa 1997 Circa 2007 Circa 1997 Circa 2007 Circa 1997 Circa 2007 Personal Characteristics
Age groups
24 and under 17.5% 10.3% 10.9% 7.9% 12.8% 15.1%
25 to 34 37.6% 31.4% 31.6% 25.7% 35.6% 33.8%
35 to 44 28.7% 31.5% 33.4% 30.7% 30.2% 24.1%
45 to 54 13.7% 19.8% 20.2% 23.9% 14.9% 18.0%
54 and over 2.5% 7.0% 3.9% 11.8% 6.4% 9.0%
Education level
None or primary incomplete 5.1% 0.2% 3.2% 0.0% 7.5% 4.5%
Primary complete or secondary incomplete 7.5% 3.0% 2.8% 1.1% 11.2% 8.3%
Secondary complete or tertiary incomplete 74.2% 77.9% 55.1% 65.5% 57.0% 68.6%
Tertiary complete 13.2% 18.9% 38.9% 33.5% 24.2% 18.7%
Labor Characteristics
More than one job 15.9% 18.8% 23.7% 27.9% 13.1% 10.7%
19.8% 19.4%
55.2%
43.1%
74.4%
48.7%
77.1%
62.5% 55.6%
58.2% 48.4%
13.0% 14.5%
19.5% 30.2%
79.2% 73.8%
Head of the Household
Presence of other household member with labor income
52.4% 39.8%
14.1% 13.9%
48.7% 46.7%
69.7% 72.0%
50.8% 40.9%
16.9% 16.9%
39.0%
Part time workers (≤30 hours)
Other Professionals and Technicians Pre-School and
Elementary Teachers High School Teachers
55.8% 57.2%
12.2% 13.1% 39.1% 38.6%
Men (gender)
Presence of children (≤12 years) in the household
Presence of elder (≥65 years) in the household
7 It is shown in the table that, on average, for both periods pre-school and elementary teachers earn less than high school teachers; these in turn earn less than other professionals and technicians circa 1997 and slightly more circa 2007. However, it should be noted that during the period, pre- school and elementary teachers’ earnings increased during the period of analysis while that of high-school teachers slightly dropped. The most notorious change in earnings can be seen among other professional and technicians. On average it dropped almost 25% in real terms which corresponds to almost 50% of average teachers’ earnings circa 1997. This suggests, by now, that the gap closed due to a decrease in other professionals and technicians real acquisitive capacity.
Regarding differences according to the observable characteristics of the populations the typical patterns arise. Men earn more than women, especially in the case of other professionals and technicians. Earnings increase along a worker’s life span, as well as with higher educational attainment. People that live with kids, live with elder people, are not household heads and live with another wage earner tend to earn less that those who don’t or are not. These differences tend to be more pronounced among other professional and technicians than among teachers.
Additionally, part-time workers and those who report having more than one job earn more than those who don’t. The difference between workers who have a second job and those who don’t slightly decreased during the decade, while the difference between those who are part-time workers and those who are not markedly increased.
8 Table 3. Relative Hourly Earnings at the Main Job, by Group
* Source: Authors’ calculations from household surveys
At the aggregate, on average, other professionals and technicians earn around 115% and 43%
more than pre-school and elementary teachers, circa 1997 and circa 2007 respectively. Also, they earn 42% more than high school teachers circa 1997, and 5% less circa 2007 (although this last difference is not significant at conventional levels). These statistics, however, are merely referential. They compare teachers with professionals and technicians that might substantially differ in terms of observable characteristics. As shown above in this section, teachers and other
Circa 1997 Circa 2007 Circa 1997 Circa 2007 Circa 1997 Circa 207
Average Hourly Earninngs 90.3 99.7 134.3 128.7 163.0 123.0
Personal Characteristics Men
No 89.3 97.6 132.4 127.8 141.3 112.8
Yes 97.5 113.3 137.2 130.1 180.2 130.6
Age groups
24 and under 59.6 64.5 112.0 84.5 90.3 70.5
25 to 34 83.5 88.1 123.0 112.7 153.2 114.1
35 to 44 103.8 103.7 140.7 130.3 183.1 135.1
45 to 54 115.0 118.4 148.4 140.0 195.1 150.7
54 and over 116.7 132.2 160.0 166.0 193.1 156.4
Education level
None or primary incomplete 32.3 49.5 81.2 29.9 78.6 62.4
Primary complete or secondary incomplete 45.5 82.8 111.4 109.4 93.5 76.3
Secondary complete or tertiary incomplete 97.1 96.9 145.1 123.1 174.8 119.1
Tertiary complete 99.8 114.3 125.0 140.3 193.6 172.5
Presence of children (≤12 years) in the household
No 96.0 101.5 137.0 129.7 170.3 125.1
Yes 86.2 97.7 131.6 127.3 156.3 119.7
Presence of elder (≥65 years) in the household
No 90.7 99.3 135.9 128.1 164.4 124.0
Yes 87.2 101.6 126.4 131.8 154.5 116.7
Head of the household
No 87.3 94.4 127.9 123.1 134.8 107.0
Yes 102.4 111.9 144.2 136.2 192.7 141.1
Presence of other household member with labor income
No 90.2 100.3 129.2 129.4 171.5 128.0
Yes 90.3 99.5 136.0 128.5 159.3 121.0
Labor Characteristics Part time
No 84.8 87.5 121.3 110.3 154.3 118.5
Yes 93.5 109.3 144.8 148.1 197.8 141.6
More than one job
No 87.1 97.2 132.0 125.2 158.1 120.0
Yes 107.1 110.2 141.5 137.9 195.1 148.2
Relative Hourly Earnings (Base: Average School Teacher Earnings circa 1997 in each Country=100)
Other Professionals and Technicians Pre-School and
Elementary Teachers High School Teachers
9 professionals and technicians differ regarding their human capital, job characteristics and socio- demographic composition. Then, it is appropriate to think that these differences in observable characteristics play a role explaining the earnings differentials. Hence, controlling the earnings gap by observable characteristics becomes necessary for a better estimation of the underlying earnings gap. The next section presents computations of the earnings gaps between teachers (preschool and primary, and secondary) and other professionals and technicians after matching individuals according to their observable characteristics.
3. Earnings Changes at the turn of the 20th Century for teachers vis-à-vis other professionals and technicians
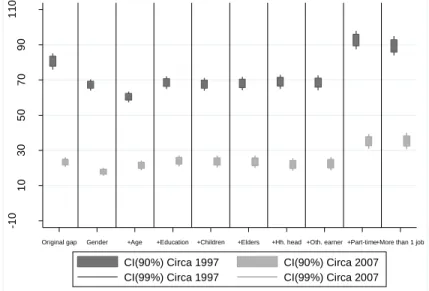
The extent to which the earnings differentials can be attributed to differences in observable characteristics is explored next. This is done using matching comparisons such that each teacher is paired with a professional or technician with the same observable characteristics (for methodological details see Ñopo, 2008). The characteristics are gender, age, education, presence of kids (12 or younger) in the household, presence of elders (65 or older) in the household, whether the workers is or not household head, presence of other wage earners in the household, whether the individual has a part-time work, and whether the individual holds a secondary job (all together will be referred as the “full set” of observable characteristics). These variables are sequentially added as matching variables and the results are reported in Figure 1. The decompositions are sequentially calculated for (i) pre-school and elementary teachers and (ii) high school teachers, for the first (circa 1997) and second (circa 2007) periods, vis-à-vis other professionals and technicians.
3.1 Evolution of Average Earnings Gaps (controlling for observable characteristics)
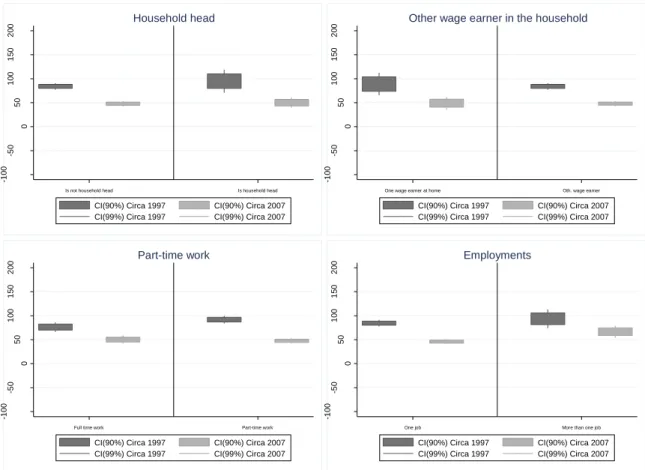
Figure 1 shows the drop in earnings gaps between the teaching groups and their comparing group of other professionals and technicians for the period under analysis (the panel “a” of the figure is for pre-school and elementary teachers and the panel “b” for high school teachers). All the earnings gaps are measured in terms of percentages of the average earnings of the teaching group that takes part on the comparison. The first pair of boxes, at the left, shows the gap that remains after matching teachers and non-teachers on gender only. That is, each male teacher is compared to a male professional or technician and each female teacher to a female professional or technician. Moving to the right each pair of boxes shows the gaps that remain after adding a matching variable. In this way, the last pair of boxes show the earnings gaps between teachers and other professionals and technicians that have the same observable characteristics on nine variables (gender, age, education, presence of children at home, presence of elders at home, an indicator for being a household head, an indicator for the presence of other income earner at home, part-time work and an indicator for holding more than one job). That is, when moving two
10 boxes to the right on Figure 1 the comparison gets restricted to individuals with the same observable characteristics, adding one characteristic at a time.
The figure shows a drop in earnings gaps that is more pronounced for pre-school and elementary teachers than for high school teachers. For the latter the drop in earnings gaps vis-à-vis other professionals and technicians is not statistically significant for almost all sets of matching characteristics.
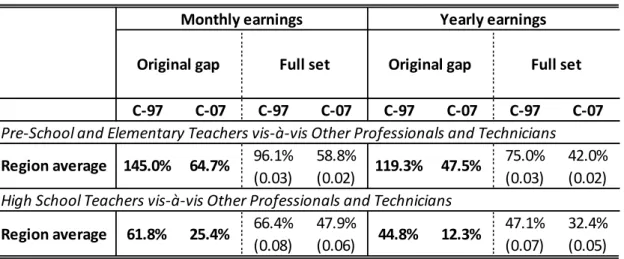
Table 4 shows the same earnings gaps by country. Similarly to Figure 1, each pair of columns of the table corresponds to the earnings gap that remains after matching on a set of observable characteristics. Within each pair of columns, the first column corresponds to circa 1997 results and the second, circa 2007 results. The first pair of columns corresponds to the original earnings gap (the one that is measured with no matching at all). Moving to the right, each pair of columns add a matching variable such that in the last column of the table, teachers and other professionals and technicians being compared have the same observable characteristics on the nine variables.
Although some countries present negative original earnings gaps, unexplained earnings gaps after controlling for the full set of observable characteristics are either positive or statistically zero.
Looking at each country separately it can be seen that the original earnings gap between pre- school and elementary teachers vis-à-vis other professionals and technicians decreased in most countries of the region but it did specially for Bolivia, Brazil and Dominican Republic. The only countries where such gap increased were Costa Rica and Ecuador. The gap regarding high school teachers markedly decreased for Bolivia, Brazil and Uruguay; the gap increased for Paraguay, Nicaragua and El Salvador. All in all, the original and unexplained earnings gaps dropped for both specifications of regions’ average and for both pairs in comparison.
Figure 1. Confidence Intervals for the Unexplained Earnings Gap Controlling by Observable Characteristics a. Pre-School and Elementary School Teachers versus Other Professionals and Technicians
b. High School Teachers versus Other Professionals and Technicians
-10 1030507090110
% of Average Teachers' Earnings
Original gap Gender +Age +Education +Children +Elders +Hh. head +Oth. earner +Part-time+More than 1 job
CI(90%) Circa 1997 CI(90%) Circa 2007 CI(99%) Circa 1997 CI(99%) Circa 2007
11
Source: Authors’ calculations based on household surveys
Note: Boxes show 90 percent confidence intervals for unexplained earnings; whiskers show 99 percent confidence intervals.
-10 1030507090110
% of Average Teachers' Earnings
Original gap Gender +Age +Education +Children +Elders +Hh. head +Oth. earner +Part-time+More than 1 job
CI(90%) Circa 1997 CI(90%) Circa 2007 CI(99%) Circa 1997 CI(99%) Circa 2007
12 Table 4
Unexplained Earnings Gap by Country Controlling by Observable Characteristics
C-97 C-07 C-97 C-07 C-97 C-07 C-97 C-07 C-97 C-07 C-97 C-07 C-97 C-07 C-97 C-07 C-97 C-07 C-97 C-07
70.9% -23.9% 69.9% -11.9% 82.7% -1.9% 87.4% 1.5% 87.5% 0.1% 84.7% -4.8% 93.1% -3.0% 108.9% 28.4% 94.5% 33.5%
(0.05) (0.04) (0.06) (0.06) (0.07) (0.05) (0.08) (0.06) (0.08) (0.06) (0.09) (0.06) (0.1) (0.06) (0.16) (0.08) (0.2) (0.09) 80.8% 17.7% 70.3% 21.6% 80.4% 26.5% 78.6% 25.9% 78.2% 25.8% 79.2% 24.9% 77.7% 25.4% 100.9% 37.0% 97.2% 37.8%
(0.02) (0.01) (0.02) (0.01) (0.02) (0.02) (0.02) (0.02) (0.02) (0.02) (0.02) (0.02) (0.02) (0.02) (0.03) (0.02) (0.03) (0.02) 33.1% 24.8% 39.4% 22.5% 50.2% 26.7% 50.6% 26.2% 48.7% 24.0% 43.3% 21.4% 42.9% 19.6% 54.9% 19.4% 52.0% 17.9%
(0.02) (0.02) (0.03) (0.03) (0.04) (0.05) (0.05) (0.05) (0.05) (0.05) (0.05) (0.05) (0.05) (0.05) (0.06) (0.05) (0.06) (0.05) -8.4% -1.0% -10.2% -1.0% -2.7% 9.5% -11.4% 9.3% -8.7% 10.5% -11.9% 11.0% -14.8% 8.5% -17.9% 13.8% -15.4% 18.9%
(0.03) (0.03) (0.05) (0.05) (0.06) (0.07) (0.06) (0.06) (0.07) (0.06) (0.06) (0.06) (0.07) (0.06) (0.06) (0.07) (0.06) (0.08) 62.2% 19.3% 63.8% 24.1% 55.4% 32.7% 55.3% 36.6% 52.7% 25.0% 47.2% 15.0% 52.8% 18.2% 59.8% 25.6% 43.2% 23.2%
(0.06) (0.04) (0.12) (0.08) (0.08) (0.09) (0.08) (0.11) (0.09) (0.1) (0.09) (0.12) (0.11) (0.12) (0.16) (0.2) (0.16) (0.26) 8.8% 23.7% 7.9% 26.6% 9.4% 14.1% 8.6% 17.3% 8.9% 19.9% 12.0% 16.9% 10.7% 17.4% 29.1% 35.3% 33.5% 28.4%
(0.05) (0.03) (0.06) (0.04) (0.06) (0.04) (0.06) (0.05) (0.07) (0.05) (0.08) (0.05) (0.11) (0.05) (0.18) (0.07) (0.19) (0.08) -4.6% -5.9% -2.7% -0.3% -6.4% -10.1% -7.0% -6.9% -8.2% -13.0% -6.2% -11.7% -7.1% -17.2% 12.1% 4.6% 11.3% 5.6%
(0.03) (0.02) (0.04) (0.05) (0.04) (0.06) (0.04) (0.06) (0.04) (0.06) (0.05) (0.06) (0.05) (0.05) (0.09) (0.1) (0.11) (0.1) -10.1% -21.0% -11.7% -23.1% -10.6% -20.2% -9.6% -18.7% -9.7% -18.4% -6.5% -12.7% -5.5% -9.1% 9.5% 33.4% 8.5% 36.3%
(0.04) (0.03) (0.04) (0.03) (0.04) (0.04) (0.04) (0.04) (0.04) (0.04) (0.04) (0.05) (0.05) (0.05) (0.07) (0.1) (0.07) (0.12) 90.8% 91.2% 80.1% 84.3% 65.3% 56.2% 52.5% 51.8% 70.6% 50.1% 71.3% 43.5% 66.9% 32.9% 139.6% 49.3% 151.8% 57.3%
(0.08) (0.06) (0.1) (0.07) (0.11) (0.08) (0.1) (0.09) (0.17) (0.11) (0.19) (0.11) (0.21) (0.11) (0.42) (0.16) (0.45) (0.16) 30.4% 17.2% 34.2% 19.1% 22.9% 22.0% 21.2% 18.3% 17.7% 20.6% 13.5% 23.7% 16.7% 22.5% 29.2% 25.8% 24.1% 24.6%
(0.03) (0.03) (0.05) (0.04) (0.06) (0.05) (0.06) (0.05) (0.06) (0.06) (0.07) (0.06) (0.08) (0.06) (0.11) (0.07) (0.1) (0.07) 62.9% 46.4% 33.3% 45.6% 4.0% 17.1% 6.1% 6.0% 5.8% -6.9% 10.8% -0.5% -4.4% 4.0% 3.5% 3.3% 2.4% -3.4%
(0.08) (0.05) (0.12) (0.09) (0.12) (0.09) (0.13) (0.08) (0.13) (0.08) (0.15) (0.09) (0.1) (0.11) (0.18) (0.15) (0.24) (0.09) 29.0% 24.5% 35.6% 33.0% 33.5% 37.8% 29.5% 35.0% 29.9% 36.8% 29.7% 29.2% 25.4% 26.1% 43.8% 45.6% 50.3% 42.4%
(0.04) (0.03) (0.1) (0.04) (0.09) (0.04) (0.12) (0.05) (0.12) (0.05) (0.12) (0.05) (0.12) (0.05) (0.21) (0.07) (0.26) (0.08) 30.6% 30.7% 33.1% 26.6% 57.5% -7.9% 59.8% -9.1% 62.5% -8.6% 70.8% -12.8% 66.3% -4.0% 81.8% 17.0% 67.8% 19.0%
(0.03) (0.04) (0.04) (0.04) (0.05) (0.04) (0.05) (0.04) (0.06) (0.04) (0.07) (0.05) (0.08) (0.06) (0.09) (0.08) (0.1) (0.11) Latin America 67.2% 17.9% 60.4% 21.5% 68.5% 24.0% 67.6% 23.7% 68.0% 23.5% 68.9% 22.0% 68.4% 22.5% 92.7% 35.1% 89.4% 35.3%
(13 countries) (0.01) (0.01) (0.01) (0.01) (0.01) (0.01) (0.01) (0.01) (0.01) (0.01) (0.02) (0.01) (0.02) (0.01) (0.02) (0.02) (0.02) (0.02) 98.8%
20.1%
39.3%
33.7%
25.6%
Chile 36.3%
-3.6%
25.5%
26.3%
-5.3%
Original gap
-17.9%
Nicaragua 112.4%
Panama 37.5%
Paraguay 75.0%
Ecuador 9.0%
El Salvador -1.9%
Honduras -0.9%
Bolivia 81.2%
Brazil 112.5%
+ Elders living in the household
+ Household head
+ Another wage earner living in the household
+ Part-time +Gender + Age + Education Work
+ Children living in the
household Country
-20.4%
27.0%
+ Has more than one job Pre-School and Elementary Teachers vis-à-vis Other Professionals and Technicians
80.5% 23.3%
45.4%
Costa Rica -4.6%
Dom. Rep. 78.1%
Peru 36.4%
Uruguay 42.9%
13
Source: Authors’ calculations based on household surveys Note: Standard errors in parentheses
C-97 C-07 C-97 C-07 C-97 C-07 C-97 C-07 C-97 C-07 C-97 C-07 C-97 C-07 C-97 C-07 C-97 C-07 C-97 C-07
30.7% -18.9% 35.1% -12.0% 43.2% -2.6% 43.0% -1.1% 48.6% -0.7% 43.3% 5.5% 43.3% 0.0% 60.1% 13.7% 61.4% 17.1%
(0.05) (0.04) (0.08) (0.07) (0.08) (0.07) (0.09) (0.07) (0.09) (0.07) (0.11) (0.08) (0.12) (0.07) (0.21) (0.11) (0.24) (0.11) 15.5% -6.5% 12.9% 0.6% 25.8% 9.7% 25.0% 10.6% 23.2% 10.6% 22.9% 9.5% 25.4% 8.9% 29.1% 14.2% 27.1% 16.4%
(0.04) (0.02) (0.05) (0.03) (0.06) (0.04) (0.06) (0.05) (0.06) (0.05) (0.06) (0.05) (0.06) (0.05) (0.06) (0.05) (0.07) (0.06) 21.1% 1.8% 28.5% 4.6% 61.2% 21.7% 57.7% 19.1% 55.0% 16.2% 51.3% 13.8% 50.7% 16.5% 54.8% 17.5% 52.2% 17.6%
(0.04) (0.04) (0.06) (0.08) (0.09) (0.13) (0.09) (0.11) (0.09) (0.1) (0.09) (0.1) (0.09) (0.09) (0.11) (0.09) (0.11) (0.08) -14.3% -12.3% -16.5% -8.9% -2.4% 2.3% -7.0% 3.5% -13.8% 0.8% -13.2% 2.9% -15.2% 5.1% 1.3% 17.9% -10.7% 13.6%
(0.05) (0.04) (0.09) (0.09) (0.13) (0.12) (0.15) (0.11) (0.15) (0.1) (0.15) (0.1) (0.17) (0.11) (0.23) (0.13) (0.26) (0.11) 22.9% 11.7% 26.1% 12.6% 26.4% 29.2% 30.9% 25.2% 34.2% 13.2% 28.2% 7.6% 19.2% 20.8% 18.0% 16.0% 66.0% 4.8%
(0.18) (0.07) (0.22) (0.23) (0.21) (0.24) (0.28) (0.23) (0.31) (0.25) (0.31) (0.28) (0.28) (0.3) (0.42) (0.31) (0.58) (0.38) -7.1% -5.7% -15.4% 9.6% -13.2% 14.0% -16.1% 12.2% -14.4% 16.5% -38.4% 15.9% -0.3% 16.4% 20.4% 41.4% 28.3% 29.3%
(0.11) (0.04) (0.18) (0.07) (0.2) (0.08) (0.21) (0.07) (0.31) (0.08) (0.27) (0.08) (0.33) (0.09) (0.74) (0.12) (0.17) (0.13) -0.7% 7.6% -2.4% 6.5% 7.7% 33.7% 4.2% 7.0% 3.6% -4.9% 2.9% -8.0% 8.6% -4.5% -6.8% -13.5% -1.6% -5.8%
(0.12) (0.06) (0.2) (0.23) (0.21) (0.58) (0.24) (0.22) (0.22) (0.19) (0.21) (0.19) (0.26) (0.2) (0.15) (0.23) (0.18) (0.16) -23.2% -20.1% -18.0% -14.7% 0.8% 8.4% -11.8% 4.9% -17.9% 3.6% -16.0% 10.2% -12.5% 9.6% -7.5% 30.9% -2.4% 12.0%
(0.06) (0.04) (0.08) (0.07) (0.11) (0.1) (0.09) (0.09) (0.1) (0.09) (0.1) (0.1) (0.11) (0.1) (0.09) (0.17) (0.09) (0.13) 23.4% 58.9% 51.0% 45.6% 111.5% 70.9% 125.6% 63.5% 121.0% 74.3% 132.2% 59.9% 47.3% 42.5% 28.2% 58.6% 28.2% 51.5%
(0.16) (0.08) (0.29) (0.17) (0.33) (0.25) (0.4) (0.23) (0.42) (0.28) (0.58) (0.25) (0.83) (0.33) (0) (0.38) (0) (0.42) -2.1% -4.3% 9.2% -2.8% 24.8% 15.8% 23.0% 16.1% 22.8% 19.3% 25.3% 11.4% 29.4% 10.4% 33.1% 16.1% 37.9% 21.5%
(0.03) (0.03) (0.06) (0.05) (0.07) (0.06) (0.08) (0.06) (0.07) (0.07) (0.09) (0.07) (0.11) (0.07) (0.11) (0.07) (0.13) (0.08) 1.5% 13.4% -11.1% 49.2% -4.5% 41.5% 8.3% 39.5% 2.5% 37.3% 11.6% 41.0% 15.0% -11.9% 92.1% 16.6% -21.1% 40.9%
(0.1) (0.09) (0.14) (0.23) (0.17) (0.28) (0.19) (0.27) (0.2) (0.33) (0.25) (0.3) (0.28) (0.28) (0.29) (0.25) (0.03) (0.23) 6.9% 2.4% 12.8% 8.8% 12.5% 18.5% 10.5% 18.9% 2.2% 18.7% 7.0% 17.3% -2.5% 16.0% 15.9% 43.2% 24.2% 42.4%
(0.04) (0.03) (0.09) (0.05) (0.09) (0.06) (0.1) (0.06) (0.1) (0.07) (0.12) (0.07) (0.1) (0.07) (0.14) (0.1) (0.18) (0.13) 38.7% 19.0% 38.2% 17.1% 44.6% -9.0% 41.9% -6.5% 40.9% -7.2% 44.6% -6.0% 46.5% -0.1% 62.1% 2.3% 62.5% 12.5%
(0.05) (0.04) (0.07) (0.05) (0.08) (0.06) (0.08) (0.06) (0.09) (0.06) (0.1) (0.07) (0.1) (0.09) (0.12) (0.09) (0.13) (0.11) Latin America 13.9% -4.3% 14.4% 3.0% 25.7% 12.2% 24.9% 12.2% 22.5% 12.2% 23.1% 11.2% 23.6% 10.5% 32.4% 18.8% 31.7% 18.8%
(13 countries) (0.02) (0.02) (0.03) (0.03) (0.03) (0.03) (0.04) (0.03) (0.04) (0.04) (0.04) (0.04) (0.04) (0.04) (0.05) (0.04) (0.05) (0.05) -4.5%
7.8%
-19.0%
60.9%
-3.7%
10.5%
-17.9%
-3.2%
5.6%
-13.6%
13.1%
+Gender + Age
4.7%
16.9%
Original gap + Has more than
one job High School Teachers vis-à-vis Other Professionals and Technicians
+ Education
+ Children living in the
household
+ Elders living in the household
+ Household head
+ Another wage earner living in the household
+ Part-time Work Country
Ecuador -7.0%
Honduras -22.2%
Chile 26.2%
Costa Rica -12.0%
Dom. Rep. 24.9%
Peru 8.9%
Uruguay 44.0%
Nicaragua 28.9%
Panama -0.6%
Paraguay 6.5%
21.4% -4.5%
Bolivia 35.1%
Brazil 23.9%
El Salvador -0.9%
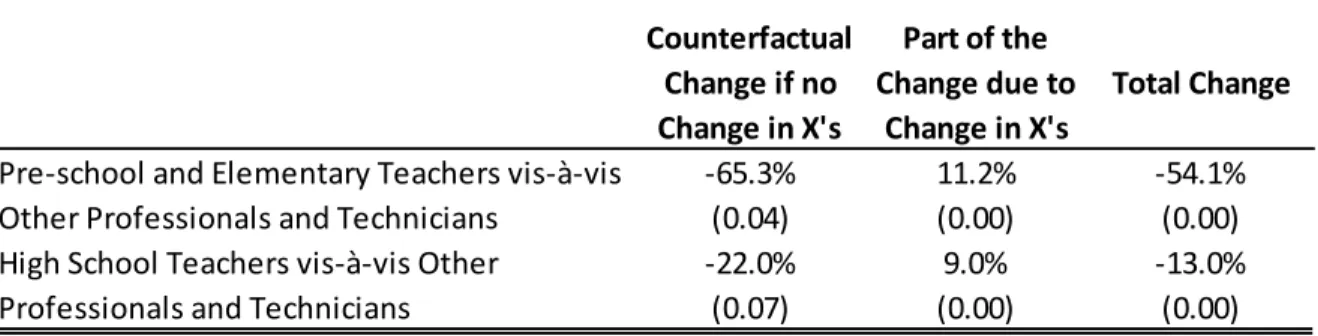
14 The drops in unexplained earnings gaps can arise either as a result of a general trend of gaps decreasing in the segments considered of the labor markets (that is, those for professionals and technicians, where teachers are involved), or can also be the result of changes over time of the distribution of individuals’ observable characteristics. To further explore the effects of labor market trends versus changes in labor markets composition, Table 5 presents a “matching after matching” exercise (Ñopo and Hoyos, 2010) disentangling both. The first stage of matching is performed with the full set of observable characteristics, matching teachers with other professionals and technicians in both moments under consideration (circa 1997 and circa 2007), as it has already been performed. After that, the matching after matching exercise is performed for the two matched sets of workers, matching the circa 1997 data with the one from circa 2007. In this way not only teachers and non-teachers show no differences in observable characteristics, but also they show no changes in the distribution of those characteristics during the period under analysis. The results, shown in Table 5, indicate that there is more evidence of a general trend of decreasing gaps than one of an improvement of teachers’ characteristics. The change in earnings gaps due to changes in the distributions of observable characteristics is positive and higher for pre- school and elementary teachers, but compensated by the change in the counterfactual component.
Table 5. Decomposition of the Change in Unexplained Earnings Gap circa 2007- circa 1997 (after Controlling by the Full Set of Observable Characteristics)
Source: Authors’ calculations based on household surveys.
3.2 Changes in the Distribution of the Unexplained Earnings Gap
After matching individuals on the basis of observable characteristics it is possible to explore not only the average but also the distribution of the earnings gaps in each period. In general, as reported in Mizala and Ñopo (2011), pre-school and elementary school teachers’ underpayment is more pronounced among older and more educated workers, household heads, part-time workers, and those who report having more than one job. As reported in Table 5, during the period under analysis there is evidence of a general trend over all the labor markets for a reduction of earnings gaps. Within this matching exercise, nonetheless, it is possible to explore the segments of the
Counterfactual Change if no Change in X's
Part of the Change due to
Change in X's
Total Change
-65.3% 11.2% -54.1%
(0.04) (0.00) (0.00)
-22.0% 9.0% -13.0%
(0.07) (0.00) (0.00)
Pre-school and Elementary Teachers vis-à-vis Other Professionals and Technicians
High School Teachers vis-à-vis Other Professionals and Technicians
15 labor markets for which the drops in gaps have been more pronounced. The bigger drops in earnings gaps for pre-school and elementary teachers occurred among younger individuals, those with higher education (secondary complete or more), with no elders at home, part-time workers and those with no secondary jobs. For high school teachers, the earnings gaps are more pronounced among household heads and those holding more than one job. Among these teachers there is no particular segment of the market for which the gap dropped particularly more than the rest. 4
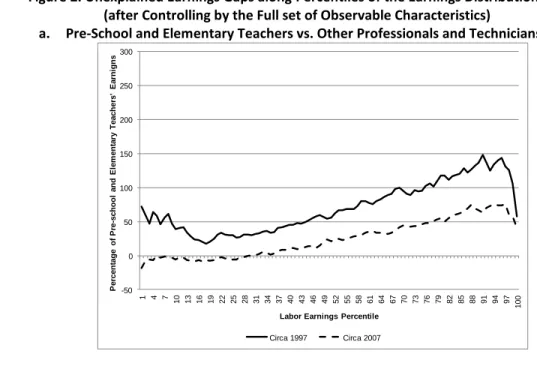
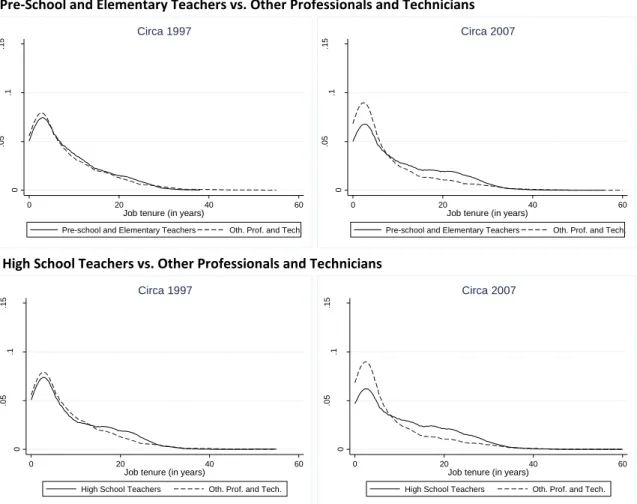
Figure 2 shows the unexplained earnings gaps along the individuals’ earnings distribution. The first panel of it shows the unexplained earnings gap that pre-school and elementary school face in comparison to other professionals and technicians; the second panel does it for high school teachers. Both show that the earnings gap between teachers and comparable workers in Latin America are driven by pay differences at the top percentiles of the earnings distribution. In this regard there is no much cross-country heterogeneity.5
This first panel of Figure 2 evidences that, after controlling by the full set of observable characteristics, there are no major differences in hourly earnings between pre-school and elementary teachers and other professional and technicians for the bottom third of the population circa 2007. The second panel depicts similar results, with smaller changes between circa 1997 and 2007.
Figure 2. Unexplained Earnings Gaps along Percentiles of the Earnings Distribution (after Controlling by the Full set of Observable Characteristics)
a. Pre-School and Elementary Teachers vs. Other Professionals and Technicians
4Confidence intervals for the unexplained earnings gap between teachers and non-teachers by different characteristics, after controlling by the full set, can be found on Figures A1 and A2 of the Appendix.
5Country-by-country results of the unexplained earnings gaps along percentiles of the earnings distribution are not shown here but these are available from the authors upon request.
-50 0 50 100 150 200 250 300
1 4 7 10 13 16 19 22 25 28 31 34 37 40 43 46 49 52 55 58 61 64 67 70 73 76 79 82 85 88 91 94 97 100
Percentage of Pre-school and Elementary Teachers' Earnigns
Labor Earnings Percentile Circa 1997 Circa 2007