Research Collection
Working Paper
Battery Electric Vehicle adoption in regions without strong policies
Author(s):
Brückmann, Gracia; Willibald, Fabian; Blanco Gonzalez, Victor Publication Date:
2020-12-09 Permanent Link:
https://doi.org/10.3929/ethz-b-000456016
Originally published in:
OSF Preprints , http://doi.org/10.31219/osf.io/u45dg
Rights / License:
CC0 1.0 Universal
This page was generated automatically upon download from the ETH Zurich Research Collection. For more
information please consult the Terms of use.
Battery Electric Vehicle adoption in regions without strong policies (Br¨ uckmann, Willibald, Blanco 2020)
1Highlights
• Revealed preferences from battery electric vehicle and conventional car holders
• Survey data combined with home location data such as charger density
• Mixed-effects model shows technology affinity is strongest predictor
• Similarly green party preferences and home ownership increase adop- tion probability
• No significant effects from home locations’ population or charging sta- tion density
1
This is a pre-print of an accepted version. Differences from the later published version
are all errors from Gracia Br¨ uckmann, who serves as the corresponding author. Feel free
to contact my via email, if you spot mistakes in this version.
Battery Electric Vehicle adoption in regions without strong policies
Gracia Br¨ uckmann
a,b,∗, Fabian Willibald
a,c, Victor Blanco
a,ca
Institute of Science, Technology and Policy (ISTP), ETH Zurich, Universit¨ atstrasse 41, Zurich 8092, Switzerland, bgracia@ethz.ch
b
Center for Comparative and International Studies (CIS), ETH Zurich, Haldeneggsteig 4, Zurich 8092, Switzerland
c
Planning of Landscape and Urban Systems, Institute for Spatial and Landscape Planning, ETH Zurich, Haldeneggsteig 4, Zurich 8092, Switzerland
Abstract
Individual motorized transport is a major source of emissions and needs to be reduced to meet international agreements. Although alternatives to internal combustion engine vehicles are already on the market without extensive po- litical support, electric vehicle (EV) adoption remains low. Understanding the drivers of adoption of alternative technologies is key to develop effec- tive measures to accelerate their diffusion. This paper presents individual consumer characteristics and home-location based spatial characteristics of current battery electric vehicle (BEV) and internal combustion engine ve- hicle holders, in a region free from strong EV policies. Using a generalized linear mixed-effects logistic model on this revealed preference data, we find that BEV adoption is predicted by technology affinity, high income, green party preferences, and living in one’s own house. Altogether, the study offers
∗
Corresponding author
E-mail address: gracia.brueckmann@istp.ethz.ch
insights on the characteristics of early adopters of BEVs that can be valuable to policymakers, energy grid and charging infrastructure operators, as well as the automotive industry.
Keywords: Plug-in electric vehicle, Revealed preferences, Individual adopters’ characteristics, Consumer demand, Early adopter, Battery electric vehicle market
1. Introduction
Decarbonisation has become one of the major global challenges of our time (Rogelj et al., 2015; Schellnhuber et al., 2016; Rockstr¨ om et al., 2017). As of December 2015, 195 countries who ratified the United Nations Framework Convention on Climate Change have agreed to limit anthropogenic global warming to 1.5-2 ° C (UNFCCC, 2015). Transportation is a leading carbon contributor worldwide (Abergel et al., 2017) that could reduce its emissions through electrification (Pietzcker et al., 2014). As the generation of electric- ity increasingly moves towards renewable energy sources, high adoption rates of battery electric vehicles (BEVs) can be pivotal in reducing these emissions (Ajanovic and Haas, 2016).
Globally, electric vehicle (EV) adoption is currently highly dependent on
strong (demand-side orientated) EV policies (Sierzchula et al., 2014; L´ evay
et al., 2017; M¨ unzel et al., 2019). These strong policies include a wide spec-
trum from road space privileges (bus or HOV lanes), preferential parking and
charging options, free use of ferries for BEV drivers, tax reductions to feebate
2systems, financial purchase subsidies and exemptions, and exemptions from license plate lotteries (Wolbertus et al., 2018; Hardman et al., 2018; Hard- man, 2019; Zhuge and Shao, 2019; Br¨ uckmann and Bernauer, 2020). Most previous studies on EV adoption also take place in areas with strong policies encouraging EV adoption in place (e.g. California, Canada, China, Germany, Norway). Some of these areas are also home to EV producing firms (e.g.
California, China, Germany), which is another factor previously identified as increasing EV adoption (Sierzchula et al., 2014). However, in the European Union and Switzerland the target maximum emissions of 95 g CO
2/km for newly registered car fleets by 2021, is currently far out of reach. Electrifica- tion of vehicles is especially low where EV policies are lacking. Therefore, this paper uncovers factors affecting BEV uptake in an area without strong EV policies. Previous studies on EV adoption have mostly used stated-preference (SP) surveys to characterize potential EV uptake (e.g. Egbue and Long, 2012;
Carley et al., 2013; Bailey et al., 2015; Noppers et al., 2015; Lane et al., 2018;
Patt et al., 2019; Simsekoglu and Nayum, 2019). Only a few studies have used revealed preference (RP) approaches based on actual car registrations or ownership. While decisions in SP and RP studies are likely to be deter- mined by similar underlying factors, their ability to predict actual adoption is likely to differ substantially (Schuitema et al., 2013), because SP studies
2
A feebate system is a combination of fees and rebates, therefore, in this case, reducing
the costs of EVs and increasing the costs of highly emitting cars.
are usually biased due to gaps between preferences and actual behaviour.
Consequently, RP studies are often favoured by economists and policymak- ers (Carlsson, 2010).
The energy efficiency of battery electric vehicles (BEVs) is higher than that of other EVs (Helmers and Marx, 2012), and their battery capacity is greater, leading to potentially greater implications for electricity grids when recharged at peak hours and peak locations (Brenna et al., 2012; Schey et al., 2012; Jakobsson et al., 2016; Hardman et al., 2018; Moon et al., 2018; Wolber- tus et al., 2018). Furthermore, with rising EV demand, it will be important to understand the spatial patterns of EV adoption to minimize the risks asso- ciated with spatial accumulation of EV drivers and EV-related peak energy demand Nicolson et al. (2017), such as transmission congestion (Hu et al., 2017), and important voltage drops (Hoogsteen et al., 2015).
Therefore, this study looks into the individual and spatial characteris-
tics determining BEV adoption in a setting free from strong EV policies or
manufacturer presence, using unique RP data. B¨ uhler et al. (2014) note
that EV uptake depends on consumer perceptions. Hence, we empirically
analyse private car adoption to examine consumer preferences. Combining
unique survey data with the spatial characteristics of the car holders’ area of
residence in a logit choice model allows us to explore individual and spatial
factors that explain EV adoption behaviour. We refer to actual purchases
as ‘unforced adoption’, as did Rezvani et al. (2015), in contrast to results from ‘forced-choice’ stated-preference methods such as choice experiments, to address the demand for “studies using representative samples and not only focusing on intention to adopt, but actual (‘unforced’) adoption” (Rezvani et al., 2015, p.133) of EVs. Therefore, this paper uses data from a mixed- mode survey of both, holders of officially registered internal combustion en- gine vehicles (ICEV) and BEVs. Furthermore, this study allows to assess whether the lessons learned from adopters of other kinds of EVs can also be transferred to BEV adoption. We study this in Switzerland, a country ab- sent from strong EV policies. While other countries, such as Australia (Webb et al., 2019), also have no strong EV policies, we opted for a country without manufacturer presence to minimise contamination. Lastly, many other areas feature large proportions of home-owners, who are more likely to adopt EVs (Bailey et al., 2015; Axsen et al., 2016; Javid and Nejat, 2017; Nazari et al., 2018), while homeownership is rather uncommon in our chosen area of study.
Our identification of both the individual characteristics and the spatial
characteristics affecting the distribution of BEVs can be of interest to elec-
tricity providers and automotive manufacturers, as well as regional planning
authorities and policymakers. In the following sections, we review the lit-
erature on EV uptake studies to formulate hypotheses and guide variable
selection. We then briefly introduce the methods used and describe the re-
sults obtained before discussing our findings.
2. Literature review and hypotheses
Most studies on EV adoption are based on hypothetical vehicle choices to assess consumers’ attitudes towards buying an EV (e.g. Bailey et al., 2015;
Junquera et al., 2016; Bennett and Vijaygopal, 2018; Priessner et al., 2018).
In contrast, only very few studies (e.g. Axsen et al., 2016; Javid and Nejat, 2017) investigate the characteristics of actual EV holders compared to those of ICEV holders. Some studies analyse characteristics of owners of different kinds of EVs jointly, without differentiating between them (Higgins et al., 2012; Axsen et al., 2015, 2016). A common focus is plug-in electric vehi- cles (PEVs), a category that includes both BEVs and plug-in hybrid electric vehicles. However, it is important to distinguish between different types of electric cars since their technologies differ (Lane et al., 2018; Almeida Neves et al., 2019). For instance, for plug-in hybrids, the range-anxiety associated with BEVs is absent (Lane et al., 2018).
Previous studies suggest that EV adoption can be linked to technologies,
consumer characteristics, and context (Sierzchula et al., 2014). An overview
of previous studies can be found in Liao et al. (2017); Javid and Nejat (2017)
and Li et al. (2017b). Besides consumer characteristics, the context con-
sists of population density, charging infrastructure, policies, energy mix, and
electricity/gas prices (Sierzchula et al., 2014; Axsen et al., 2016; Priessner
et al., 2018; Almeida Neves et al., 2019; Li et al., 2017c). We focus our lit-
erature review on scholarly debates in the areas of consumer characteristics
and contextual criteria that vary within our regional scope (e.g., energy mix or gas price do not vary within a small, single market such as Switzerland).
Besides these factors, we acknowledge the critical link between EV adoption and critical consumption (Yates, 2011), politics of purchasing ( ¨ Ozt¨ urk et al., 2019), ethical consumption, and political consumerism (Micheletti, 2010), which point in the same direction regarding consumer characteristics.
2.1. Consumer characteristics
Studies on EV uptake, as well as on buycotts, a movement of political
consumerism and ethical consumption (Stolle et al., 2005; Jacobsen and Dul-
srud, 2007; Hoffmann et al., 2018), found several socio-demographic factors
to increase uptake probabilities. Many RP studies on PEVs (Axsen and Ku-
rani, 2013; Tal et al., 2014; Axsen et al., 2016; Nazari et al., 2018; Lee et al.,
2019), SP studies on BEVs (Hidrue et al., 2011; Pl¨ otz et al., 2014; Zhuge and
Shao, 2019), as well as most notable RP studies on BEVs (Almeida Neves
et al., 2019), have found higher income and higher education to increase the
likelihood of EV adoption. However, in two RP PEV-studies at the national
level, educational achievements and income were found to be insignificant
(Sierzchula et al., 2014; Li et al., 2017b). Bernards et al. (2018) found a
strong effect of income that levels off as it increases. Moreover, some SP
studies have found income to be insignificant or less important for BEVs
(Hidrue et al., 2011) and PEVs (Carley et al., 2013; Bailey et al., 2015)
, which is understandable, as in SP studies no (expensive) purchases are
made. Altogether, given the higher predictive power of RP studies compared to SP ones, and our focus on BEVs, we formulate the following hypothesis:
H1: Unforced early adoption of BEVs is associated with both higher ed- ucational attainment and income.
Manski and Sherman (1980) claim that household size matters for ve-
hicle selection (through the number of seats and trunk size). This was also
found for PEVs (Javid and Nejat, 2017; Bernards et al., 2018; Priessner et al.,
2018). Since there are still fewer combinations of seat-numbers (Zhang et al.,
2016) and trunk sizes available on the market for BEVs, compared to con-
ventional vehicles, household size may affect the choice for purchasing BEVs
(Pl¨ otz et al., 2014; Almeida Neves et al., 2019; Lee et al., 2019). More cars
in the household make EVs more acceptable (Tamor et al., 2015; Jakobsson
et al., 2016; Karlsson, 2017) as an ICEV can overcome range anxiety and
long recharging times. In RP studies (on PEVs) findings are mixed: while
it matters in Canada (Axsen et al., 2016), this is not the case in the US
(Javid and Nejat, 2017; Nazari et al., 2018). Car sharing usage, especially
the usage of electric car sharing, was found to be positively influencing the
perceived usefulness of EVs (Schl¨ uter and Weyer, 2019),, notably in an RP
study (Javid and Nejat, 2017). Focusing on the studies closest to our setting
(RP on BEV uptake), we formulate the following hypothesis:
H2: BEV adoption is positively associated with both multi-car house- hold as well as usage of car sharing.
Similarly, owning a complete public transport (local trains, trams, ferries and busses as well as long-distance trains) subscription is linked to more open- ness towards new mobility tools (Guidon et al., 2019; Meyer de Freitas et al., 2019) and may play an analogous role in BEV adoption decisions. Lastly, some RP studies (Javid and Nejat, 2017; Nazari et al., 2018; Thøgersen and Ebsen, 2019) show that people in smaller households are more likely to adopt an EV. In SP studies (with some RP cases from European countries) there are result in the same direction (Priessner et al., 2018) as well as the oppo- site direction, that mainly families adopt BEVs (Pl¨ otz et al., 2014). As these factors are not overall clear, we abstain from making hypotheses about them.
Another variable associated with socio-economic status is homeowner-
ship, especially of single-family detached houses. Its effect on EV adoption
is found positive in all studies reviewed (e.g. Axsen et al., 2016; Bailey et al.,
2015; Nazari et al., 2018), except for one recent RP study on PEVs in Cali-
fornia (Javid and Nejat, 2017). In places with a high proportion of tenants,
e.g. Switzerland where 59% of households live in a rented flat/apartment
and only 27.3% live in single-family homes (BFS, 2019), BEV readiness may
also be affected by the increased transaction costs for installing recharging
facilities in rented dwellings.
H3: Owner-occupied houses are the most likely homes of BEV holders.
Most studies have shown environmental attitudes to matter for BEV support in SP studies (?Noppers et al., 2015), as well as for actual PEV adoption (Axsen et al., 2016) and intent (Carley et al., 2013; Schuitema et al., 2013;
Priessner et al., 2018). Still, further research on consumers’ environmental consciousness continues to be encouraged (Almeida Neves et al., 2019). Sim- ilarly, previous studies found the interest in using new technologies to be strongly linked to EV uptake (Egbue and Long, 2012; Long et al., 2019).
Technological enthusiasm is correlated with intentions for PEV adoption (Pl¨ otz et al., 2014; Smith et al., 2017) as well as actual BEV adoption (Lane et al., 2018). Apart from these, we also consider party preferences. We go beyond Sintov et al. (2020) who study only potential early adopters and their adoption intention, Kahn (2007), who studied registered Green Party voters and hybrid electric vehicle owners, and Sovacool et al. (2018) who studied Nordic countries and only used party groups (“main categories”) (p. 221).
We expect that representation through Switzerland’s Green (GPS) or Green Liberal (GLP) party is likely to be positively associated with BEV uptake.
H4: BEV uptake probability is positively linked to environmentalism,
technology affinity and green party preferences.
2.2. Spatial characteristics
(Electric) vehicle travel patterns and the link towards the built environ- ment are on the research agenda of many scholars (Higgins et al., 2012; Li et al., 2017b). Although the EC (2014) understands BEVs as a phenomenon of high-density areas, the empirical evidence is mixed. Rather small effects of density were found on PEV adoption in California (Javid and Nejat, 2017) and insignificant effects on intentions for PEV uptake in Austria (Priessner et al., 2018). Also, while Pl¨ otz et al. (2014) showed that BEVs are most likely to be found in smaller settlements, i.e. in rural areas or suburbs, studies on a country level (International Energy Agency, 2017; Li et al., 2017b) found support for the statement of the EC. Therefore, univocal clarification on this topic is imperative (Bernards et al., 2018).
H5: BEV adoption is linked to population density.
Sperling and Kitamura (1986) acknowledged the need for refuelling infras-
tructure for the deployment of new transportation possibilities. This is shown
to be especially important in the purchase decision of vehicles running on al-
ternative fuels (Dagsvik et al., 2002). Nowadays, public (fast) chargers are an
important part in making BEVs more attractive for future users (Neaimeha
et al., 2017). A significant positive correlation between BEV sales data and
public charging infrastructure was found recently (Zhang et al., 2016). In
two revealed preference studies in the US, Li et al. (2017a) find that more
chargers are related to more PEVs, and the effect of charging infrastructure is found to be much higher for BEVs than for PHEVs (Narassimhan and Johnson, 2018). Multiple cross-country RP studies (e.g. Li et al., 2017b), RP studies on PEVs (Javid and Nejat, 2017; Nazari et al., 2018), as well as in SP studies (Achtnicht et al., 2012; Egbue and Long, 2012; Carley et al., 2013; Hackbarth and Madlener, 2013; Bailey et al., 2015) find that public charging stations are the drivers of electric mobility. In contrast, Bailey et al. (2015) conclude that the relationship between the availability of out- of-home charging facilities and the uptake of EVs is not yet fully understood, which, for now, remains true for actual adoption (RP) of BEVs and small- scale spatial resolutions. To close this gap, we investigate the last hypothesis:
H6: Public charging infrastructure availability is positively related to BEV adoption.
3. Data and Methods
This paper uses unique RP data from official sources on the adoption of
BEVs. The sample consists of BEV holders as well as holders of conventional
cars with internal combustion engines. We apply a Generalized Linear Mixed-
Effects Model for regression analysis of BEV adoption. In the next sections,
we describe the case selection, data collection and empirical (mixed-effects
logit model) approach.
3.1. Case Selection
Within the framework of the Paris agreement, Switzerland has set a goal to reduce greenhouse gas emissions by 50% until 2030 and by 75% to 80%
until 2050 (compared to 1990 levels) (Burkhardt, 2016). Transportation ac- counts for 32% of the overall carbon (CO2) emissions in Switzerland (FOEN, 2017). Switzerland has a high potential to reduce transportation emissions through the diffusion of BEVs, as it already has a high share of renewable energies and plans on substituting all non-renewable energy sources by 2050 SFOE (2018).
To attain the emissions targets, the electrification of the passenger trans- portation sector (Pietzcker et al., 2014) has been recognized as a political goal and challenge in the countries affected, such as Switzerland (FEDRO, 2016). The goal of 95 g CO
2/km fleet emissions by 2021 seems out of reach and would need widespread EV adoption for its achievement (SFOE, 2017).
Therefore, many countries have applied strong demand-side policies, such
as purchase premia of around 4000 € in Germany and the UK (4000 £ ) or
substantial tax reductions as in Ireland or Norway (Yan, 2018). In Switzer-
land, strong policies that support EV adoption are not yet enacted. The
absence of policy-induced influences and manufacturers make Switzerland a
relevant case study to understand the individual and spatial determinants of
EV adoption without confounding policy effects, and allows implications for
many countries worldwide.
Despite factors that are typically related to high EV uptake, such as a high GDP/capita (IMF, 2018) and an environmentally friendly population (Franzen and Vogl, 2013), EV sales in Switzerland remain low, accounting for only 1.7% of new registrations in 2018 (SFOE, 2019). Therefore, the question as to why a low uptake of EVs persists is puzzling. As Switzerland’s policy- makers and the private sector unite their efforts to promote EVs (DETEC and Communications, 2018), understanding current uptake patterns can assist the design of adequate policies, also to minimize spatial accumulation and associated risks (Nicolson et al., 2017), e.g. transmission congestion (Hu et al., 2017) and voltage drops (Hoogsteen et al., 2015).
3.2. Survey
We use data from the survey of Br¨ uckmann and Bernauer (2020). Their survey population is a random sample of car holders registered in the German- speaking Swiss Cantons Aargau, Schwyz, Zug, and Zurich as well as all (that is to say, a census or a random sample with inclusion probability of p = 1) BEV holders in the same Swiss Cantons. The intentional oversampling of BEV holders is due to their sparse representation in the overall car holding population as of the time of data collection (2018). In Switzerland, each Can- ton has a car registry and car registration with the car registry is mandatory.
In each study canton, 5000 car holders that had no BEV, but an ICEV
3, reg-
3
The ICEV holder dataset includes all persons that have a car with internal combustion
engine or possibly (some) electrification, e.g. (plug-in) hybrids, registered – i.e., all car
istered were randomly selected by the car registries and their postal address was delivered to Br¨ uckmann and Bernauer (2020). Additionally, the same address information on all BEV holders at that time was transferred. Both groups of car holders were invited by postal mail to take part in a mixed- mode (online and pen-and-paper) survey. In total, 22’627 survey invitations were sent to the postal addresses provided by official sources (cantonal car registries). These cantons were selected as they include Switzerland’s largest city, the canton with the largest population (Zurich), as well as suburban and rural areas encompassing various topologies, and allowing for a survey in only one language (German). While the cantons do have slightly differ- ent vehicle taxes
4(to encourage the use of energy-efficient cars) there were no substantial incentive policies in place in any canton at the time of the study. The mixed-mode survey could be completed online or on print (pen- and-paper). The data-collection started in May 2018 and ended in October 2018. There were 5325 responses obtained, and a minimum response rate (AAPOR, 2016) of 23.5% was reached. For a detailed survey, we refer to Br¨ uckmann and Bernauer (2020), including the questionnaire in their Sup- plementary Information.
holders but those with a battery electric vehicle.
4
In the Supplementary Information SI2 of Br¨ uckmann and Bernauer (2020) this is
outlined in more detail.
3.3. Spatial Data
The survey data was complemented with data on the spatial character- istics of respondents’ residential zip codes. In contrast to municipality data, zip (postal) code areas are finer-grained in urban areas and coarser in rural areas. Multiple spatial characteristics were initially considered, but only pop- ulation density and availability of charging stations were kept after checking for collinearity. Spatial data was merged with the individual survey data by the respondents’ zip codes. Data on spatial variables, especially popula- tion density, was collected from the cantonal statistical offices, and charging infrastructure data was provided by a private company (lemnet.org).
3.4. Model
In our study, we predict the binary outcome of individuals’ BEV-ownership (denoted with 1) or no BEV-ownership (denoted with 0) from a set of ex- planatory variables. These explanatory variables are data on individuals, nested within their residential ZIP-code areas and cantons. This is referred to as “clustered survey data” (Maimon and Kuhl, 2008), and it is organ- ised in a hierarchical data structure (Cameron and Trivedi, 2005). We have within effects
5that occur at level 1, the individual level, and we have be- tween effects or context effects that occur at the level 2 (Howard, 2015) and additionally on level 3 (Rodr´ıguez and Goldman, 2001). Level 2 in our con-
5
Note, we use the term “effect” e.g. in the phrase “within effect”, “between effect”,
“random effect” and “fixed effect” without them implying the existence of causal effects.
text is ZIP code and Level 3 is cantonal. We perform a mixed-effects model with canton fixed effects and ZIP code random effects.
logit(π
ijk) = β
0+ β
1x
ijk+ β
2x
k+ u
jk(1)
Here, x
ijk, x
jkand x
krepresent (vectors of) observed characteristics at the individual, ZIP code area and cantonal levels, with corresponding fixed effects β
1and β
2and β
3. For example, there is an individual level invariant level 2 independent variable, such as population density by ZIP code, with its corresponding fixed effects. For the third level, by definition, variables only have “between effects” – level 3 variables (here: canton) cannot have within effects, as there is no variation within higher-level entities (Bell et al., 2019).
U
kis an unobserved random effect for ZIP code areas attached to the inter- cept, specifying heterogeneity at level 2 and can be important to avoid biases, particularly in standard errors. We assume them to be normally distributed.
We opted for a mixed-effects model, as fixed effects for level-2 entities would be unreliable with small level-2 entities (Bell et al., 2019). For a comparison with different models, see the Appendix A 1.
All estimation was done in R R Core Team (2018) using the packages
lme4 (Bates et al., 2015), lrtest (Zeileis and Hothorn, 2002) , margins (Leeper
et al., 2018), pROC (Robin et al., 2011), and pscl (Jackman, 2020).
3.5. Variable Selection
For the variable choice, we first used the information from our litera- ture review. We started with a broad set of spatial variables, namely pop- ulation density, the share of built-up area per municipality, the share of single-family houses per municipality, job/population accessibility (based on Hansen (1959)), municipality type (based on FSO (2017)) and availability of charging stations. We then checked for multicollinearity in the data through the application of variance inflation factors (Fox and Monette, 1992). As mul- ticollinearity was found for most of the spatial characteristics, we dropped all variables except for population density and availability of charging stations, which are also most prominent in previous literature. Population density and charging stations are only slightly correlated (correlation coefficient r
= 0.52). To choose which variables to drop we used different sets of vari- ables for our regression and estimated model fit using likelihood ratio tests (Korner-Nievergelt et al., 2015) as well as AIC (Sakamoto et al., 1986). Af- ter checking for multicollinearity, we chose the set of variables for our model that provided the lowest AIC and that allowed straight forward interpreta- tion. We also tried interactions between the variables as well as non-linear terms (squared) but this did not improve the model fit.
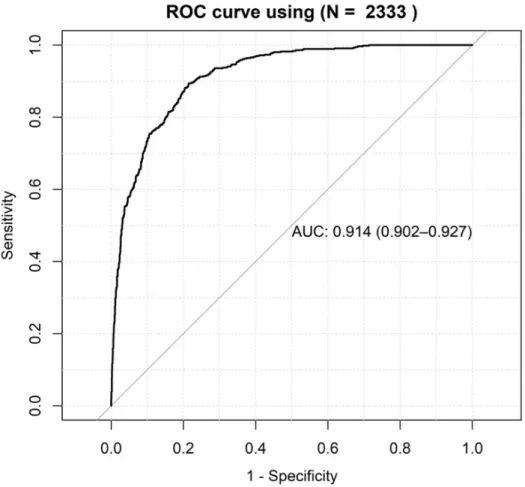
To estimate the overall fit of our model we used the ROC curve as a vi-
sual performance indicator. First, we estimated the overall fit of our model
using the Receiver operating characteristic (ROC) curve and area under the
curve (AUC). A ROC curve illustrates the performance of a binary regression with discrete output and shows the specificity (the proportion of correctly classified negative observations) and sensitivity (the proportion of correctly classified positive observations) as the output threshold is moved over the range of all possible values. In simple terms, it plots the “false alarm” rate versus the “hit rate”. ROC curves do not depend on class probabilities, which allows for interpretation and comparison across different data sets. A higher AUC means a better classification (Robin et al., 2011, p.1).
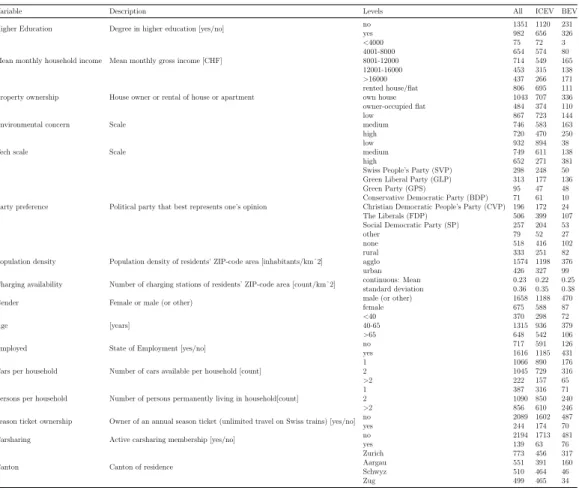
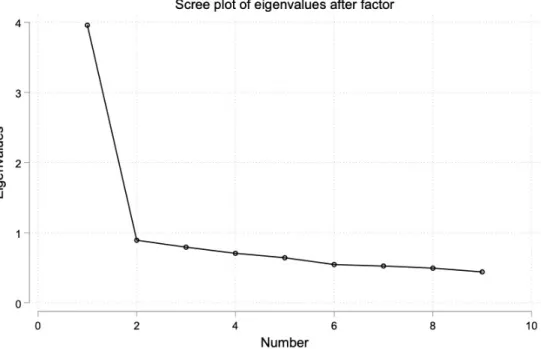
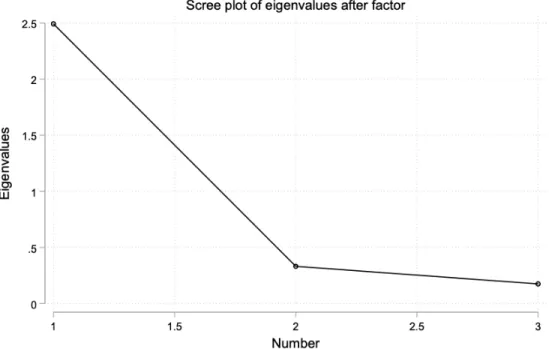
Once multicollinearity was addressed (see above), we selected 17 vari- ables that are expected to influence BEV adoption, which is our dependent variable. The respondents’ education is reflected in ‘Higher Education’, a dummy reflecting attained tertiary education. Mean monthly household in- come is the household’s average gross monthly income (see Table 1 for de- tails). The variable ‘Property ownership’ reflects the three possibilities that the household members own the house they live in, live in an owner-occupied flat, or live in a rented home. ‘Environmental concern’ stems from a five- point Likert-scale, that is factorised using principal component analysis as described in Appendix A2, summarizing the respondent’s environmental con- cern (Diekmann and Meyer, 2009), which is then classified into three groups, based on the alpha-score value tercentiles. Similarly, there is the ‘Tech Scale’
referring to technology interest (Bauer et al., 2005) and also measured on
a five-point Likert-scale. Both attitudinal scales are shown and the factor
analysis is described in the Appendix A2. ‘Party preference’ refers to the (Swiss) political party the respondent best feels represented by. The base category is the Swiss People’s Party
6, the party with the largest share in the Swiss parliament, considered as a far-right party. ‘Population density’ refers to the population density in the respondent’s zip code, as indicated by the address we received from the car registries, coded following Eurostat (2019) Degree of Urbanization. ‘Charging availability’ refers to the number of EV recharging facilities per 1000 inhabitants within their zip code area. The respondents’ ‘gender’, as indicated by the survey respondents, was coded as a Boolean (dummy) variable (1 = female, 0 = men and people who opted for a gender other than male or female). ‘Age’ was sorted into three groups and the variable employed reflects whether a respondent is working or unem- ployed. ‘Cars per household’ is the number of vehicles permanently available to the household including cars, minivans, SUVs, and business cars. ‘Per- sons per household’ refers to the sum of all people including the respondent and under-aged persons living in the household. ‘Season ticket ownership’
is a dummy for owning a complete public transport subscription
7(1 = yes), similar to ‘Carsharing’ for membership in a carsharing program. Lastly, all observations fall into one of four ‘Cantons’, depending on their residency.
6
We coded rare party mentions (below 50) together with the option “other”. They were Evangelical People’s Party (EVP), Federal Democratic Union (EDU), Party of Labour (PdA). We checked it, and this did not affect substantially any of the results shown here.
7
The Swiss public transport network offers subscriptions for both local public transport
and all national railways and busses. This is commonly referred to as “Generalabonement
(GA)”.
Table 1: Summary of explanatory variables
Variable Description Levels All ICEV BEV
Higher Education Degree in higher education [yes/no] no 1351 1120 231
yes 982 656 326
Mean monthly household income Mean monthly gross income [CHF]
<4000 75 72 3
4001-8000 654 574 80
8001-12000 714 549 165
12001-16000 453 315 138
>16000 437 266 171
Property ownership House owner or rental of house or apartment
rented house/flat 806 695 111
own house 1043 707 336
owner-occupied flat 484 374 110
Environmental concern Scale
low 867 723 144
medium 746 583 163
high 720 470 250
Tech scale Scale
low 932 894 38
medium 749 611 138
high 652 271 381
Party preference Political party that best represents one’s opinion
Swiss People’s Party (SVP) 298 248 50
Green Liberal Party (GLP) 313 177 136
Green Party (GPS) 95 47 48
Conservative Democratic Party (BDP) 71 61 10 Christian Democratic People’s Party (CVP) 196 172 24
The Liberals (FDP) 506 399 107
Social Democratic Party (SP) 257 204 53
other 79 52 27
none 518 416 102
Population density Population density of residents’ ZIP-code area [inhabitants/kmˆ2]
rural 333 251 82
agglo 1574 1198 376
urban 426 327 99
Charging availability Number of charging stations of residents’ ZIP-code area [count/kmˆ2] continuous: Mean 0.23 0.22 0.25
standard deviation 0.36 0.35 0.38
Gender Female or male (or other) male (or other) 1658 1188 470
female 675 588 87
Age [years]
<40 370 298 72
40-65 1315 936 379
>65 648 542 106
Employed State of Employment [yes/no] no 717 591 126
yes 1616 1185 431
Cars per household Number of cars available per household [count]
1 1066 890 176
2 1045 729 316
>2 222 157 65
Persons per household Number of persons permanently living in household[count]
1 387 316 71
2 1090 850 240
>2 856 610 246
Season ticket ownership Owner of an annual season ticket (unlimited travel on Swiss trains) [yes/no] no 2089 1602 487
yes 244 174 70
Carsharing Active carsharing membership [yes/no] no 2194 1713 481
yes 139 63 76
Canton Canton of residence
Zurich 773 456 317
Aargau 551 391 160
Schwyz 510 464 46
Zug 499 465 34
4. Results
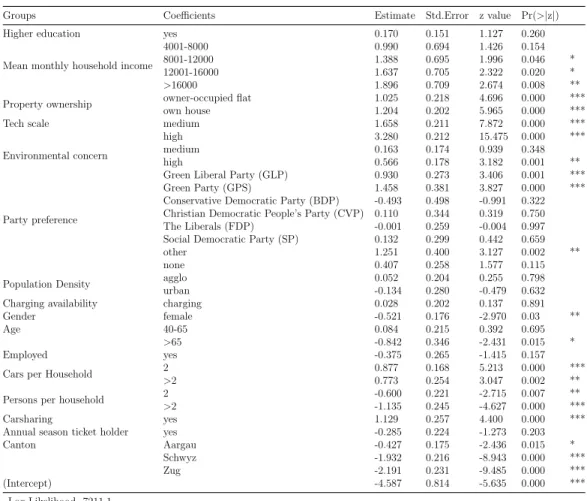
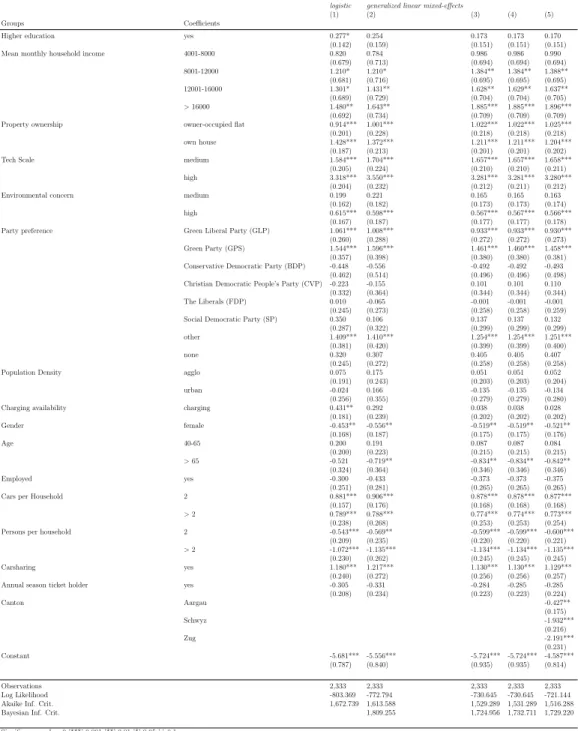
4.1. Regression results
The regression results are summarized in Table 2. For the regression, only complete cases were retained, which reduces the dataset to 2333 observations which fall into 424 ZIP codes. There is a total of 557 BEV holders and 1776 ICEV holders.
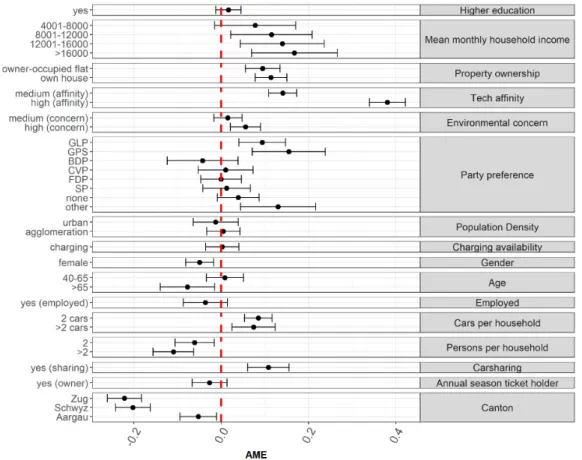
In Fig. 1, we present the predicted probabilities for our different groups of variables, using average marginal effects. A baseline category is always omitted for discrete variables.
4.1.1. Consumer characteristics
There is a positive effect of higher education on BEV adoption but the effect is not statistically significant. Therefore, we cannot reject the first part of the null for H1 (i.e. that unforced early adoption of BEVs is not associated with higher educational attainment). The average marginal effect of higher education on BEV adoption is around 1.7%. The mixed-effects logit model shows significant positive effects for the higher income groups. The average marginal effects plot for household income show that a higher income group is always associated with higher probabilities of BEV adoption. Overall, we acknowledge evidence in favour of our first hypothesis:
H1: Unforced early adoption of BEVs is associated with both higher ed-
ucational attainment and income.
Table 2: Summary of Generalized linear mixed model results
Groups Coefficients Estimate Std.Error z value Pr(>|z|)
Higher education yes 0.170 0.151 1.127 0.260
Mean monthly household income
4001-8000 0.990 0.694 1.426 0.154
8001-12000 1.388 0.695 1.996 0.046 *
12001-16000 1.637 0.705 2.322 0.020 *
>16000 1.896 0.709 2.674 0.008 **
Property ownership owner-occupied flat 1.025 0.218 4.696 0.000 ***
own house 1.204 0.202 5.965 0.000 ***
Tech scale medium 1.658 0.211 7.872 0.000 ***
high 3.280 0.212 15.475 0.000 ***
Environmental concern medium 0.163 0.174 0.939 0.348
high 0.566 0.178 3.182 0.001 **
Party preference
Green Liberal Party (GLP) 0.930 0.273 3.406 0.001 ***
Green Party (GPS) 1.458 0.381 3.827 0.000 ***
Conservative Democratic Party (BDP) -0.493 0.498 -0.991 0.322 Christian Democratic People’s Party (CVP) 0.110 0.344 0.319 0.750
The Liberals (FDP) -0.001 0.259 -0.004 0.997
Social Democratic Party (SP) 0.132 0.299 0.442 0.659
other 1.251 0.400 3.127 0.002 **
none 0.407 0.258 1.577 0.115
Population Density agglo 0.052 0.204 0.255 0.798
urban -0.134 0.280 -0.479 0.632
Charging availability charging 0.028 0.202 0.137 0.891
Gender female -0.521 0.176 -2.970 0.03 **
Age 40-65 0.084 0.215 0.392 0.695
>65 -0.842 0.346 -2.431 0.015 *
Employed yes -0.375 0.265 -1.415 0.157
Cars per Household 2 0.877 0.168 5.213 0.000 ***
>2 0.773 0.254 3.047 0.002 **
Persons per household 2 -0.600 0.221 -2.715 0.007 **
>2 -1.135 0.245 -4.627 0.000 ***
Carsharing yes 1.129 0.257 4.400 0.000 ***
Annual season ticket holder yes -0.285 0.224 -1.273 0.203
Canton Aargau -0.427 0.175 -2.436 0.015 *
Schwyz -1.932 0.216 -8.943 0.000 ***
Zug -2.191 0.231 -9.485 0.000 ***
(Intercept) -4.587 0.814 -5.635 0.000 ***
Log Likelihood -7211.1 Akaike Inf. Crit. 1516.3 Bayesian Inf. Crit. 1729.2
Significance codes: 0 ‘***’ 0.001 ‘**’ 0.01 ‘*’ 0.05 ‘.’ 0.1