GI-Edition
Lecture Notes in Informatics
Norbert Ritter, Andreas Henrich, Wolfgang Lehner, Andreas Thor,
Steffen Friedrich, Wolfram Wingerath (Hrsg.)
Datenbanksysteme für Business, Technologie und Web (BTW 2015) – Workshopband
02. – 03. März 2015 Hamburg
Proceedings
242
Norber t Ritter , Andr eas Henr ic h, W olfgang Lehner , Andr eas Thor , Stef fen F riedr ic h, W olfr am W ing er ath (Hr sg.): BTW 2015 – W or kshopband
Norbert Ritter, Andreas Henrich,
Wolfgang Lehner, Andreas Thor, Steffen Friedrich, Wolfram Wingerath (Hrsg.)
Datenbanksysteme für Business, Technologie und Web
(BTW 2015)
Workshopband 02. – 03.03.2015 in Hamburg, Germany
Gesellschaft für Informatik e.V. (GI)
Lecture Notes in Informatics (LNI) - Proceedings Series of the Gesellschaft für Informatik (GI) Volume P-242
ISBN 978-3-88579-636-7 ISSN 1617-5468
Volume Editors Norbert Ritter
Universität Hamburg Fachbereich Informatik
Datenbanken und Informationssysteme 22527 Hamburg, Germany
E-Mail: ritter@informatik.uni-hamburg.de Andreas Henrich
Otto-Friedrich-Universität Bamberg
Fakultät Wirtschaftsinformatik und Angewandte Informatik Lehrstuhl für Medieninformatik
96047 Bamberg, Germany
E-Mail: andreas.henrich@uni-bamberg.de Wolfgang Lehner
Technische Universität Dresden Fakultät Informatik
Institut für Systemarchitektur 01062 Dresden, Germany
Email: wolfgang.lehner@tu-dresden.de Andreas Thor
Deutsche Telekom Hochschule für Telekommunikation Leipzig Gustav-Freytag-Str. 43-45
04277 Leipzig, Germany E-Mail: thor@hft-leipzig.de Steffen Friedrich
Universität Hamburg Fachbereich Informatik
Datenbanken und Informationssysteme 22527 Hamburg, Germany
E-Mail: friedrich@informatik.uni-hamburg.de Wolfram Wingerath
Universität Hamburg Fachbereich Informatik
Datenbanken und Informationssysteme 22527 Hamburg, Germany
E-Mail: wingerath@informatik.uni-hamburg.de
Series Editorial Board
Heinrich C. Mayr, Alpen-Adria-Universität Klagenfurt, Austria (Chairman, mayr@ifit.uni-klu.ac.at)
Dieter Fellner, Technische Universität Darmstadt, Germany Ulrich Flegel, Hochschule für Technik, Stuttgart, Germany Ulrich Frank, Universität Duisburg-Essen, Germany
Johann-Christoph Freytag, Humboldt-Universität zu Berlin, Germany Michael Goedicke, Universität Duisburg-Essen, Germany
Ralf Hofestädt, Universität Bielefeld, Germany
Michael Koch, Universität der Bundeswehr München, Germany Axel Lehmann, Universität der Bundeswehr München, Germany Peter Sanders, Karlsruher Institut für Technologie (KIT), Germany Sigrid Schubert, Universität Siegen, Germany
Ingo Timm, Universität Trier, Germany
Karin Vosseberg, Hochschule Bremerhaven, Germany Maria Wimmer, Universität Koblenz-Landau, Germany Dissertations
Steffen Hölldobler, Technische Universität Dresden, Germany Seminars
Reinhard Wilhelm, Universität des Saarlandes, Germany Thematics
Andreas Oberweis, Karlsruher Institut für Technologie (KIT), Germany
Gesellschaft für Informatik, Bonn 201 5
printed by Köllen Druck+Verlag GmbH, Bonn
Vorwort
In den letzten Jahren hat es auf dem Gebiet des Datenmanagements große Verän- derungen gegeben. Dabei muss sich die Datenbankforschungsgemeinschaft ins- besondere den Herausforderungen von „Big Data“ stellen, welche die Analyse von riesigen Datenmengen unterschiedlicher Struktur mit kurzen Antwortzeiten im Fokus haben. Neben klassisch strukturierten Daten müssen moderne Daten- banksysteme und Anwendungen semistrukturierte, textuelle und andere multi- modale Daten sowie Datenströme in völlig neuen Größenordnungen verwalten.
Gleichzeitig müssen die Verarbeitungssysteme die Korrektheit und Konsistenz der Daten sicherstellen.
Die jüngsten Fortschritte bei Hardware und Rechnerarchitektur ermöglichen neu- artige Datenmanagementtechniken, die von neuen Index- und Anfrageverarbei- tungsparadigmen (In-Memory, SIMD, Multicore) bis zu neuartigen Speicher- techniken (Flash, Remote Memory) reichen. Diese Entwicklungen spiegeln sich in aktuell relevanten Themen wie Informationsextraktion, Informationsintegrati- on, Data Analytics, Web Data Management, Service-Oriented Architectures, Cloud Computing oder Virtualisierung wider.
Wie auf jeder BTW-Konferenz gruppieren sich um die Tagung eine Reihe von Workshops, die spezielle Themen in kleinen Gruppen aufgreifen und diskutieren.
Im Rahmen der BTW 2015 finden folgende Workshops statt:
• Databases in Biometrics, Forensics and Security Applications: DBforBFS
• Data Streams and Event Processing: DSEP
• Data Management for Science: DMS
Dabei fasst der letztgenannte Workshop DMS als Joint Workshop die beiden Initiativen Big Data in Science (BigDS) und Data Management for Life Sciences (DMforLS) zusammen.
Mit seinen Schwerpunkten reflektiert das Workshopprogramm aktuelle For- schungsgebiete von hoher praktischer Relevanz. Zusätzlich präsentieren Studen- ten im Rahmen des Studierendenprogramms die Ergebnisse ihrer aktuellen Ab- schlussarbeiten im Bereich Datenmanagement. Für jeden Geschmack sollte sich somit ein Betätigungsfeld finden lassen!
Die Materialien zur BTW 2015 werden auch über die Tagung hinaus unter
http://www.btw-2015.de zur Verfügung stehen.
Die Organisation einer so großen Tagung wie der BTW mit ihren angeschlosse- nen Veranstaltungen ist nicht ohne zahlreiche Partner und Unterstützer möglich.
Sie sind auf den folgenden Seiten aufgeführt. Ihnen gilt unser besonderer Dank ebenso wie den Sponsoren der Tagung und der GI-Geschäftsstelle.
Hamburg, Bamberg, Dresden, Leipzig, im Januar 2015
Norbert Ritter, Tagungsleitung und Vorsitzender des Organisationskomitees Andreas Henrich und Wolfgang Lehner, Leitung Workshopkomitee
Andreas Thor, Leitung Studierendenprogramm
Wolfram Wingerath, Steffen Friedrich, Tagungsband und Organisationskomitee
Tagungsleitung
Norbert Ritter, Universität Hamburg Organisationskomitee
Norbert Ritter
Anne Hansen-Awizen Steffen Friedrich Wolfram Wingerath
Felix Gessert Fabian Panse Volker Nötzold
Studierendenprogramm Andreas Thor, HfT Leipzig Koordination Workshops Andreas Henrich, Univ. Bamberg Wolfgang Lehner, TU Dresden Tutorienprogramm
Norbert Ritter, Univ. Hamburg Thomas Seidl, RWTH Aachen
Andreas Henrich, Univ. Bamberg Wolfgang Lehner, TU Dresden
Second Workshop on Databases in Biometrics, Forensics and Security Applications (DBforBFS)
Vorsitz: Jana Dittmann , Univ. Magdeburg; Veit Köppen, Univ. Magdeburg;
Gunter Saake, Univ. Magdeburg; Claus Vielhauer, FH Brandenburg Ruediger Grimm, Univ. Koblenz
Dominic Heutelbeck, FTK
Stefan Katzenbeisser, TU Darmstadt Claus-Peter Klas, GESIS
Günther Pernul, Univ. Regensburg
Ingo Schmitt, BTU Cottbus Claus Vielhauer, FH Brandenburg Sviatoslav Voloshynovskiy, UNIGE , CH Edgar R. Weippl, SBA Research , Austria
Data Streams and Event Processing (DSEP)
Vorsitz: Marco Grawunder, Univ. Oldenburg, Daniela Nicklas Univ. Bamberg Andreas Behrend, Univ. Bonn
Klemens Boehm, KIT Peter Fischer, Univ. Freiburg Dieter Gawlick, Oracle
Boris Koldehofe, TU Darmstadt Wolfgang Lehner, TU Dresden
Richard Lenz, Univ. Erlangen -Nürnberg Klaus Meyer-Wegener, Univ. Erlangen - Nürnberg
Gero Mühl, Univ. Rostock
Kai-Uwe Sattler, TU Ilmenau
Thorsten Schöler, HS Augsburg
Joint Workshop on Data Management for Science (DMS) Workshop on Big Data in Science (BigDS)
Vorsitz: Birgitta König-Ries, Univ. Jena; Erhard Rahm, Univ. Leipzig;
Bernhard Seeger, Univ. Marburg Alsayed Algergawy, Univ. Jena Peter Baumann, Jacobs Univ.
Matthias Bräger, CERN
Thomas Brinkhoff, FH Oldenburg Michael Diepenbroeck, AWI Christoph Freytag, HU Berlin Michael Gertz, Univ. Heidelberg Frank-Oliver Glöckner, MPI-MM Anton Güntsch, BGBM Berlin-Dahlem Thomas Heinis, IC, London
Thomas Hickler, Senckenberg
Jens Kattge, MPI für Biogeochemie Alfons Kemper, TU München Meike Klettke, Univ. Rostock Alex Markowetz, Uni v. Bonn Thomas Nauss, Univ. Marburg Jens Nieschulze, Univ. Göttingen Kai-Uwe Sattler, TU Ilmenau
Stefanie Scherzinger, OTH Regensburg Myro Spiliopoulou, Univ. Magdeburg Uta Störl, Hochschule Darmstadt
Workshop on Data Management for Life Sciences (DMforLS)
Vorsitz: Sebastian Dorok, Bayer Pharma AG; Matthias Lange, IPK Gatersleben;
Gunter Saake, Univ. Magdeburg Sebastian Breß, TU Dortmund Sebastian Dorok, Bayer Pharma AG Mourad Elloumi, UTM Tunisia Ralf Hofestädt, Univ. Bielefeld Andreas Keller, Saarland Univ.
Jacob Köhler, DOW AgroSciences Horstfried Läpple, Bayer HealthCare
Matthias Lange, IPK Gatersleben Ulf Leser, HU Berlin
Wolfgang Müller, HITS GmbH
Erhard Rahm, Univ. Leipzig
Gunter Saake, Univ. Magdeburg
Uwe Scholz, IPK Gatersleben
Can Türker, ETH Zürich
Inhaltsverzeichnis
Workshopprogramm
Second Workshop on Databases in Biometrics, Forensics and Secu- rity Applications (DBforBFS)
Jana Dittmann, Veit Köppen, Gunter Saake, Claus Vielhauer Second Workshop on Databases in Biometrics, Forensics and Security
Applications (DBforBFS)...19 Veit Köppen, Mario Hildebrandt, Martin Schäler
On Performance Optimization Potentials Regarding Data Classification in Forensics...21 Maik Schott, Claus Vielhauer, Christian Krätzer
Using Different Encryption Schemes for Secure Deletion While Supporting Queries...37
Data Streams and Event Processing (DSEP)
Marco Grawunder, Daniela Nicklas
Data Streams and Event Processing (DSEP)...49 Timo Michelsen, Michael Brand, H.-Jürgen Appelrath
Modulares Verteilungskonzept für Datenstrommanagementsysteme...51 Niko Pollner, Christian Steudtner, Klaus Meyer-Wegener
Placement-Safe Operator-Graph Changes in Distributed Heterogeneous
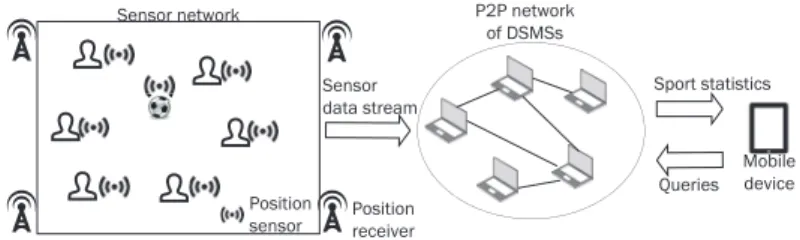
Data Stream Systems...61 Michael Brand, Tobias Brandt, Carsten Cordes, Marc Wilken, Timo Michelsen Herakles: A System for Sensor-Based Live Sport Analysis using Private
Peer-to-Peer Networks...71 Christian Kuka , Daniela Nicklas
Bestimmung von Datenunsicherheit in einem probabilistischen
Datenstrommanagementsystem...81 Cornelius A. Ludmann, Marco Grawunder, Timo Michelsen,
H.-Jürgen Appelrath
Kontinuierliche Evaluation von kollaborativen Recommender-Systeme in
Datenstrommanagementsystemen ...91 Sebastian Herbst, Johannes Tenschert, Klaus Meyer-Wegener
Using Data-Stream and Complex-Event Processing to Identify Activities of Bats ...93 Peter M. Fischer, Io Taxidou
Streaming Analysis of Information Diffusion...95
Henrik Surm, Daniela Nicklas
Towards a Framework for Sensor-based Research and Development Platform for
Critical, Socio-technical Systems...97 Felix Beier, Kai-Uwe Sattler, Christoph Dinh, Daniel Baumgarten
Dataflow Programming for Big Engineering Data...101
Joint Workshop on Data Management for Science (DMS)
Sebastian Dorok, Birgitta König-Ries, Matthias Lange, Erhard Rahm, Gunter Saake, Bernhard Seeger
Joint Workshop on Data Management for Science (DMS) ...105 Alexandr Uciteli, Toralf Kirsten
Ontology-based Retrieval of Scientific Data in LIFE ...109 Christian Colmsee, Jinbo Chen, Kerstin Schneider, Uwe Scholz, Matthias Lange Improving Search Results in Life Science by Recommendations based on
Semantic Information...115 Marc Schäfer, Johannes Schildgen, Stefan Deßloch
Sampling with Incremental MapReduce ...121 Andreas Heuer
METIS in PArADISE Provenance Management bei der Auswertung von
Sensordatenmengen für die Entwicklung von Assistenzsystemen ...131 Martin Scharm, Dagmar Waltemath
Extracting reproducible simulation studies from model repositories using the
CombineArchive Toolkit ...137 Robin Cijvat, Stefan Manegold, Martin Kersten, Gunnar W. Klau,
Alexander Schönhuth, Tobias Marschall, Ying Zhang
Genome sequence analysis with MonetDB: a case study on Ebola virus diversity...143 Ahmet Bulut
RightInsight: Open Source Architecture for Data Science ...151 Christian Authmann, Christian Beilschmidt, Johannes Drönner, Michael Mattig, Bernhard Seeger
Rethinking Spatial Processing in Data-Intensive Science ...161
Studierendenprogramm
Marc Büngener
CBIR gestütztes Gemälde-Browsing ...173 David Englm e ier, Nina Hubig, Sebastian Goebl, Christian Böhm
Musical Similarity Analysis based on Chroma Features and Text Retrieval Methods ...183
Alexander Askinadze
Vergleich von Distanzen und Kernel für Klassifikatoren zur Optimierung der
Annotation von Bildern ...193 Matthias Liebeck
Aspekte einer automatischen Meinungsbildungsanalyse von Online-Diskussionen ...203 Martin Winter, Sebastian Goebl, Nina Hubig, Christopher Pleines, Christian Böhm Development and Evaluation of a Facebook-based Product Advisor for Online
Dating Sites...213 Daniel Töws, Marwan Hassani, Christian Beecks, Thomas Seidl
Optimizing Sequential Pattern Mining Within Multiple Streams...223 Marcus Pinnecke
Konzept und prototypische Implementierung eines föderativen Complex
Event Processing Systeme mit Operatorverteilung ...233 Monika Walter, Axel Hahn
Unterstützung von datengetriebenen Prozessschritten in Simulationsstudien
durch Verwendung multidimensionaler Datenmodelle ...243 Niklas Wilcke
DduP – Towards a Deduplication Framework utilising Apache Spark...253
Tutorienprogramm
Christian Beecks, Merih Uysal, Thomas Seidl
Distance-based Multimedia Indexing ...265 Kai-Uwe Sattler, Jens Teubner, Felix Beier, Sebastian Breß
Many-Core-Architekturen zur Datenbankbeschleunigung ...269 Felix Gessert, Norbert Ritter
Skalierbare NoSQL- und Cloud-Datenbanken in Forschung und Praxis ...271 Jens Albrecht, Uta Störl
Big-Data-Anwendungsentwicklung mit SQL und NoSQL ...275
Workshopprogramm
Second Workshop on Databases in Biometrics, Forensics and Security
Applications
Second Workshop on Databases in Biometrics, Forensics and Security Applications
Jana Dittmann 1 , jana.dittmann@ovgu.de Veit K¨oppen 1 , veit.koeppen@ovgu.de Gunter Saake 1 , gunter.saake@ovgu.de Claus Vielhauer 2 , claus.vielhauer@fh-brandenburg.de
1 Otto-von-Guericke-University Magdeburg
2 Brandenburg University of Applied Science
The 1st Workshop on Databases in Biometrics, Forensics and Security Applications (DB- forBFS) was held as satellite workshop of the BTW 2013. The workshop series is intended for disseminating knowledge in the areas of databases in the focus for biometrics, foren- sics, and security complementing the regular conference program by providing a place for in-depth discussions of this specialized topic. The workshop will consist of two parts:
First, presentation of accepted workshop papers and second, a discussion round. In the discussion round, the participants will derive research questions and goals to address im- portant issues in the domain databases and security. We expect the workshop to facilitate cross-fertilization of ideas among key stakeholders from academia, industry, practitioners and government agencies. Theoretical and practical coverage of the topics will be consid- ered. We also welcome software and hardware demos. Full and short papers are solicited.
Motivated by today’s challenges from both disciplines several topics include but are not limited to:
• approaches increasing the search speed in databases for biometrics, forensics and security,
• database validation procedures for integrity verification of digital stored content
• design aspects to support multimodal biometric evidence and its combination with other forensic evidence
• interoperability methodologies and exchange protocols of data of large-scale op- erational (multimodal) databases of identities and biometric data for forensic case assessment and interpretation, forensic intelligence and forensic ID management
• database security evaluation and benchmarks for forensics and biometric applica- tions
• the role of databases in emerging applications in Biometrics and Forensics
• privacy, policy, legal issues, and technologies in databases of biometric, forensic and
security data.
1 Workshop Organizers
Jana Dittmann (Otto-von-Guericke-University Magdeburg) Veit K¨oppen (Otto-von-Guericke-University Magdeburg) Gunter Saake (Otto von Guericke University Magdeburg) Claus Vielhauer (Brandenburg University of Applied Science)
2 Program Committee
Ruediger Grimm (University of Koblenz, DE) Dominic Heutelbeck (FTK, DE)
Stefan Katzenbeisser (Technical University Darmstadt, DE) Claus-Peter Klas (GESIS, DE)
G¨unther Pernul (Universit¨at Regensburg, DE)
Ingo Schmitt (Brandenburg University of Technology, DE) Claus Vielhauer (Brandenburg University of Applied Science, DE) Sviatoslav Voloshynovskiy (unige, CH)
Edgar R. Weippl (sba-research, Austria)
On Performance Optimization Potentials Regarding Data Classification in Forensics
Veit K¨oppen, Mario Hildebrandt, Martin Sch¨aler Faculty of Computer Science
Otto-von-Guericke-University Magdeburg Universit¨atsplatz 2
39106 Magdeburg veit.koeppen@ovgu.de mario.hildbrandt@ovgu.de
martin.schaeler@ovgu.de
Abstract: Classification of given data sets according to a training set is one of the es- sentials bread and butter tools in machine learning. There are several application sce- narios, reaching from the detection of spam and non-spam mails to recognition of ma- licious behavior, or other forensic use cases. To this end, there are several approaches that can be used to train such classifiers. Often, scientists use machine learning suites, such as WEKA, ELKI, or RapidMiner in order to try different classifiers that deliver best results. The basic purpose of these suites is their easy application and extension with new approaches. This, however, results in the property that the implementation of the classifier is and cannot be optimized with respect to response time. This is due to the different focus of these suites. However, we argue that especially in basic research, systematic testing of different promising approaches is the default approach. Thus, optimization for response time should be taken into consideration as well, especially for large scale data sets as they are common for forensic use cases. To this end, we discuss in this paper, in how far well-known approaches from databases can be applied and in how far they affect the classification result of a real-world forensic use case. The results of our analyses are points and respective approaches where such performance optimizations are most promising. As a first step, we evaluate computation times and model quality in a case study on separating latent fingerprint patterns.
1 Motivation
Data are drastically increased in a given time period. This is not only true for the number of data sets (comparable to new data entries), but also with respect to dimensionality. To get into control of this information overload, data mining techniques are used to identify patterns within the data. Different application domains require for similar techniques and therefore, can be improved as the general method is enhanced.
In our application scenario, we are interested in the identification of patterns in data that
are acquired from latent fingerprints. Within the acquired scanned data a two-class classi-
fication is of interest, to identify the fingerprint trace and the background noise. As point
of origin, experts classify different cases. This supervised approach is used to learn a clas- sification and thus, to support experts in their daily work. With a small number of scanned data sets that the expert has to check and classify, a high number of further data sets can be automatically classified.
Currently, the system works in a semi-automatic process and several manual steps have to be performed. Within this paper, we investigate the influence on system response and model quality, in terms of accuracy and precision, in the context of integrating the data and corresponding processes in a holistic system. Although a complete integration is feasible, different tools are currently used, which do not fully cooperate. Therefore, the efficiency or optimization regarding computation or response time are not in the focus of this work.
With this paper, we step forward to create a cooperating and integrated environment that performs efficient with respect to model quality.
This paper is structured as follows: In the next section, we briefly present some back- ground regarding classification and database technologies for accessing multi-dimensional data. In Section 3, we describe the case study that is the motivation for our analysis. Within Section 4, we present our evaluation on the case study data regarding optimization due to feature and data space reduction. Finally, we conclude our work in Section 5.
2 Background
In this section, we give background on classification algorithms in general. Then, we explain one of these algorithms that we apply in the remainder of this paper in more details.
Finally, we introduce promising optimization approaches known from databases. We use these approaches in the remainder to discuss their optimization potential with respect to classification.
2.1 Classification Algorithms
In the context of our case study in Section 3, several classification algorithms can be uti- lized, see, e.g., [MKH + 13]. Each of those algorithms is used for supervised learning. Such type of learning consists of a model generation based on training data, which are labeled according to a ground-truth. The utilized classification algorithms in [MKH + 13] partition the feature space to resemble the distribution of each instance (data point) in this space.
Afterward, the quality of the model can be evaluated using an independent set of labeled test data by comparing the decision of the classifier with the assigned label.
The utilized classification schemes from the WEKA data mining software [HFH + 09] in
[MKH + 13] include support vector machines, multilayer perceptrons, rule based classi-
fiers, decision trees, and ensemble classifiers. The latter ones combine multiple models in
their decision process.
C4.5 decision tree
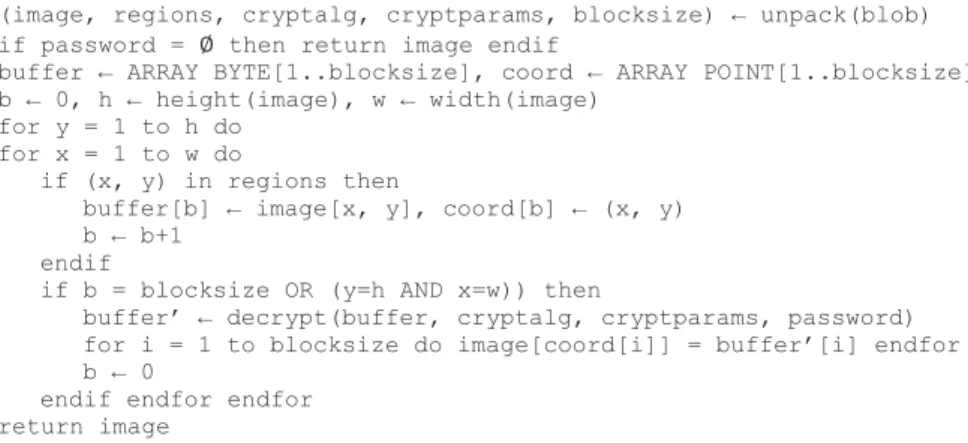
In this paper, we use the classifier J48, WEKA’s [HFH + 09] implementation of the fast C4.5 decision tree [Qui93], which is an improvement of the ID 3 algorithm [Qui86] and one of the most widely known decision tree classifiers for such problems. The advantage of decision trees is their comprehensiveness: the classifier’s decision is a leaf reached by a path of single feature thresholds. The size of the tree is reduced by a pruning algorithm which replaces subtrees. Furthermore, this particular implementation is able to deal with missing values. In order to do that, the distribution of the available values for this particular feature is taken into account.
12 34 56 7 89 1011 1213 1415 16 1718 1920 2122
build_tree ( Data (R:{r_1,..,,r_n},C) R: non-categorical_attributes r_1 to r_n, C: categorical attribute,
S: training set in same schema as Data) returning decision_tree;
begin
-- begin exceptions If is_empty(S)
return FAILURE;
If only_one_category(DATA)
return single_node_tree(value(C));
If is_empty(R)
return single_node_tree(most_frequent_value(C));
-- end excpetions
Attribute r_d (elem of R) := largest_Gain(R,S);
{d_i| i=1,2, .., m} := values_of_attribute(r_d);
{S_i| i=1,2, .., k} := subsets(S) where in each subset value(r_d) = d_i holds;
decision_tree := tree(r_d) with nodes { d_1, d_2, .., d_m} pointing to trees call ID3((R-{r_d}, C), S1), ID3((R-{r_d}), C, S2), .., ID3((R-{r_d}, C), S_k);
return decision_tree;
end build_tree;
Figure 1: Algorithm to build a C4.5 decision tree, adapted from [Qui86]
In Figure 1, we depict the general algorithm to build a C4.5 decision tree. The argument for the algorithm is a training set consisting of: (1) n non-categorical attributes R reaching from r 1 to r n , (2) the categorical attribute (e.g., spam or not spam), and (3) a training set with the same schema. In Lines 8 to 15, the exception handling is depicted, for instance if there are only spam mails (Line 11). The actual algorithm tries to find the best attribute r d
and distributes the remaining tuples in S according to their value in r d . For each subtree that is created in that way the algorithm is called recursively.
2.2 Approaches for Efficient Data Access
Data within databases have to be organized in such a way that they are efficiently ac-
cessed. In the case of multi-dimensional data, an intuitive order does not exist. This is
even more apparent for the identification of unknown patterns, where an ordering in a
multi-dimensional space always dominates some dimensions. For these reasons, differ-
ent approaches have been proposed. They can be differentiated into storage and index structures.
Typical storage improvements within the domain of Data Warehousing [KSS14a] are column-oriented storage [AMH08], Iceberg-Cube [FSGM + 98], and Data Dwarf [SDRK02].
Whereas the Iceberg-Cube reduces computational effort, column-oriented storage improves the I/O with respect to the application scenario, where operations are performed in a column-oriented way. The Data Dwarf heavily reduces the stored data volume without loss of information. It combines computational effort and I/O cost for improving effi- ciency.
Furthermore, there exist many different index structures for specialized purposes [GBS + 12].
Very well-known index structures for multi-dimensional purposes are the kd-Tree [Ben75]
and R-Tree [Gut84]. Both mentioned indexes are candidates, which suffer especially from the curse of dimensionality. The curse of dimensionality is a property of large and sparsely populated high-dimensional spaces, which results in the effect that for tree-based indexes often large parts have to be taken into consideration for a query (e.g., because of node overlaps). To this end, several index structures, as the Pyramid technique [BBK98] or im- proved sequential scans, such as the VA-File [WB97] are proposed. In the following, we briefly explain some well-known indexes that, according to prior evaluations [SGS + 13], result in a significant performance increase. A broader overview on index structures can be found in [GG98] or [BBK01]. Challenges regarding parameterization of index structures as well as implementation issues are discussed in [AKZ08, KSS14b, SGS + 13].
2.2.1 Column vs. Row Stores
Traditionally, database systems store their data row-wise. That means that each tuple with all its attributes is stored and then the next tuple follows. By contrast, columnar storage means that all values of a column are stored sequentially and then the next column follows.
Dependent on the access pattern of a classification algorithm, the traditional row-based storage should be replaced if, for instance, one dimension (column) is analyzed to find an optimal split in this dimension. In this case, we expect a significant performance benefit.
2.2.2 Data Dwarf
The basic idea of the Data Dwarf storage structure is to use prefix and suffix redundancies
for multi-dimensional points to compress the data. For instance, the three dimensional
points A(1, 2, 3) and B (1, 2, 4) share the same pre-fix (1, 2, ). As a result, the Dwarf
has two interesting effects that are able to speed-up classifications. Firstly, due to the
compression, we achieve an increased caching performance. Secondly, the access path is
stable, which means that we require exactly the number of dimension look-ups to find a
point (e.g., three look-ups for three dimensional points).
2.2.3 kd-Tree
A kd-Tree index is a multi-dimensional adaption of the well-known B-Tree cycling through the available dimensions. Per tree level, this index distributes the remaining points in the current subtree into two groups. One group in the left subtree where the points have a value smaller or equal than the separator value in the current dimension, while the remain- ing points belong to the right sub tree. The basic goal is to achieve logarithmic effort for exact match queries. In summary, this index structure can be used to efficiently access and analyze single dimensions in order to separate two classes.
2.2.4 VA-File
Tree-based index structures suffer from the curse of dimensionality. This may result in the effect that they are slower than a sequential scan. To this end, improvements of the sequential scan are proposed. The basic idea of the Vector Approximation File is to use a compressed approximation of the existing data set that fits into the main memory (or caches). On this compressed data an initial filter step is performed in order to minimize actual point look-ups. In how far this technique can be applied to speed-up classifications is currently unknown.
3 Case Study
As described in [HKDV14], the classification of contact-less scans of latent fingerprints is performed using a block based approach. The following subsections summarize the application scenario, the data gathering process, and a description of the feature space. We depict this process in Fig. 2. We describe the steps in the following in more detail.
CWL Sensor
Feature Selection
Fingerprint Contactless
Scan Block
Segmentation Filtering
1st Deviation Sobel X/Y 2nd Deviation Sobel X/Y 1st Deviation Sobel X 1st Deviation Sobel Y Unsharp Masking
Classification - Statistical Features
- Structural Features - Semantic Features
-
Feature Extraction
Fingerprint Ridge Orientation Semantics
Substrate Scan Data
1.1 5.9 ...
...
3.3 7.5 BG
3.1 2.2 ...
...
9.7 1.4 FP ...
1.1 5.9 ...
...
3.3 7.5 BG
3.1 2.2 ...
...
9.7 1.4 FP ...
Figure 2: Data acquisition process, processing, and classification
3.1 Application scenario
The application scenario for this case study is the contact-less, non-invasive acquisition of latent fingerprints. The primary challenge of this technique is the inevitable acquisition of the substrate characteristics superimposing the fingerprint pattern. Depending on the substrate, the fingerprint can be rendered invisible. In order to allow for a forensic analysis of the fingerprint, it is necessary to differentiate between areas of the surface without fingerprint residue and others covered with fingerprint residue (fingerprint segmentation).
For this first evaluation, we solely rely on white furniture surface, because it provides a rather large difference between the substrate and the fingerprint. The achieved classifi- cation accuracy in a two-fold cross-validation based on 10 fingerprint samples is 93.1%
for the J48 decision tree in [HKDV14]. The number of 10 fingerprints is sufficient for our evaluation, because we do not perform a biometric analysis. Due to the block-based classification, 1,003,000 feature vectors are extracted. For our extended 600 dimensional feature space (see Section 3.3), we achieve a classification accuracy of 90.008% based on 501,500 data sets for each of the two classes ”fingerprint” and ”substrate”.
3.2 Data Gathering Process
The data gathering process utilizes a FRT CWL600 [Fri14] sensor mounted to a FRT MicroProf200 surface measurement device. This particular sensor exploits the effect of chromatic aberration of lenses to measure the distance and the intensity of the reflected light simultaneously. Due to this effect, the focal length of different wavelength is differ- ent. Thus, only one wavelength from the source of white light is focused at a time. This particular wavelength yields the highest intensity in the reflected light. So, it can be easily detected using a spectrometer by locating the maximum within the spectrum.
The intensity value is derived from the amplitude of this peak within the value range [1; 4, 095]. The wavelength of the peak can be translated into a distance between the sensor and the measured object using a calibration table. The achieved resolution for this distance is 20 nm. The data itself are stored within a 16 bit integer array which can be afterward converted to a floating point distance value. The CWL600 is a point sensor which acquires the sample point-by-point while the sample is moved underneath. Thus, it is possible to select arbitrary lateral resolutions for the acquisition of the sample.
In our case study, we use a lateral dot distance of 10 µm which results in a resolution five times as high as the commonly used resolution of 500 ppi in biometric systems.
3.3 Data Description
The feature space in [HKDV14] contains statistical, structural, and fingerprint semantic
features. The final feature space is extracted from the intensity and topography data (see
Section 3.2) and preprocessed versions of these data sets. Table 1 summarizes the 50 features which are extracted from each data set.
Feature Set Features
Statistical Features Minimum value; maximum value; span; mean value;
median value; variance; skewness; kurtosis; mean squared error; entropy; globally and locally normal- ized values of absolute min, max, median; globally and locally normalized values of relative min, max, span, median; globally normalized absolute and rela- tive mean value of B
Structural Features Covariance of upper and lower half of a block B; co- variance of left and right half of the block B; line variance of a block B; column variance of a block B; most significant digit frequency derived from Ben- ford’s Law [Ben38] (9 features); Hu moments [Hu62]
(7 features) Fingerprint Semantic Fea-
tures Maximum standard deviation in B M after Gabor filter- ing; mean value of the block B for the highest Gabor response
Table 1: Overview of the extracted features
All features are extracted from blocks with a size of 5×5 pixels with the exception of the fingerprint semantic feature of the maximum standard deviation in B M after Gabor filtering. The fingerprint semantic features are motivated by the fingerprint enhancement, e.g. [HWJ98], which utilize Gabor filters for emphasizing the fingerprint pattern after determining the local ridge orientation and frequency. Since this filtering relies on a ridge valley pattern, it requires larger blocks. In particular, we use a block size of 1.55 by 1.55 mm (155×155 pixels) as suggested in [HKDV14].
The features are extracted from the original and pre-processed data. In particular, the intensity and topography data are pre-processed using Sobel operators in first and second order in X and Y direction combined, Sobel operators in first order in X, as well as Y direction separately, and unsharp masking (subtraction of a blurred version of the data).
In result, we get a 600-dimensional feature space. However, some of the features cannot be determined, e.g., due to a division by zero in case of the relative statistical features.
Thus, either the classifier must be able to deal with missing values, or those features need to be excluded. To this end, we apply the J48 classifier, because it handles missing data.
4 Evaluation
In this section, we present the evaluation of the classification according to the J48 al-
gorithm. We restrict this study to performance measurements of computation time for
Condition positive Condition negative Test outcome positive True Positive (TP) False Positive (FP) Test outcome negative False Negative (FN) True Negatives (TN)
Table 2: Contingency table
building the model and for the evaluation of the model. As influences on the performance, we identify according to Section 2.2 cardinality of the dimensions and involved features.
Therefore, we investigate the model quality with respect to precision and recall. First, we present our evaluation setup. This is followed by the result presentation. Finally, we discuss our findings.
4.1 Setup
Our data are preprocessed as described in Section 3. We use the implementation of C4.5 [Qui93] in WEKA, which is called J48. For the identification of relationships be- tween included feature dimensions and feature cardinality and model build time and model evaluation time, we use different performance measurements regarding the model. We briefly describe the model performance measurements in the following.
In classification, the candidates can be classified correctly or incorrectly. Compared to the test population four cases are possible, as presented in Table 2.
In the following we define measures that can be derived from the contingency table. The recall (also called sensitivity or true positive rate) represents the correctly identified posi- tive elements compared to all identified positive elements. This measure is defined as:
Recall = T P
T P + F N (1)
Accuracy describes all correctly classified positive and negative elements compared to all elements. This measure assumes a non-skewed distribution of classes within the learning as well as training data. It is defined as:
Accuracy = T P + T N
T P + F N + F P + T N (2)
Precision is also called positive prediction rate and measures all correctly identified posi- tives compared to all positives in the ground truth. It is defined as:
Precision = T P
T P + F P (3)
Specificity is also called true negative rate and is a ratio comparing the correctly classified negative elements to all negative classified elements. It is defined as:
Specificity = T N
F P + T N (4)
The measure Balanced Accuracy is applied in the case that the classes are not equally distributed. This takes non-symmetric distributions into account. The balance is achieved by computing the arithmetic mean of Recall and Specificity and it is defined as:
Balanced Accuracy = Recall + Specificity
2 = 1
2 ·
) T P
T P + F N + F N F P + T N
. (5) The F-Measure is the harmonic mean of precision and recall to deal with both interacting indicators at the same time. This results in:
F-Measure = 2 · T P
2 · T P + F P + F N (6)
Depending on the application scenario, a performance measure can be used for optimiza- tion. In Fig. 3, we depict all above stated performance measurements according to a filter- ing of our data set.
● ●
●●
●●
● ●
●●
●
●
●
●
●
300 400 500 600
0.850.860.870.880.890.90
Model Performance Measures
Dimensions / Features
Quality
● F−Measure Accuracy balanced Accuracy Precision Recall Specificity
Figure 3: Performance Measures for different filters of the test case
In our evaluation, we investigate two different performance influences. On the one side, we are interested in filtering out correlated data columns. At the other side, we measure performance for a restricted data space domain. This is applied by a data discretization.
Evaluation is based on three important aspects:
• Building the model in terms of computation time,
• Testing the model in terms of computation time, and
• Quality of the model measured in model performance indicators.
From Fig. 3 it can be identified, that the computed models have a higher specificity than recall. This results also in a lower F-Measure. Furthermore, it can be seen that the training data are not imbalanced and accuracy is very close to balanced accuracy. However, all values are close and at an acceptable range. Therefore, we use for the remainder of our result presentation the F-Measure as model performance measure.
For reducing the dimensional space, we secondly discretize each feature. This is computed in such a way that the variance within a feature is retained as best as possible. Currently, there are no data structures within the WEKA environment, that use restricted data spaces efficiently. Therefore, we assume that model creation and model evaluation times are not significantly influenced. However, as a database system can be used in future, the ques- tion arises, which quality influence on model performance is achieved by discretization.
Therefore, we conduct an evaluation series with discretized feature dimensions, where all feature dimensions are restricted to the following cardinalities:
• 8 values,
• 16 values,
• 32 values,
• 64 values,
• 128 values,
• 256 values,
• 512 values,
• 1,024 values,
• 2,048 values, and
• full cardinality.
4.2 Result Presentation
As a first investigation of our evaluation scenario, we present results regarding the elimi- nation of features. For the feature elimination we decide for an statistical approach, where correlated data columns are eliminated from the data set.
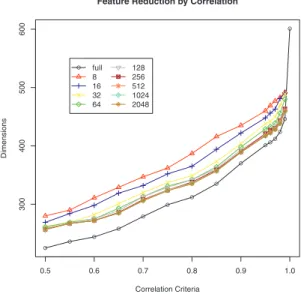
In Fig. 4, we present the dimensions that are included in the data set. At the x-axis, we present the correlation criteria that are used for elimination. For instance, a correlation criteria of 99% means that all data columns are eliminated from the data set that have a correlation of 0.99 to another feature within the data set. Note, we compare every feature column with every other and at an elimination decision; we left the first in the data set.
Therefore, we prefer the first data columns within the data set. Furthermore, we also tested the feature reduction for discretized data sets. With a small cardinality, the feature reduction due to correlation is lower, which means that the dimensional space is higher compared to the others.
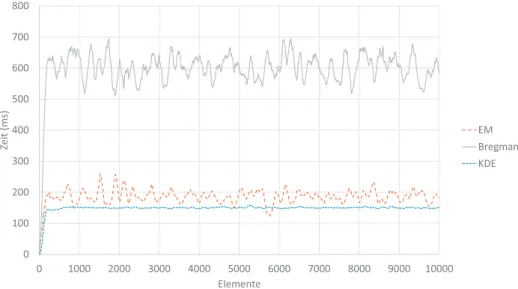
We evaluate in the following the reduction of the feature space in terms of computational effort. We differentiate at this point two cases for this effort: On the one side the model building time represents computational performance for creating (learning) the model. As the amount of data tuples for learning the model we use 501,500 elements. As a second measurement, we present evaluation times where 501,500 further elements are used in a testing phase of the model. This additionally leads to the quality indicators of the model presented in Section 4.1. We present this information afterward.
In Fig. 5, we present the model creation times for different data sets. With a decrease of the
feature space, the computation time reduces, too. However, there are some saltus identifi-
●
●
●
●●
●
●
●
●
●
●
●
●
●
●
0.5 0.6 0.7 0.8 0.9 1.0
300400500600
Feature Reduction by Correlation
Correlation Criteria
Dimensions
●
●
●●
●
●
●
●
●
●
●
● ●
●
●
●
full 8 16 32 64
128 256 512 1024 2048
Figure 4: Feature Reduction by Correlation
able. These are related to the fact, that the algorithm has a dynamic model complexity. This means that the number of nodes within the model is not restricted and therefore, smaller models can have a faster generation time. Nevertheless, we do not focus on optimization for our case study, but we derive a general relationship. From our data, we can derive that a decrease is reduced for data that are not more than 85% correlated. This leads to a slower reduction in computation time. However, with this elimination of 85% correlated values, the computational effort is reduced to approximately one third. An important result from the model generation: a restrictive discretization (cases 8 and 16) does negatively influ- ences the model building time. Note, we do not use in our evaluation an optimized data structure, which has a significant influence on the computational performance, see also Section 2.2. Although the underlying data structure is general, a restriction of the feature cardinalities improves model building times for the cases cardinality 32 and higher.
For evaluation times of the model a similar behavior is identifiable. In Fig. 6, we present the evaluation times for the same data sets. Two major differences can be easily seen: On the one side, the difference between the test cases is smaller and the slopes are smoother.
On the other side, a reduction of the evaluation time is optimal for cardinalities of 32 and 64. An increase of the cardinalities leads to a higher computational effort. This is respected to the fact that the sequential searches within the data are quite important for the testing phase of a model. A usage of efficient data structures should therefore be in focus of future studies.
With both above presented evaluations, we only have computation time in the focus. How-
ever, we have to respect the quality of the model at the same time. Within classification
applications, an increased information usage (in terms of data attributes) can increase the
model quality. A reduction of the information space might lead to a lower model quality.
●
●
●
●●
●
●
● ●
●
● ●
● ●
●
0.5 0.6 0.7 0.8 0.9 1.0
200040006000800010000
Model Build Time
Erased Correlations
Timeinsecs ●
●●
●●
●
● ●
●
●
● ●
● ●
●
●
full 8 16 32 64
128 256 512 1024 2048
Figure 5: Model Build Time
●
●
●
●
●
●
●
●
●
● ●
●
●
●
●
0.5 0.6 0.7 0.8 0.9 1.0
2000400060008000
Model Evaluation Time
Erased Correlations
Timeinsecs ●
●●
●●
●
●
● ●
●
● ●
● ●
●
●
full 8 16 32 64
128 256 512 1024 2048
Figure 6: Model Evaluation Times In Fig. 7, we show the relationship between erased correlations and the F-Measure. Note, that an increase in the F-Measure is also for a reduced data space possible (e.g., in the case of full cardinality). With a reduced cardinality in the information space, a lower F- Measure is achieved. This is especially true for low cardinalities (e.g., 8 or 16). However, in the case that the cardinality is reduced from a correlation of 0.95 to 0.9 within the data set a higher decrease in the F-Measure is identifiable. A second significant reduction of the F-measure is at the 0.7 correlation elimination level.
In Fig. 8, we present the relationship between model build times and the model quality.
Although a negative dependency is assumed, this trend is only applicable to some parts of the evaluation space. As an optimization of model quality and computation time, the first high decrease model quality is at an elimination of 0.95 correlated values. Further eliminations do not influence the model build times in a similar decrease.
Overall, we have to state that our reduction of the data space is quite high compared to the reduction of the model quality in terms of the F-measure. Note, other model performance measures are quite similar.
4.3 Discussion
With our evaluation, we focus on the influences of the data space to model performance
in terms of quality and computation times. Therefore, we reduce the information space in
two ways. On the one hand, we restrict dimensionality by applying a feature reduction by
correlation. This is also called canonical correlation analysis. It can be computed in a very
efficient way and therefore, it is much faster than other feature reduction techniques, e.g.,
principal component analysis or linear discriminant analysis. Furthermore, we restrict the
cardinality of the feature spaces, too. We discretize the feature space and are interested in
●●
●●
●●
●
●
● ●
● ●
● ●
●
0.5 0.6 0.7 0.8 0.9 1.0
0.820.840.860.880.90
Model Performance: F−Measure
Erased Correlations
●●
●
●
●
● ●
● ●
●
●
●
●
●
●
●
full 8 16 32 64
128 256 512 1024 2048
Figure 7: Model Quality and Reduction
● ●
● ●●
●
● ●
● ●
●●
●●
●
4000 6000 8000 10000
0.820.840.860.880.90
Model Performance: F−Measure
Model build time in secs
●● ●
●
●
●● ●
●
●
●
●
●
●
●
●
full 8 16 32 64
128 256 512 1024 2048
![Figure 1: Algorithm to build a C4.5 decision tree, adapted from [Qui86]](https://thumb-eu.123doks.com/thumbv2/1library_info/3946772.1534589/24.659.65.594.284.569/figure-algorithm-build-c-decision-tree-adapted-qui.webp)