The Service Revolution in South Asia
June 2009
Poverty Reduction and Economic Management Unit South Asia Region
Public Disclosure AuthorizedPublic Disclosure AuthorizedPublic Disclosure AuthorizedPublic Disclosure Authorized
51812
Vice President : Isabel Guerrero, SARVP Senior Manager : Sadiq Ahmed, SARVP
Sector Director : Ernesto May, SASPF
Sector Manager : Miria Pigato, SASEP
Task Leader : Ejaz Ghani, SASEP
C ONTENTS
L
IST OFT
ABLES ANDF
IGURES ... 4A
CKNOWLEDGMENTS ... 7L
IST OFA
BBREVIATIONS ... 8THE SERVICE REVOLUTION IN SOUTH ASIA: AN OVERVIEW ... 9
A. I
NTRODUCTION... 9
B. T
HES
ERVICESR
EVOLUTION... 11
C. S
ERVICES‐LEDG
ROWTH... 14
D. S
ERVICE‐LEDG
ROWTH&
P
OVERTY REDUCTION ... 18E. S
ERVICEE
XPORTS—M
ODERN ANDT
RADITIONAL ... 24F. S
ERVICEI
NFRASTRUCTURE ... 31F. O
RGANIZING FORS
ERVICES ... 33PART I: ROLE OF SERVICE IN DEVELOPMENT ... 37
1.
IS SERVICE‐LED GROWTH A MIRACLE FOR SOUTH ASIA? ... 39
A. I
NTRODUCTION... 39
B. T
HES
ERVICESR
EVOLUTION... 43
C. I
SS
ERVICE ANE
NGINE OFG
ROWTH? ... 48
D. H
OWD
ISTINCTIVE ISS
OUTHA
SIA’
SE
XPORTP
ATTERN? ... 57
E. I
SS
ERVICE‐LEDG
ROWTHP
RO‐POOR? ... 65
F. W
HATE
XPLAINSS
OUTHA
SIA’
SS
ERVICE‐LEDG
ROWTH? ... 77
G. C
ONCLUSION... 84
A
NNEXA. L
IST OF VARIABLES,
DATA DESCRIPTION,
AND SOURCES ... 872.
THE ROLE OF THE SERVICE SECTOR IN ECONOMIC GROWTH AND EMPLOYMENT GENERATION IN SOUTH ASIA ... 95
A. I
NTRODUCTION... 95
B. B
ASICE
CONOMICS
TRUCTURE ... 98C. G
ROWTH INO
UTPUT ANDP
RODUCTIVITY ... 102D. L
ABORP
RODUCTIVITY ANDR
EALLOCATIONE
FFECTS... 107
E. C
OMPOSITION OFS
ERVICES... 110
F. T
HER
OLE OFE
DUCATION ... 112G. E
XTERNALS
ERVICEST
RADE ANDF
OREIGNI
NVESTMENT... 113
H. C
ONCLUSION... 116
A
NNEXA. S
OURCES ANDQ
UALITY OFD
ATA... 119
A
NNEXB. T
HES
ERVICES
ECTOR... 125
3.
NEW ECONOMIC GEOGRAPHY, SERVICES AND SOUTH ASIA ... 131
A. I
NTRODUCTION... 131
B. K
EYI
NGREDIENTS OFN
EWE
CONOMICG
EOGRAPHY... 132
C. N
EWE
CONOMICG
EOGRAPHY ANDS
ERVICES ... 135D. N
EWE
CONOMICG
EOGRAPHY,
S
ERVICES ANDS
OUTHA
SIA:
P
OLICYI
MPLICATIONS ... 147L IST OF T ABLES AND F IGURES T ABLES
T
ABLE1:
C
ROSS‐COUNTRYR
ESULTS ONC
HANGE INP
OVERTYH
EADCOUNTR
EGRESSED ONA
GRICULTURE,
M
ANUFACTURING,
AND
S
ERVICESO
UTPUTG
ROWTH,
FOR50
D
EVELOPINGC
OUNTRIES(1990‐2005) ... 19
T
ABLE1.1:
C
ONTRIBUTION OFM
ANUFACTURING ANDS
ERVICEG
ROWTH TOGDP
G
ROWTH... 42
T
ABLE1.2:
S
OUTHA
SIA ANDC
HINA IN THE CROSS SECTION:
SHARES OF MANUFACTURING AND SERVICES INGDP ... 49
T
ABLE1.3:
S
OURCES OFG
ROWTH INO
UTPUT PERW
ORKER INI
NDIA ANDC
HINA:
T
OTALE
CONOMY ANDM
AJORS
ECTORS,
1980‐2006 ... 53
T
ABLE1.4:
I
NDIA ANDC
HINA IN THEC
ROSSS
ECTION:
G
ROWTH INL
ABORP
RODUCTIVITY,
1991‐2005 ... 55
T
ABLE1.5:
S
OUTHA
SIA IN THE CROSS SECTION‐‐SHARE OFS
ERVICEE
XPORTS ANDM
ODERNS
ERVICEE
XPORTS(
COMPUTER AND INFORMATION SERVICE EXPORTS)
INT
OTALE
XPORTS OFG
OODS ANDS
ERVICES... 59
T
ABLE1.6:
S
OUTHA
SIA ANDC
HINA IN THEC
ROSSS
ECTION ONT
RADITIONALS
ERVICEE
XPORT... 60
T
ABLE1.7:
S
OUTHA
SIA ANDC
HINA IN THEC
ROSSS
ECTION:
S
HARE OFT
RANSPORT ANDT
RAVELS
ERVICEE
XPORTS INT
OTALE
XPORT OFG
OODS ANDS
ERVICES... 61
T
ABLE1.8:
I
NVESTMENT IS MORE IMPORTANT TO MANUFACTURING COMPARED TO SERVICES ... 64T
ABLE1.9:
E
DUCATIONALA
TTAINMENT BYS
ECTOR OFE
MPLOYMENT,
2002‐2006 ... 67
T
ABLE1.10:
S
OUTHA
SIA ANDC
HINA IN THEC
ROSSS
ECTION:
C
HANGE IN POVERTY HEADCOUNT(1990‐2005) ... 70
T
ABLE1.11:
I
NDIA ANDC
HINA IN THE CROSS SECTION:
EMPLOYMENT SHARES OF INDUSTRY AND SERVICES IN TOTAL EMPLOYMENT,
1991,
2005 ... 74
T
ABLE1.12:
S
OUTHA
SIA ANDC
HINA IN THE CROSS SECTION:
FEMALE LABOR FORCE AS A SHARE OF TOTAL LABOR FORCE,
1982,
2006 ... 76
T
ABLE1.13:
R
ATIO OF PUBLIC EXPENDITURE ON TERTIARY EDUCATION TO PRIMARY EDUCATION PER STUDENT... 79
T
ABLE1.14:
C
ROSSC
OUNTRYR
EGRESSIONS:
P
UBLICE
XPENDITURE ONT
ERTIARYE
DUCATION PERS
TUDENT... 80
T
ABLE2.1:
S
UMMARYS
TATISTICS OFS
OUTHA
SIANE
CONOMIES,
2005 ... 99
T
ABLE2.2:
R
ATES OFG
ROWTH,
T
OTALE
CONOMY ANDM
AJORS
ECTORS,
S
OUTHA
SIAC
OUNTRIES,
1980‐2006 ... 104
T
ABLE2.3:
S
OURCES OFG
ROWTH INO
UTPUT PERW
ORKER INI
NDIA ANDP
AKISTAN:
T
OTALE
CONOMY ANDM
AJORS
ECTORS,
1980‐2006 ... 106
T
ABLE2.4:
S
OUTHA
SIAL
ABORP
RODUCTIVITYL
EVELS,
BYS
ECTOR,
2005 ... 108
T
ABLE2.5:
E
DUCATIONALA
TTAINMENT BYS
ECTOR OFE
MPLOYMENT,
2002‐2005 ... 112
T
ABLE2.6:
2006
S
ERVICEST
RADE BYT
YPE,
S
OUTHA
SIA(
IN MILLIONUS
D
OLLARS) ... 114
T
ABLE2.7:
S
TOCK OFI
NWARDF
OREIGND
IRECTI
NVESTMENT,
1990
AND2006 ... 115
T
ABLE3.1:
S
HARE OFE
XPORTS
ERVICES INT
OTALGDP... 136
T
ABLE3.2:
I
NDIA:
S
OFTWAREP
RODUCTION ANDE
XPORTS,
1996‐2006 ... 139
T
ABLE3.3:
S
ERVICEE
XPORTS(
IN MILLIONS OFUS
$)
OFS
OUTHA
SIANC
OUNTRIESD
ECOMPOSED ... 143T
ABLE3.4:
S
OUTHA
SIANC
OUNTRIES’
Q
UALITY OFC
OMMUNICATIONI
NFRASTRUCTURE ... 146F IGURES F
IGURE1:
A
VERAGEC
OST OFT
ELEPHONEC
ALL TO THEUS
($
PER3
MINUTES) ... 12
F
IGURE2:
GDP
G
ROWTH ANDS
ERVICE VALUE ADDED GROWTH(2000‐2005) ... 14
F
IGURE3:
GDP
G
ROWTH ANDM
ANUFACTURING VALUE ADDED GROWTH(2000‐2005) ... 14
F
IGURE4:
S
ERVICE IS THE LARGEST SECTOR INS
OUTHA
SIA(
SHARE OF SECTORS INGDP) ... 15
F
IGURE5:
S
ERVICE IS THE LARGEST CONTRIBUTOR TOGDP
GROWTH INS
OUTHA
SIA... 16
F
IGURE6:
L
ABORP
RODUCTIVITYL
EVELS,
BYS
ECTOR,
2005
(PPP
I
NTERNATIONALD
OLLARS PER WORKER) ... 17
F
IGURE7:
L
ABORP
RODUCTIVITYG
ROWTH ISH
IGH INS
ERVICES
ECTOR,
2000‐06 ... 17
F
IGURE8:
C
HANGE INP
OVERTY ANDG
ROWTH INS
ERVICEO
UTPUT(1990‐2005) ... 19
F
IGURE9:
S
ERVICE OUTPUT GROWTH IS A BIG CONTRIBUTOR TO POVERTY REDUCTION INI
NDIA ... 20F
IGURE10:
J
OBC
REATIONR
ATES INA
GRICULTURE,
I
NDUSTRY ANDS
ERVICESS
ECTORS,
1990‐2006 ... 21
F
IGURE11:
G
ROWTH INA
VERAGED
AILYE
ARNINGS(1999‐2000/2004‐05)
I
NDIA... 22
F
IGURE12:
F
EMALE EMPLOYMENT GOES HAND IN HAND WITH INCREASED SERVICE EMPLOYMENT... 23
F
IGURE13:
F
EMALEL
ABORF
ORCEP
ARTICIPATION BYS
ECTOR... 23
F
IGURE14:
S
ERVICEV
ALUEA
DDED ANDS
ERVICEE
XPORTG
ROWTH(2000‐05) ... 25
F
IGURE15:
D
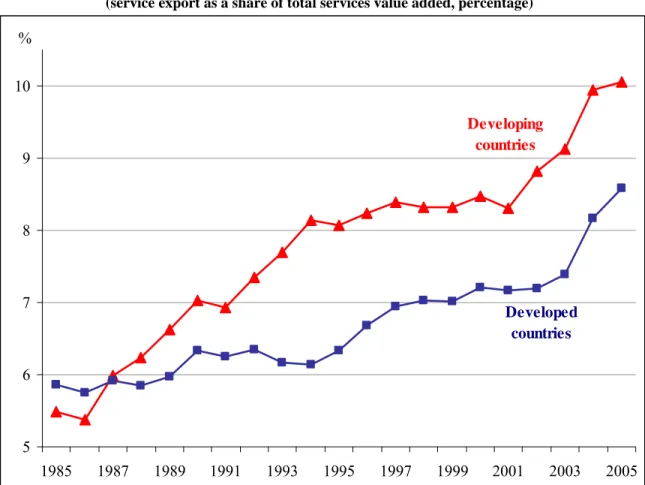
EVELOPING COUNTRIES ARE REAPING THE BENEFITS OF GLOBALIZATION OF SERVICES... 26
F
IGURE16:
S
OUTHA
SIA’
S SERVICE EXPORT IS GROWING FASTER THANE
ASTA
SIA’
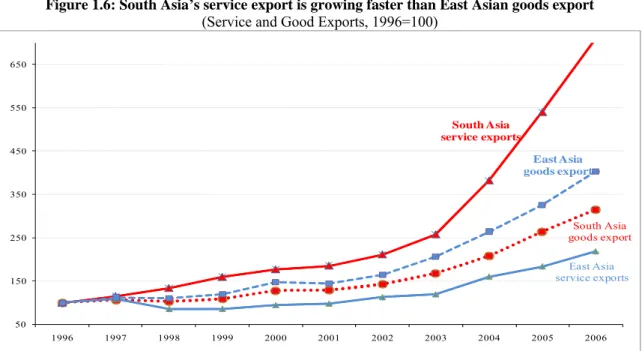
S GOODS EXPORT ... 27F
IGURE17:
R
EVEALED COMPARATIVE ADVANTAGE–
A
COMPARISON OFE
ASTA
SIA ANDS
OUTHA
SIA IN SERVICE AND GOODS EXPORTS... 27
F
IGURE18:
S
OUTHA
SIA HAS A STRONG COMPARATIVE ADVANTAGE INM
ODERNS
ERVICEE
XPORT ... 28F
IGURE19:
R
EMITTANCES INS
OUTHA
SIA,
2007 ... 30
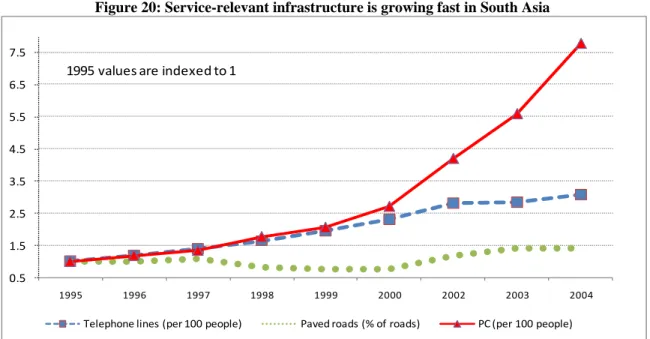
F
IGURE20:
S
ERVICE‐RELEVANT INFRASTRUCTURE IS GROWING FAST INS
OUTHA
SIA... 32
F
IGURE1.1:
S
ERVICE IS THEL
ARGESTS
ECTOR INS
OUTHA
SIA,
2005 ... 39
F
IGURE1.2:
S
ERVICE IS THE LARGEST CONTRIBUTOR TOGDP
GROWTH INS
OUTHA
SIA... 40
F
IGURE1.3:
R
ELATIONSHIP BETWEENGDP
G
ROWTH ANDS
ERVICE VALUE ADDED GROWTH(2000‐2005) ... 41
F
IGURE1.4:
R
ELATIONSHIP BETWEENGDP
G
ROWTH ANDM
ANUFACTURING VALUE ADDED GROWTH(2000‐2005) ... 41
F
IGURE1.5:
D
EVELOPING COUNTRIES ARE REAPING THE BENEFITS OF GLOBALIZATION OF SERVICE ... 47F
IGURE1.6:
S
OUTHA
SIA’
S SERVICE EXPORT IS GROWING FASTER THANE
ASTA
SIAN GOODS EXPORT... 48
F
IGURE1.7:
M
ODERN SERVICE HAS GROWN FASTER THAN TRADITIONAL SERVICE OUTPUT INS
OUTHA
SIA,
2000‐06
(
AVERAGE ANNUAL GROWTH,
PERCENT) ... 52
F
IGURE1.8:
T
HE SERVICE SECTOR IS THE LARGEST CONTRIBUTOR TO NATIONAL LABOR PRODUCTIVITY INS
OUTHA
SIA ... 53F
IGURE1.9:
C
OMPARINGS
ERVICEL
ABORP
RODUCTIVITYG
ROWTH ANDM
ANUFACTURINGL
ABORP
RODUCTIVITYG
ROWTH OVER1991‐2005 ... 56
F
IGURE1.10:
M
ODERN IMPERSONAL SERVICE EXPORT HAS GROWN FASTER THAN TRADITIONAL PERSONAL SERVICE EXPORT INS
OUTHA
SIA... 57
F
IGURE1.11:
I
NDIA HAS THE HIGHEST SHARE OFIT‐
ENABLED SERVICES EXPORTS ... 58F
IGURE1.12:
I
NDIA’
S SPILLOVER FROM SKILL INTENSIVE(IT)
TO LESS SKILL INTENSIVE SERVICE EXPORT,
(BPO) ... 62
F
IGURE1.13:
S
ERVICES ARE LESS VOLATILE COMPARED TO GOODS ... 63F
IGURE1.14:
C
APITAL INFLOWS INTOS
OUTHA
SIA—R
EMITTANCES ARE LESS VOLATILE COMPARED TO PORTFOLIO ANDFDI
INVESTMENT FLOWS ... 65F
IGURE1.15:
M
ODERN TRADABLE SERVICE IS CONCENTRATED IN THE LEADING STATES OFI
NDIA,
2005 ... 68
F
IGURE1.16:
P
OVERTY REDUCTION IS STRONGLY ASSOCIATED WITH SERVICE SECTOR GROWTH... 69
F
IGURE1.17:
S
ERVICE OUTPUT GROWTH IS A BIG CONTRIBUTOR TO POVERTY REDUCTION INI
NDIA ... 70F
IGURE1.18:
J
OBC
REATIONR
ATES INA
GRICULTURE,
I
NDUSTRY ANDS
ERVICESS
ECTORS,
1990‐2006 ... 72
F
IGURE1.19:
I
NDIA:
J
OB CREATION IN MODERN SERVICE SECTOR IS GROWING FASTER THAN IN TRADITIONAL SERVICES(1983=1) ... 73
F
IGURE1.20:
G
ROWTH INA
VERAGED
AILYE
ARNINGS INI
NDIA(1999‐2000/2004‐05) ... 74
F
IGURE1.21:
F
EMALE EMPLOYMENT GOES HAND IN HAND WITH INCREASED SERVICE EMPLOYMENT... 76
F
IGURE1.22:
F
EMALE LABOR FORCE PARTICIPATION BY SECTOR INI
NDIA ANDP
AKISTAN... 77
F
IGURE1.23:
P
ROPERTYR
IGHTSI
NSTITUTIONS ANDS
ERVICE OUTPUT PER CAPITA INS
OUTHA
SIA ... 81F
IGURE1.24:
C
ONTRACTINGI
NSTITUTIONS ANDS
ERVICEO
UTPUT PER CAPITA... 82
F
IGURE1.25:
S
ERVICEG
ROWTH INS
OUTHA
SIA HAS NOT BEEN CONSTRAINED BY RESTRICTIVE LABOR LAWS ... 82F
IGURE2.1:
S
TRUCTURE OFGDP
S
OUTHA
SIA VERSUSE
ASTA
SIA ... 95F
IGURE2.2:
S
TRUCTURE OFE
MPLOYMENTS
OUTHA
SIA VERSUSE
ASTA
SIA... 96
F
IGURE2.3:
E
VOLUTION OFS
ECTORS
HARES OFGDP,
S
OUTHA
SIA,
1980‐2005 ... 100
F
IGURE2.4:
G
ROWTH INL
ABORP
RODUCTIVITY,
S
ECTOR ANDR
EALLOCATIONE
FFECTS,
1990‐2006 ... 109
F
IGURE2.5:
C
OMPOSITION OFS
ERVICESGDP
BYC
OUNTRY,
2005‐06 ... 111
F
IGURE3.1:
A)
T
RANSMISSION AND DISTRIBUTION LOSSES OF ELECTRICITY,
B)
T
ERTIARY EDUCATION ... 138F
IGURE3.2:
A
VERAGE COST OF TELEPHONE CALL TO THEUS
($
PER3
MINUTES) ... 140
F
IGURE3.3:
A
VERAGEG
ROWTHR
ATE OFB
USINESSS
ERVICEE
XPORTS FORS
ELECTEDC
OUNTRIES DURING1995‐2005 ... 140
F
IGURE3.4:
L
ARGESTI
NSOURCINGC
OUNTRIESB
ASED ONA
MITI ANDW
EI(2005) ... 141
F
IGURE3.5:
C
ATCHING UPA
MONGI
NDIA’
SL
ARGESTS
ERVICEE
XPORTINGC
ITIES... 144
B OXES
B
OX1.1:
G
ROWTH OF THEG
LOBALIT
S
ERVICEI
NDUSTRY INI
NDIA ... 45B
OX1.2:
T
HER
OLE OFS
ERVICES INP
OVERTYR
EDUCTION INI
NDIA... 71
B
OX3.1:
M
ARKETA
CCESS ANDS
PATIALE
CONOMICD
EVELOPMENT INS
OUTHA
SIA ... 134B
OX3.2:
NEG
ANDT
RADABLES
ERVICES:
ANO
VERVIEW OFR
OBERT‐NICOUD(2008) ... 142
A CKNOWLEDGMENTS
This report was prepared by a team led by Ejaz Ghani (SASPF, World Bank) and
consisting of Maarten Bosker (Utrecht University), Barry Bosworth (Brookings Institute),
Caroline Cecot (Vanderbilt University), Carl Dahlman (Georgetown University), Rafiq
Dossani (Stanford University), Christopher Findlay (University of Adelaide), Harry
Garretsen (University of Groningen), Homi Kharas (Brookings Institute), Annemie
Maertens (Cornell University), Saurabh Mishra (SASPF, World Bank), Sanket
Mohapatra (DECPG, World Bank), Caglar Ozden (DECRG, World Bank), Scott
Wallsten (Technology Policy Institute), Yahua Zhang (Consultant, World Bank). It was
edited by Marie Damania and formatted by Ekaterina Stefanova. We would like to thank
Sadiq Ahmed, Ernesto May, and Miria Pigato for their helpful insights.
List of Abbreviations
ADB Asian Development Bank MFN Most Favored Nation
AICTE All India Commission on Technical
Education MNA Middle East and North Africa
ASEAN Association of South East Asian
Nations NAFTA North American Free Trade Agreement
BPO Business Process Outsourcing NAICS North American Industry Classification System
BTRC Bangladesh Telecommunication
Regulatory Commission NEG New Economic Geography
CRM Customer Relationship Management NGO Non-government Organization CRS Computer Reservation System NTA Nepal Telecommunications Authority
EAP East Asia Pacific OECD Organization for Economic Co-
operation and Development ECA Europe and Central Asia OUSL Open University of Sri Lanka ECOWA
S Economic Community of West
African States POEA Philippines Overseas Employment
Administration
FDI Foreign Direct Investment PTA Pakistan Telecommunication Authority FERA Foreign Exchange Regulation Act RCA Revealed Comparative Advantage
GATS General Agreement on Trade in
Services SA South Asia
GATT General Agreement on Tariffs and Trade
SAARC South Asian Association for Regional Cooperation
GCC Gulf Cooperation Council SSA Sub-Saharan Africa
IATA International Air Transport
Association STPI The Software Technology Parks of
India ICAO International Civil Aviation
Organization TAM Telecommunications Authority of
Maldives ICT Information and Communications
Technology
TFP Total Factor Productivity IIS Indian Institute of Science TRAI Telecom Regulatory Authority of India IIT Indian Institute of Technology TRCSL Telecommunications Regulatory
Commission of Sri Lanka ILO International Labor Organization UNCTA
D United Nations Conference on Trade and Development
ITES Information Technology Enabled Services
UNESCA P
United Nations Economics and Social Commission in Asia and the Pacific ITU International Telecommunications
Union UNESCO United Nations Educational, Scientific
and Cultural Organization JFICT Japan Fund for Information and
Communication Technology UNIDO United Nations Industrial Development Organization
LAC Latin American Countries WDI World Development Indicators
LFS Labor Force Survey WTO World Trade Organization
T HE S ERVICE R EVOLUTION IN S OUTH A SIA :
A N O VERVIEW
Ejaz Ghani and Homi Kharas
1A. I NTRODUCTION
1. The story of Hyderabad—the capital of the Indian state Andhra Pradesh—is truly inspiring for late-comers to development. Within two decades, Andhra Pradesh has been catapulted straight from a poor and largely agricultural economy into a major service center. It has transformed itself from a lagging into a leading region. Fuelled by an increase in service exports of 45 times between 1998 and 2008, the number of information technology companies in Hyderabad increased 8 times, and employment increased 20 times.
2. Service-led growth has mushroomed in other parts of India and South Asia as well. Indeed, growth in the services sector has enabled South Asia to grow almost as fast as East Asia in this century, with growth of just under 7 percent annually between 2000 and 2007. Growth rates in South Asia and East Asia have converged. The two fastest growing regions in the world, however, have very different growth patterns. While East Asia is a story of growth led by manufacturing, South Asia has thrived on service-led growth.
3. The South Asian experience of growth in the 21st century is remarkable because it contradicts a seemingly iron law of development that has held true for almost two hundred years since the start of the Industrial Revolution. This law—which is now conventional wisdom—says that industrialization is the only route to rapid economic development. It goes further to say that as a result of globalization the pace of development can be explosive. But the potential for explosive growth has until now been distinctive to manufacturing (UNIDO 2009). This is no longer the case. The South Asian experience suggests that a Services Revolution—rapid growth and poverty reduction led by services—is now possible. This can fundamentally change the pattern of development for many developing countries.
4. What is this Services Revolution and what has led to it? Can services be a driver of growth, job creation, and poverty reduction? What are the location and spatial characteristics of services? Is there a role for exports in sustaining service-led growth over the long run? What kind of infrastructure, including education, do developing countries need to sustain service-led growth? This volume is all about answering these questions based on a fresh look at what has happened in South Asia over the last two decades.
1
We are grateful to Lakshmi Iyer for her contribution to the overview, and to Saurabh Mishra for research
support. We would also like to thank a number of colleagues for useful comments at the review meeting
including S. Ahmed, R. Anand, P. Banerjee, D. Biller, C. Dahlman, S. Devarajan, P. Dongier, M. Engman,
M. Haddad, M. Kawai, Justin Yifu Lin, E. May, A. Mattoo, I. Nabi, M. Pigato, J. Sebastian Saez, S. Yusuf,
E. Lim, and G. Zannini. The views expressed here are not necessarily those of the World Bank. Any
remaining errors are our responsibility.
5. The Services Revolution could upset three long-held tenets of economic development. First, services have long been thought to be driven by domestic demand.
They could not by themselves drive growth, but instead followed growth. In the classical treatment of services, any attempt to expand the volume of services production beyond the limits of domestic demand would quickly lead to a deterioration in the price of services, hence a reduction in profitability, and hence the impulse towards expanded production would be choked off.
6. Second, services in developing countries were considered to have lower productivity and lower productivity growth than industry. It is hard to improve the labor productivity of a symphony (or, as it turns out, of a government which increasingly dominates service sectors). As economies became more service oriented, their growth would slow. For rich countries, with high demand for various services, the slowdown in growth was an acceptable consequence of the higher welfare that could be achieved by a switch towards services. But for developing countries, such a trade off was thought to be inappropriate.
7. Third, services jobs in developing countries were thought of as menial, and for the most part poorly paid, especially for low skilled workers. As such, service jobs could not be an effective pathway out of poverty.
8. It is these three beliefs that the Services Revolution that has started across South Asia challenges. In this volume we show that growth has in fact been led by services, that labor productivity levels in services in South Asia are above those in industry, and that productivity growth in South Asia’s service sectors matches labor productivity growth in manufacturing of successful East Asian countries. Furthermore, we suggest that services-led growth in South Asia has been effective in reducing poverty.
9. South Asia’s experience offers hope that globalization can indeed be a force for development in many more countries. The marginalization of Africa during a period when China and other East Asian countries grew rapidly led some to wonder if late- comers to development were not doomed to failure. The process of globalization in the late 20
thcentury led to a divergence of incomes between those who industrialized and broke into global markets and a “bottom billion” of people in some 60 countries where incomes stagnated for twenty years (Collier 2007). It seemed as if the “bottom billion”
would have to wait their turn for development, until the giant industrializers like China became rich and uncompetitive in labor-intensive manufacturing.
10. The promise of the Services Revolution is that countries do not need to wait to get
started with rapid development. There is a new boat that development late-comers can
take. The globalization of service exports provides alternative opportunities for
developing countries to find niches, beyond manufacturing, where they can specialize,
scale up and achieve explosive growth, just like the industrializers. The core of our
argument is that as the number of goods and services produced and traded across the
world expands with globalization, the possibilities for all countries to develop based on
their comparative advantage expand. That comparative advantage can just as easily be in services as in manufacturing or indeed agriculture. We do not argue for services and against manufacturing or agriculture, but do argue against the long-held proposition that industrialization is the only route to economic development.
B. T HE S ERVICES R EVOLUTION
11. Services have characteristics that differ significantly from goods. Goods are physical things that can be put in a box and traded. They can be made anywhere, at any time, and at any scale. More and more different goods are produced each year as firms develop new products and as production processes are broken down into individual parts and components. With a growing number of goods, productivity can rise because of specialization (a finer division of labor) and scale (falling unit costs of production).
Trade in goods allows even small countries to find a niche in global markets where they can be competitive. The East Asian countries are exemplars of countries which have developed rapidly on the basis of this simple proposition.
12. Services are difficult to place in a box because they are bound by time and proximity. For example, eating in a restaurant, getting a haircut, having a medical check- up, or seeking a loan from a bank, all require face to face transactions (Baumol 1967).
This makes it difficult to trade services. They are produced where and when demand is present.
13. However, technological changes (telephone and internet) and what Bhagwati (1984) has called splintering and disembodiment of services, have made many services tradable, just like manufactured goods. These services, called modern impersonal progressive services,
2include communication, banking, insurance, and business related services. They are being created by three global forces—technology, transportability, and tradability—the 3Ts that are driving the Services Revolution.
14. Technology, especially information and communications technology (ICT), has given services a physical presence. They can be produced and stored as a series of ones and zeros in digital format. Banking and loan transactions can now be conducted online.
A medical check-up may still require a meeting with a doctor, but the results of an X-ray may be reviewed by a radiologist in a different country, the details of the examination may be transcribed by a person working in a different time zone, and medical records may be stored and updated on a remote server.
15. Thanks to telephone lines and the internet, these modern services can also be easily transported today over long distances with little or no degradation in quality (Baumol 1986). This is the second T, transportability, which has meant that services are no longer restricted by time and space. One indicator of the cost of transporting services is the average cost of an international telephone call to the United States (Figure 1). For most developing countries, this has fallen by 80 percent or more over the last decade, a
2
Baumol (1984).
decline in cost which is much more rapid than the fall in transport costs for goods. Even more significant is the decline in cost and increased access of broadband internet.
Perhaps as important as cost is the speed, clarity, and reliability with which information can now be transported.
Figure 1: Average Cost of Telephone Call to the US ($ per 3 minutes)
Source: World Bank 2009a.
16. The third T, tradability, refers to the fact that many modern services, which are transported digitally, face few government barriers when they are moved from one country to another. There are no borders, customs, or tariffs on the international exchange of most modern impersonal services.
317. The 3Ts have unleashed a Services Revolution riding on the wave of the internet age. Service exports from developing countries almost tripled in the last ten years, growing by 11 percent annually from about $240 billion in 1997 to $692 billion in 2007.
Service exports now account for 5 percent of developing countries GDP (total GDP of developing countries was $14.3 trillion in 2007).
18. We have only witnessed the tip of the iceberg (Blinder 2006). The internet age will continue to transform more services into modern impersonal services. The range of business processes that can be globalized and digitized is constantly expanding:
3
United States Schedule of Specific Commitments under the General Agreement on Trade in Services (GATS) shows that there are no 'tariff' barriers per se on trade in modern impersonal services. Pricing and tax related measures may apply, but there are no 'at the border' tariffs, because modern impersonal service delivered electronically, are difficult to monitor, especially Mode 1 (cross-border) flow of services.
Traditional services (mode 2, 3, 4—see Chapter 1 for details) might have a tariff component, or a
regulatory related payment that can be considered to be equivalent to a tariff. For example, in air transport
services, foreign owned freight aircraft might have to pay a higher airport fee, and the difference between
airport fees for foreign and domestic providers can be said to be a tariff equivalent.
processing insurance claims; desktop publishing; the remote management and maintenance of IT networks; compiling audits; completing tax returns; transcribing medical records; financial research and analysis. The list of possible activities is almost endless.
19. The globalization of services will continue to be a strong force for two reasons.
First, services account for more than 70 percent of global GDP, more than double in size compared to the manufacturing sector. So, there is tremendous scope for services globalization. Second, the cost differential in the production of services across the world is enormous. In the past, the only option to narrowing such cost differentials was through migration, but migration has been heavily regulated and global international migration has remained steady at about 3 percent for decades. Now that service providers can sell services without crossing national borders by making use of the internet (outsourcing), the scope for exploiting cost differentials is much higher. What is more, it is very hard for governments to regulate modern impersonal services, so prospects for rapid expansion in service exports are good.
20. Modern impersonal services have many features in common with manufacturing.
Like manufacturing, they benefit from technological advances that generate productivity growth year after year. They exhibit similar tendencies for scale and agglomeration economies. Service producers can bring down unit costs by expanding operations. They benefit from being in close proximity to one another as that creates a pool of well-trained workers. They are labor intensive.
21. But there are also differences. Modern services are more skill intensive than other types of economic activity. They require excellence in telecommunications. Whereas traded goods move by ship, air, and road, globally traded modern impersonal services are delivered using telephone lines or the internet.
22. What the Services Revolution has done is open up many more niches for countries through which they can leverage the global economy. Each country should try its best to take advantage of these opportunities, whether in manufacturing or services, exploiting comparative advantage. What the South Asian experience shows is that the opportunities in modern services are sufficiently large to drive development of the whole economy.
23. As yet, modern impersonal services are only a small part of total services. The
sector is still dominated by traditional personal services which include trade, hotel,
restaurant, beauty shops, barbers, transport, and public administration. The only way for
these services to be traded is for the service providers themselves to move to where
demand is located. But migration faces many barriers. It is costly and subject to major
government regulation. Yet South Asia benefits handsomely from its ability to send
migrants abroad and receive remittances from them.
C. S ERVICES - LED G ROWTH
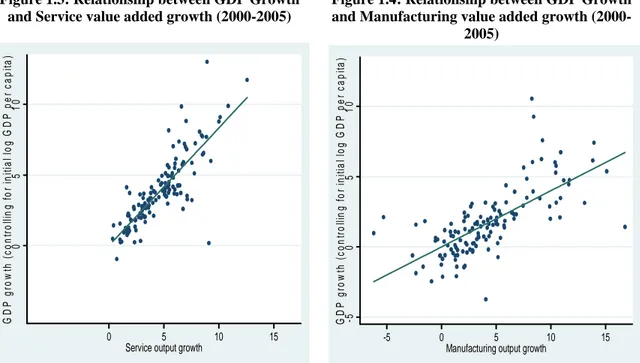
24. The modern service sector has become an important driver of growth in both developed and developing countries. Figure 2 compares what has happened in some 136 countries between 2000 and 2005 in terms of real GDP growth, shown on the vertical axis and service value added growth, shown on the horizontal axis. Each point represents one country. The positive relationship between the two variables implies that countries with high growth in services also tend to have high overall economic growth or conversely that countries with high overall economic growth have high services growth.
One cannot identify causality from a regression like this. If services have a high income elasticity of domestic demand, then we would expect higher overall growth to be associated with higher services sector growth. But we will also show below that high service growth is also associated with high service export growth. This suggests that it is services that have been driving overall economic growth rather than vice versa.
Figure 2: GDP Growth and Service value added growth (2000-2005)
Figure 3: GDP Growth and Manufacturing value added growth (2000-2005)
Source: Chapter 1, authors calculation using data from World Bank, World Development Indicators.
Note: Each point in the chart corresponds to 5 year growth during 2000-2005 for a specific country. GDP
growth rates control for level of initial income per capita. All values are in constant 2000 US$. Growth rates are compounded annual averages. The sample consists of 134 countries.
25. Exactly the same exercise is shown in Figure 3 for the relationship between manufacturing growth and overall economic growth. Again, there is a positive relationship which probably runs from manufacturing growth to overall growth. This is the relationship which has been reported to emphasize the importance of manufacturing for growth (UNIDO, 2009). Comparing the two graphs, it is clear that the slope is steeper in Figure 2. That suggests that the effect of services growth seems to be stronger than the effect of manufacturing growth on aggregate economic growth.
0510GDP growth (controlling for initial log GDP per capita)
0 5 10 15
Service output growth
-50510GDP growth (controlling for initial log GDP per capita)
-5 0 5 10 15
Manufacturing output growth
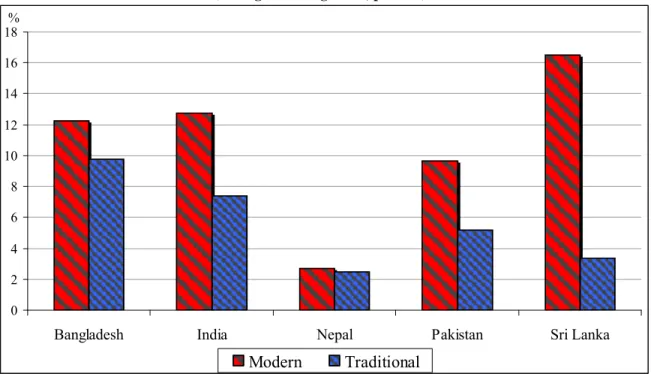
26. The service sector has become particularly important in South Asia, growing from less than 40 percent of GDP in 1980 to more than 50 percent of GDP in the region in 2005 (Figure 4). This is not limited to a specific country: the share of services in GDP was more than 50 percent in India, Pakistan, Bangladesh, and Sri Lanka and 49 percent in Nepal. The trend over time to a higher service sector share shows that higher real growth in services has not been offset by price declines. Figure 4 also shows that South Asia has a higher share of services, and more rapid service sector growth, than East Asia, although the latter is richer and has grown faster over time. That suggests that services are not simply responding to domestic demand (which would be higher in East Asia), but also to export opportunities.
Figure 4: Service is the largest sector in South Asia (share of sectors in GDP)
Source: World Development Indicators, 2008.
27. Not only does the service sector form the bulk of the economy, services are the largest contributor to GDP growth as well. The service sector accounted for more than 50 percent of GDP growth in all South Asian countries (Figure 5). Its contribution to GDP growth is nearly twice that of industry. Further, the contribution of services to overall GDP growth has increased over time in India, Pakistan, and Sri Lanka. This is in sharp contrast to the East Asian countries shown in Figure 5 (China and Korea) where industry contributes between 40-50 percent to GDP growth.
28. The differences and similarities in service-led growth in South Asia and manufacturing-led growth in East Asia are explored in Chapter 1 by Ghani. He shows that while there is some evidence of convergence in growth patterns, there are also significant differences between the regions. In East Asia, services are also growing rapidly as a natural progression to improve the efficiency of inputs needed to sustain a dynamic manufacturing base. Finance, logistics, and trade services linked to manufacturing exports have grown rapidly. But manufacturing demand has not been the driver of growth in services in South Asia. India has a small manufacturing base and an even smaller manufacturing export platform. Yet, its services have exploded. In fact, India’s services growth has fuelled an expansion of manufacturing to satisfy the growing
0 10 20 30 40 50 60 70 80 90 100
1980 1990 2000 2005 1980 1990 2000 2005
Agriculture Industry Services
South Asia East Asia & Pacific
%
domestic demand for goods as incomes rise. Thus the difference between manufacturing growth and services growth in both East and South Asia have narrowed, but the drivers of growth remain distinct.
Figure 5: Service is the largest contributor to GDP growth in South Asia
(Sectoral contribution of service, industry, and agriculture to GDP growth, 1980-85, 2000-2007)
Source: World Bank 2008a.
29. But how dynamic is the service sector in South Asia? Can services productivity be as high as manufacturing productivity? Chapter 2 by Bosworth and Maertens documents in detail the contribution of the service sector to economic growth and employment generation in South Asia. Services were once thought of as stagnant and low productivity growth areas, without the dynamic externalities attributed to manufacturing. That was one reason why services were not thought of as a potential leading sector for development. In fact, the finding is that absolute levels of labor productivity are highest in the service sector for South Asian countries (Figure 6). Labor productivity is higher in the service sector than in the manufacturing sector for India, Nepal, Pakistan and Sri Lanka, in stark contrast to East Asian countries where the industrial sector has substantially higher productivity levels. Only Bangladesh and Bhutan in South Asia have higher labor productivity in industry than in services. Given that the process of development is one of transferring resources (largely labor) from low productivity areas to high productivity areas, it makes sense to interpret rapid South Asian growth as one of moving labor from low-productivity agriculture to high- productivity services.
30. Along with high levels of labor productivity in services, South Asia’s growth experience shows that the service sector displays significant productivity growth. In the post-2000 period, labor productivity growth has been higher in the services sector than in the manufacturing sector for India, Pakistan, and Sri Lanka (Figure 7). This is an important finding, since there needs to be high and sustained productivity growth in order for services to be a transformational growth engine for the whole economy.
0.00 10.00 20.00 30.00 40.00 50.00 60.00 70.00 80.00 90.00 100.00
1980-85 2000-07 1980-85 2000-07 1980-85 2000-07 1980-85 2000-07 1980-85 2000-07 1980-85 2000-07
India Sri Lanka Ba ngladesh Pakistan China Republic of Korea
Agriculture Industry Service
%
Figure 6: Labor Productivity Levels, by Sector, 2005 (PPP International Dollars per worker)
Source: Word Bank, World Development Indicators. Data for China is from 2004. The utilities industry in
Malaysia is included in services rather than industry.
Note: Labor productivity = Value added by sector / Employment in that sector.
Figure 7: Labor Productivity Growth is High in Service Sector, 2000-06
Source: Chapter 2.
31. We should note that the relatively recent development of the 3Ts—technology, transportability and tradability of services—means that the ability of services growth to drive overall economic growth is also a relatively new phenomenon. Tradability in particular means that there is a large global market available for services, and that prices will not decline even if volumes rise rapidly. In one of the most careful studies of total factor productivity growth (TFP) in China and India, Bosworth and Collins find that India managed to record a TFP growth of 2.4 percent in services between 1980 and 2006—a level that could sustain rapid aggregate growth and twice the level of TFP growth in either agriculture or industry. By contrast, China, despite more rapid aggregate growth over this period, managed a service sector TFP growth of only 2 percent per year, slower than that in either agriculture or industry.
0 10,000 20,000 30,000 40,000 50,000 60,000
Agriculture Industry Services
-1 0 1 2 3 4 5
Bangladesh India Pakistan Sri Lanka
Annual labor productivity growth rate (%)
Agriculture Industry Services
32. One reason for rapid productivity growth in services in South Asia is that these economies are starting from a low technological base compared to international best practice. There can thus be rapid catch-up just like in manufacturing. Beyond this, services also display potential for productivity gains from learning, networking, and knowledge spillovers. Modern impersonal services tend to cluster together to take advantage of scale economies and externalities.
33. It is easier for service firms to cluster than for manufacturing firms. Services firms take up less space, do not cause traffic jams when shipping their goods, and pollute less. This is not only true for developed countries, with notable tradable services hubs in New York, London, Silicon Valley, but also in developing countries, like in Hyderabad.
34. These issues are explored in Chapter 3 by Bosker and Garretsen. They show that thick markets for services attract more service firms and workers. Service corridors arise, just like manufacturing clusters. These benefit from externalities such as knowledge spillovers between firms, workers, and universities. Productivity enhancing externalities are far more prominent in service corridors compared to goods clusters, as services tend to be “non-rival” goods.
D. S ERVICE - LED G ROWTH & P OVERTY REDUCTION
35. Despite concentrated location, the benefits of service growth appear to be widely distributed. Globally, there is cross-country evidence from some 50 developing countries that poverty reduction is associated more strongly with growth in the service sector than with growth in manufacturing or agriculture.
36. Table 1 reports the cross-country regression results of change in poverty headcount regressed on growth in agriculture, manufacturing, and services output.
Growth in services output is significantly associated with poverty reduction in developing countries, whereas growth in agriculture and growth in manufacturing is not significant.
The regression controls for initial conditions. When countries are richer initially, the speed of poverty reduction is lower (Row 1); when they have higher initial poverty, they make faster progress in poverty reduction (Row 2). Controlling for all variables, South Asian countries like India and Sri Lanka have, however, had lower rates of poverty reduction than expected based on other countries’ experiences.
37. Visually, we can plot the change in poverty between 1990 and 2005 against the
growth of services (Figure 8). The negatively sloped line indicates the strong association
between services output growth and poverty reduction for our sample of 49 developing
countries.
Table 1: Cross-Country Results on Change in Poverty Headcount Regressed on Agriculture, Manufacturing, and Services Output Growth, for 50 Developing Countries (1990-2005)
Source: Chapter 1.
Notes: Robust standard errors are reported in parenthesis.
*** Represents significance at 1%, ** represents significance at 5%, * represents significance at 10%.
Country size is measured by area in square kilometers
.The dependent variable is percentage of population below $1 (PPP) per day.
Figure 8: Change in Poverty and Growth in Service Output (1990-2005)
Source: World Bank, World Development Indicators.
Note: Change in poverty (1991-2205) after controlling for initial level of poverty, and growth in
agricultural output, manufacturing output, and service output. For more information on the regression, please see Poverty Regression, Table 1.9 column (1) in Chapter 1. Poverty is defined as percentage of population below $1 (PPP) per day.
Ukraine
Venezuela
Central African Republic Guinea-Bissau
Cote d'IvoireKyrgyzstan Paraguay
Uruguay Argentina El Salvador
Madagascar Zambia
Colombia
Hungary Kenya
Guinea Lesotho
Thailand Bolivia
South Africa Peru
Slovenia
Senegal Panama Honduras
Iran (Islamic Republic of) Belarus
Egypt
Indonesia Costa Rica
Bangladesh Sri Lanka
Tunisia Estonia Chile
MalaysiaDominican Republic Latvia
Mauritania Burkina Faso
Mongolia
Ethiopia
Lao People's Democratic Republic Swaziland
Uganda India
Azerbaijan Cambodia
China
-30-20-10010Change in poverty
-5 0 5 10
Service output growth
38. These results are further confirmed when we examine the impact of sectoral growth patterns on poverty reduction within India, using a panel of Indian state data from 1994 to 2005. Our results show that the trend growth in the service sector among Indian states is associated with a decrease in the trend of the headcount poverty rate of almost 1.5 points during the sample period. In fact, the service sector is the only sector showing a statistically significant association with poverty reduction. Similar results are found when differentiating into rural and urban poverty. Service sector growth is strongly associated with a reduction in both urban and rural poverty rates. Some states like Andhra Pradesh, Karnataka and Tamil Nadu, have experienced a significant decrease in urban poverty that is associated with an increase in their service sector share. In contrast, other states like Orissa that have experienced a weaker services growth have experienced a more disappointing record of poverty alleviation (Figure 9).
Figure 9: Service output growth is a big contributor to poverty reduction in India (Change in poverty and change in service outputs at the state level in India, 1994-2005)
Source: Chapter 1.
39. Services have emerged as a key driver of poverty reduction in South Asia.
Historical evidence in India from the 1970s to the early 1990s has shown agricultural growth to be a major factor in reducing poverty. Indeed for decades, poverty reduction in India has been synonymous with rural, and in particular, agricultural growth. But since the 1990s agriculture has lagged other sectors, shrinking in its contribution to GDP, while the contribution of services to overall GDP growth has exploded. That poverty reduction has continued despite a slowdown in agriculture points to the emergence of new drivers of poverty reduction.
40. Services are contributing to poverty reduction via two channels. Directly, they provide the largest source of new job growth. Indirectly, they provide the income that, when spent, drives further demand for goods and services and jobs to produce these.
Figure 10 shows that the service sector in India and Pakistan has had the fastest growth in
Andhra Pradesh Assam
Bihar
Chhattisgarh
Gujarat
Haryana
Himachal Pradesh Jharkhand
Karnatak
Kerala Madhya Pradesh
Maharashtra Orissa
Punjab Rajasthan
Tamil Nadu Uttar Pradesh
West Bengal
-.5.03
Rate of change in poverty rate
-.23 1.17
Rate of change in service output
the number of jobs created in recent years, while for Bangladesh and Sri Lanka job creation in services is somewhat slower than in manufacturing. A recent World Bank study on India also reported faster changes in employment away from agriculture and into construction and trade, hotels and restaurants and transport and communications (World Bank, 2009d): by 2006, 26 percent of all jobs in India were in the service sector.
Chapter 2 provides further details on the job creation trends in all South Asian countries.
Figure 10: Job Creation Rates in Agriculture, Industry and Services Sectors, 1990-2006
Source: Bangladesh: Labour Force Surveys, in Key Findings of Labour Force Survey and Statistical
Yearbook, various editions. India: Sivasubramonian: The Sources of Economic Growth in India 1950-1 to 1999-2000 for earlier years, and Bosworth, Collins and Virmani (2007) for the more recent period Pakistan:
LABORSTAT, ILO, 2008 and Handbook of Statistics on Pakistan Economy, Sri Lanka: up to 1989: KILM, from 1990 onwards Labour Survey Reports, various editions.
41. In addition to direct job creation, some estimates suggest that the indirect effect of a growing service sector can be larger than the direct effect. For instance, India’s IT industry association NASSCOM estimates that for every job created in the IT sector, four additional jobs are created in the rest of the economy due to high levels of consumption spending by professionals employed in this sector (NASSCOM and CRISIL 2007).
42. Service jobs are good jobs. Wage growth has been higher in the services sector than in manufacturing and agriculture in recent years in India (Figure 11). While manufacturing wages fell in the early 2000s in both rural and urban areas despite rapid economic growth, service sector wages in utilities, trade, transport, and even rural finance improved. In fact, in many sectors, rural wages may have increased faster than in urban areas, possibly reflecting the rising rural-urban migration over time that is taking place in India.
0 0.5 1 1.5 2 2.5 3 3.5 4 4.5 5
Bangladesh India Pakistan Sri Lanka
Compounded growth in job creation (%)