IHS Economics Series Working Paper 140
October 2003
Estimating the Impact of the Balassa-Samuelson Effect in Transition Economies
Adriana Lojschová
Impressum Author(s):
Adriana Lojschová Title:
Estimating the Impact of the Balassa-Samuelson Effect in Transition Economies ISSN: Unspecified
2003 Institut für Höhere Studien - Institute for Advanced Studies (IHS) Josefstädter Straße 39, A-1080 Wien
E-Mail: o ce@ihs.ac.atffi Web: ww w .ihs.ac. a t
All IHS Working Papers are available online: http://irihs. ihs. ac.at/view/ihs_series/
This paper is available for download without charge at:
https://irihs.ihs.ac.at/id/eprint/1517/
140 Reihe Ökonomie Economics Series
Estimating the Impact of the Balassa-Samuelson Effect in Transition Economies
Adriana Lojschová
140 Reihe Ökonomie Economics Series
Estimating the Impact of the Balassa-Samuelson Effect in Transition Economies
Adriana Lojschová October 2003
Institut für Höhere Studien (IHS), Wien
Institute for Advanced Studies, Vienna
Contact:
Adriana Lojschová
Department of Economics and Finance Institute for Advanced Studies Stumpergasse 56
1060 Vienna, Austria email: lojschov @ihs.ac.at
Founded in 1963 by two prominent Austrians living in exile – the sociologist Paul F. Lazarsfeld and the economist Oskar Morgenstern – with the financial support from the Ford Foundation, the Austrian Federal Ministry of Education and the City of Vienna, the Institute for Advanced Studies (IHS) is the first institution for postgraduate education and research in economics and the social sciences in Austria.
The Economics Series presents research done at the Department of Economics and Finance and aims to share “work in progress” in a timely way before formal publication. As usual, authors bear full responsibility for the content of their contributions.
Das Institut für Höhere Studien (IHS) wurde im Jahr 1963 von zwei prominenten Exilösterreichern – dem Soziologen Paul F. Lazarsfeld und dem Ökonomen Oskar Morgenstern – mit Hilfe der Ford- Stiftung, des Österreichischen Bundesministeriums für Unterricht und der Stadt Wien gegründet und ist somit die erste nachuniversitäre Lehr- und Forschungsstätte für die Sozial- und Wirtschafts- wissenschaften in Österreich. Die Reihe Ökonomie bietet Einblick in die Forschungsarbeit der Abteilung für Ökonomie und Finanzwirtschaft und verfolgt das Ziel, abteilungsinterne Diskussionsbeiträge einer breiteren fachinternen Öffentlichkeit zugänglich zu machen. Die inhaltliche Verantwortung für die veröffentlichten Beiträge liegt bei den Autoren und Autorinnen.
Abstract
The Balassa-Samuelson (BS) effect is usually considered as the prime explanation of the continuous real exchange rate appreciation of the central and east European (CEE) transition countries against their western European counterparts. This paper tries to explain relative price differentials observed over the past decade between four CEE economies - Slovakia, the Czech Republic, Hungary and Poland - and Euro area in terms of productivity growth differentials.
Using panel estimation techniques, we find strong empirical evidence in favour of the BS hypothesis. Furthermore, relaxing some of the assumptions (i.e. PPP holds for tradable goods) results in little support of BS hypothesis. Our estimates of the BS term suggest that the Balassa-Samuelson effect in these 4 CEE countries does not have to be as sizeable as other studies propose.
Keywords
Balassa-Samuelson effect, Purchasing Power Parity (PPP), real exchange rate appreciation, transition economies
JEL Classifications
E31, F31, C23
Comments
I would like to thank Walter Fisher for supervision, encouragement and useful discussion. I am grateful to Andrea Weber, Martin Wagner and Jaroslava Hlouskova for valuable comments. Moreover, I thank Jan Kuchta, Miroslav Kotov, Andrej Probst and Katarina Krivanska for help with data issues.
Contents
1 Introduction 1
2 PPP and Balassa-Samuelson effect 2 3 Analytical framework 3
3.1 The standard Balassa-Samuelson model ... 3
3.2 The first modification of Balassa-Samuelson model ... 6
3.3 The second modification of Balassa-Samuelson model ... 6
4 Empirical framework 7
4.1 The data and sectoral disaggregation ... 74.2 Various measures of productivity ... 8
4.3 Preliminary look at the data ... 9
4.4 Estimates of Balassa-Samuelson term ... 16
5 Conclusion 29
Appendix I. The first-order conditions 31 Appendix II. Economies and periods covered 33
References 34
1 Introduction
In the near future, some countries from Central and Eastern Europe will join the European Union and the enlargement process is likely to continue. Most transition economies have experienced prolonged and often massive real exchange rate appre- ciation with the greatest rate of appreciation taking place in the first few years of transition. A study by Halpern and Wyplosz (1997, 1998) on a set of selected tran- sition economies demonstrated that real appreciation might be labelled a stylized fact of transition. This finding has been later confirmed in various other studies (e.g. Rosati 1997, Desai 1998).
Recently, there is a fast growing empirical literature on transition economies concentrating both on relative price and real exchange rate developments related to the Balassa-Samuelson effect. According to the estimation techniques, recent papers attributable to real appreciation of EU accession countries’ currencies can be categorized into two main streams.
The first strand of literature considers ”standard” estimation methods (e.g. OLS, GLS, pooled estimation) and the estimates of productivity driven real apprecia- tion are approximately 3 per cent per annum in a number of transition economies (Simon and Kovacs 1998, Rother 2000, Halpern and Wyplosz 2001). All of the mentioned papers conclude that the Balassa-Samuelson effect plays an important role in explaining the real exchange rate appreciation of EU accession candidates.
By contrast, authors implementing ”sophisticated” cointegration techniques attain lower magnitude of estimates ranging from -0.2 to 1.5 % a year (Egert 2001, Jazbec 2001). These techniques (unit root tests, VAR-based cointegration proposed by Johansen) were designed to look for a long-run relationship and due to short time span data availability among EU accession countries are not recommended.
This paper addresses the question which factors might cause the stylized fact that the exchange rates of transition economies appreciate in real terms. This empirical study contributes to the debate on EU accession countries by investigating the Balassa-Samuelson effect for 4 CEE transition countries using detailed national accounts data for productivity and relative price measure. The contribution of this paper is twofold:
• to estimate the Balassa-Samuelson effect for 4 CEE transition countries (using
more complete and, thus, a ”better” measure of productivity, i.e., total factor productivity TFP instead of frequently used labour productivity) and to see to what extent a relative price differential between accession countries and EU area can be explained by a productivity differential;
• to relax some assumptions of the standard Balassa-Samuelson model (e.g.
PPP holds for tradable goods, wage equalization). None of the studies thus far attributable to CEE transition economies tried to evaluate the Balassa-Samuelson effect under these modified assumptions. This paper will attempt to fill this gap.
The remainder of this paper is structured as follows: Section 2 briefly dis- cusses the theoretical framework. Section 3 describes assumptions for the standard Balassa-Samuelson model and analytically derives the relationship between relative price differential and productivity differential under different assumptions. Section 4 presents the empirical framework, i.e., data and econometric technique employed.
Finally, Section 5 reviews the main findings.
2 PPP and Balassa-Samuelson effect
There are two alternative theories to explain real exchange rate movements. The first is Purchasing Power Parity
1(PPP) according to which the real exchange rate must be stationary. This implies there cannot exist persistent deviations from the real exchange equilibrium level, but only temporary ones. In this case PPP serves as a good first approximation to long-run behaviour.
The second, the Balassa-Samuelson hypothesis, which seeks to explain the per- sistence of real exchange rate changes, typically focuses on the tradebility of goods.
According to Balassa (1964) and Samuelson
2(1964), rapid economic growth is ac- companied by real exchange appreciation because of differential productivity growth between tradable and non-tradable sectors. Since the differences in productivity increases are expected to be larger in high growth countries, the Balassa-Samuelson prediction should be more visible among fast growing countries.
1The theory of Purchasing Power Parity predicts that real exchange rates should be equal to 1, or at least have tendency to return quickly to 1 when that long-run ratio is disturbed for some reason. Sometimes this version of PPP is calledabsolute PPP.Relative PPP is the weaker statement that changes in national price levels always are equal or, at least, tend to get equalized over sufficiently long periods (Obstfeld and Rogoff, 1996).
2Actually, the main motivation behind their model was to explain the persistent deviation from PPP. This framework was initially introduced by Harrod (1993) and some literature still refers to theHarrod-Balassa-Samuelson effect.
The productivity approach seems to be a natural candidate for analyzing real exchange rates in transition economies. The Balassa-Samuelson effect explains a tendency for countries with higher productivity in tradables, compared with non- tradables, to have a higher aggregate price level (Obstfeld and Rogoff, 1996).
Historically, productivity growth in the traded goods sector has been faster than in the non-traded goods sector. According to the theory of PPP, the prices of tradables tend to get equalized across countries, while the prices of nontradables do not. Increased productivity in the traded good sector will bid up wages in that sector and, with labour mobility, wages in the entire economy will rise. Producers of non-traded goods will be able to pay the higher wages only if there is a rise in relative price of non-traded goods. This will in general lead to an increase in the overall price level in economy.
3 Analytical framework
This section provides a benchmark model which will be a subject to several modifications. The first alternative specification is related to the labour markets and the second one to the traded goods sectors.
3.1 The Standard Balassa-Samuelson Model
To illustrate the Balassa-Samuelson effect, let us consider a traditional two- country model with two goods: traded (T ) and non-traded (N ). The ”standard”
Balassa-Samuelson model has three assumptions: first, capital is mobile, both in- ternationally and between sectors; second, labour is free to migrate between sectors but not between countries; and third, PPP holds only for tradable goods. The second assumption implies that wages tend to be equalized across sectors or, at least, their relative position remains constant.
To formalize this model, we specify that the aggregate price level is first decom- posed into its traded and non-traded components, both at home and in the foreign country:
p
t= αp
Tt+ (1 − α)p
Nt(1)
p
∗t= α
∗p
Tt ∗+ (1 − α
∗)p
Nt ∗(2)
where p
Ttdenotes the price of traded goods, p
Ntdenotes the price of non-traded
goods, the parameter α denotes the share of traded goods in consumption basket, and the asterix ” ∗ ” denotes foreign country.
The real exchange rate q
tis defined as the relative price of goods produced abroad (measured in domestic currency) to domestically produced goods:
q
t= (e
t+ p
∗t) − p
t(3) where e
tis the nominal exchange rate (expressed in units of the domestic currency per unit of the foreign currency). Then first differences of real exchange rate can be obtained:
4q
t= (4e
t+4p
Tt ∗− 4p
Tt) + [(1− α
∗)(4p
Nt ∗− 4p
Tt∗) − (1 − α)(4p
Nt− 4p
Tt)]. (4) If the PPP holds for tradables, i.e. 4p
Tt= 4e
t+ 4p
Tt ∗, then the first term on the right-hand-side of (4) disappears.
Assuming a small open economy framework, the output in each sector (Y
i, i = T, N ) is determined by a Cobb-Douglas production technology:
Y
tT= A
Tt(L
Tt)
γ(K
tT)
1−γ(5) Y
tN= A
Nt(L
Nt)
δ(K
tN)
1−δ(6) where K , L, A denote capital, labour and productivity. Each sector differs in the labour intensities γ and δ, which reflects the shares of labour in the traded and non-traded sectors, respectively.
Profit maximization implies that under perfect competition the interest rate R and the nominal wage in each sector W
T, W
Nfulfill following conditions
3:
R
t= (1 − γ)A
Tt( K
tTL
Tt)
−γ= P
REL(1 − δ)A
Nt( K
tNL
Nt)
−δ(7) W
tT= γA
Tt( K
tTL
Tt)
1−γ(8)
W
tN= P
RELδA
Nt( K
tNL
Nt)
1−δ(9)
where P
REL= P
tN/P
tTis the relative price of non-tradables. It is convenient to express these equilibrium conditions in logarithmic terms
4:
r
t= log(1 − γ) + a
Tt− γ(k
Tt− l
Tt) = p
REL+ log(1 − δ) + a
Nt− δ(k
Nt− l
tN) (10)
3SeeAppendix I.
4Throughout the paper, lower case letters refers to variables in logs.
w
tT= logγ + a
Tt+ (1 − γ )(k
tT− l
tT) (11) w
Nt= p
REL+ logδ + a
Nt+ (1 − δ)(k
tN− l
Nt) (12) where a
i, i = T, N represents total factor productivity in the sector concerned.
We follow the standard assumption that capital markets are perfectly competi- tive and integrated, so that the interest rate is given by the international financial market. As far as the labour market is concerned, we consider two alternatives.
In the ”standard” specification, we assume that wages tend to be equalized across sectors, i.e. w
Tt= w
Nt. By solving equations (10)-(12), we obtain the following (”domestic”) version of the Balassa-Samuelson hypothesis
5:
p
REL= p
Nt− p
Tt= c + δ
γ a
Tt− a
Nt(13) where c is a constant term which includes the real interest rate and factor intensities.
The equation (13) captures the Baumol-Bowen effect, which is closely related to but distinct from the Balassa-Samuelson effect. Baumol and Bowen (1966) argued that within a country there is a rising trend in the ratio of non-tradable to tradable prices, which is caused by higher productivity in the traded goods sector than in non-traded goods sector
6(Obstfeld and Rogoff, 1996).
By substituting (13) into (4) and using PPP for tradables one obtains the ”stan- dard” specification of the Balassa-Samuelson hypothesis:
4p
t− 4p
∗t= 4e
t+ (1 − α)[ δ
γ 4a
Tt− 4a
Nt] − (1 − α
∗)[ δ
∗γ
∗4a
Tt ∗− 4a
Nt ∗] (14) The change in the relative price differential in an accession country and the Euro area can thus be expressed as a sum of the nominal exchange rate of the accession country’s currency vis-a-vis the euro, 4e
t, and the productivity growth differentials between the traded and non-traded goods sectors in the accession country (4a
Tt− 4a
Nt) and the Euro area (4a
Tt ∗− 4a
Nt ∗) weighted by a share of non-tradables in consumption basket (1 − α).
By imposing the simplifying assumption that both countries’ sectoral outputs are proportional to same production function, and rearranging terms, we can show
5SeeAppendix I.
6It is plausible to assume that δ/γ≥1, i.e. non-traded goods are more labour intensive than traded. Then higher productivity in traded good sector than in non-traded sector,aTt > aNt , will cause appreciation of the relative price of non-tradables,pNt > pT.
that home country (accession country) will experience a real appreciation (a rise in its relative price level) if productivity growth differential in tradables exceeds productivity growth differential in non-tradables.
3.2 The First Modification of Balassa-Samuelson Model
An alternative specification captures two facts about labour markets. First, labour is not homogenous due to differences in skills or human capital. Second, we also know that labour is not fully employed, due to frictions or rigidities. In order to take in account this possibility, we obtain an ”extended” version of equation (13):
p
REL= p
Nt− p
Tt= c + e δ e
γ a
Tt− a
Nt− e δ(w
tT− w
Nt) (15) where the additional term on the right-hand-side is the wage differential
7, and e δ ≡ 1 − δ, resp. e γ ≡ 1 − γ are the capital intensities.
By substituting (15) into (4) and using PPP for tradables we obtain the ”ex- tended” specification of the Balassa-Samuelson hypothesis:
4p
t− 4p
∗t= 4e
t+ (1 − α)[ δ e e
γ 4a
Tt− 4a
Nt] − (1 − α
∗)[ δ e
∗γ f
∗4a
Tt ∗− 4a
Nt ∗] + δ e
∗(1 − α
∗)(4w
tT∗− 4w
Nt ∗) − δ(1 e − α)(4w
tT− 4w
Nt) (16) where the change in the relative price differential in an accession country and the Euro area depends on sectoral productivity growth - and wage growth - differentials in the two countries concerned.
3.3 The Second modification of Balassa-Samuelson Model
None of the studies thus far tried to estimate equation (4) without assuming that PPP holds for tradables. To extend the research in this area, we will relax the assumption of PPP for tradables in an empirical investigation. In reality, PPP might fail to hold for several reasons, e.g., different consumption baskets across countries, trade barriers, imperfect competition. According to Engel (1999), the deviation in the real exchange rate (failure of PPP) can be decomposed into two types: first, deviations in traded goods prices across countries; second, deviations in relative price of traded to non-traded goods prices within countries. His results
7SeeAppendix I.
were that the deviations in real exchange rate are due to the first type. So it seems to be reasonable to focus on a ”full” version of equation (4) that does not assume that the first term on the right-hand-side disappears due to PPP.
In this more general case, we obtain a ”full” specification of the Balassa-Samuel- son hypothesis:
4p
t−4p
∗t= 4p
Tt−4p
Tt ∗+(1−α)[ δ
γ 4a
Tt−4a
Nt]−(1−α
∗)[ δ
∗γ
∗4a
Tt∗−4a
N∗t] (17) where the change in the relative price differential in an accession country and the Euro area depends on sectoral productivity growth - and tradable price - differen- tials in the two countries concerned.
4 Empirical framework
This section presents a brief discussion of the data construction, implemented methods and empirical results.
4.1 The Data and Sectoral Disaggregation
Many empirical studies related to the Balassa-Samuelson effect suffer to varying degrees from data measurement problems. First, many authors use annual data and try to resolve the problem of a short time span by cross-section analysis. Such pooled time series contain very heterogeneous economies, from advanced EU acces- sion candidates to less developed countries. To reduce disparity between countries, we will empirically investigate the Vysegrad Pact countries: Slovakia, the Czech Republic, Hungary and Poland, which seem to be economically and historically similar.
This paper tests empirically the Balassa-Samuelson hypothesis using quarterly data
8covering period from 1995:1 to 2002:4. We eliminated the early years of tran- sition (late 80’s and early 90’s), during which price and productivity developments were much more driven by initial reforms rather than by the Balassa-Samuelson effect itself.
Second, the sectoral data are highly aggregated. One crucial issue is how to define the traded and non-traded sector. The traded good sector usually includes industry:
manufacturing, mining, construction, and some authors add gas, electricity and
8For more details on the data, particularly their definitions and sources seeAppendix II.
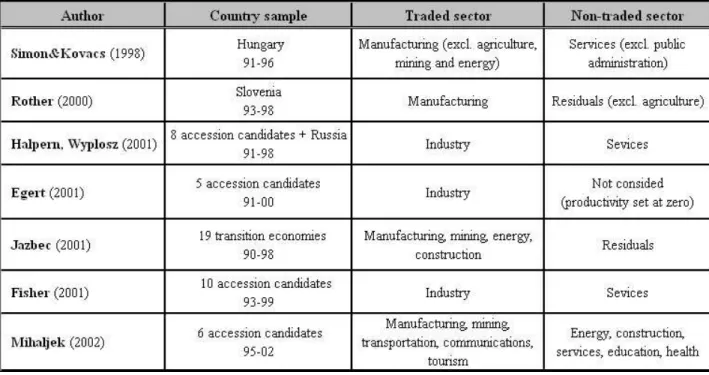
water supply, industries whose output is to a small extent traded. The non-traded sector covers all services, some authors involve also construction, and gas, electricity and water supply. No consensus has been reached in the literature on this issue (see Table 1).
Categorization in this paper partially corresponds to the one used by Simon and Kovacs (1998), we classify manufacturing as a tradable sector (we excluded mining, and water, electricity and water supply), and services and construction as non- tradables. We excluded agriculture from tradables because this sector is distorted by the large number of the seasonal and part-time workers. The reason for the elimination of the other sectors was the limited data availability on productivity.
Table 1. An overview of sector classification
4.2 Various Measures of Productivity
There are two main measures of productivity. First, labour productivity is labelled as ”output per worker” or ”output per hour”, and thus measures the average num- ber of units of goods or services produced per hour worked or per worker. Labour productivity is frequently used for analysis attributable to the Balassa-Samuelson effect, because it is relatively simple to estimate
9.
9All previously mentioned authors are using ”production divided by employment” as measure
Labour productivity is a partial factor productivity measure, i.e. it is the ratio of output per unit of labour input only, holding other economic factors of production such as land, capital, and materials constant. On the other hand, total factor productivity (TFP) is a more complete measure of productivity that relates output not only to labour input, but to a combined measure of all inputs, including capital and material inputs.
TFP growth is closely related to the theoretical framework of Solow residuals, which represents the unexplained part of output growth. In principle, they are the same
10, but OECD International Sectoral Database provides TFP with standar- dized labour weights of 70 per cent for all sectors and countries, with the exception of the following sectors: ”electricity, gas and water”, ”mining”, ”finance, insurance, real estate and business services” and ”real estate”, where a labour weight of 33 % is used.
In this paper, we estimate the Balassa-Samuelson term for 4 EU accession can- didates using more complete and, thus, ”better” measure of productivity; i.e., TFP instead of frequently used labour productivity. In this respect, this study tries to give more precise results.
4.3 Preliminary Look at the Data
Real exchange rates certainly belong to those macroeconomic variables whose pattern of movement seems to be a diagnostic for transition economies: as a rule, they appreciate in real terms.
for productivity, exception among them is MacDonald and Ricci (2001), they employed TFP obtained from OECD International Sectoral Database.
10In order to get a closer look at the derivation of TFP, we provide formula used by OECD:
T F P = [ V A
ET(w)∗GCS(1−w)]/T F P0
whereT F P denotes total factor productivity,GCS gross capital stock,V Agross value added, w standardized labour share weights andT F P0total factor productivity, 1995 value. In the context of our model, the procedure for Solow residuals would require the estimation of production function for traded sector:
logYtT =γlogLTt + (1−γ) logKtT +u1t and similarly, for non-traded:
logYtN =δlogLNt + (1−δ) logKtN +u2t whereu1t, u2t are Solow residuals.
In order to demonstrate a real appreciation,
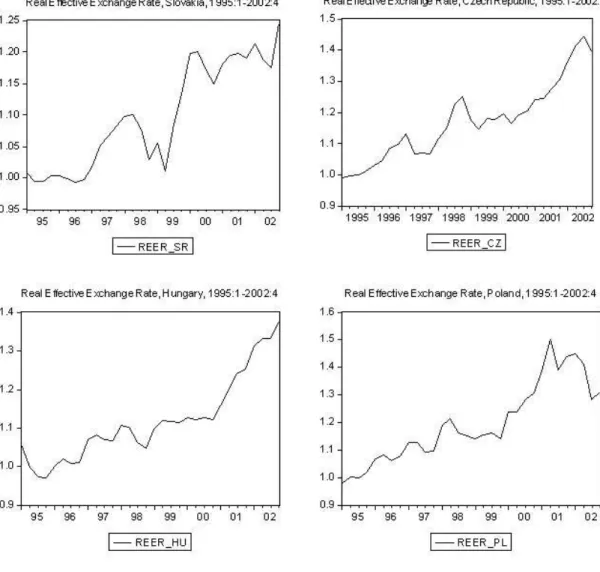
11we focus our attention on evolu- tion real exchange rate. Figure 1 shows the real effective exchange rate of 4 CEE transition countries that are currently negotiating accession to EMU (Slovakia, the Czech Republic, Hungary and Poland will become EU members in 2004). Across all 4 countries, we can observe a positive trend in their real effective exchange rate.
The reason why the real effective exchange rate (REER) has been chosen instead of the frequently used bilateral real exchange rate (usually against USD or EUR) is because it provides a richer measure of competitiveness.
Figure 1. Real effective exchange rates
11For two countrieshomeandforeignwith price levelP andP∗(measured in same numeraire), we say that home country experiences a real appreciation, and foreign real depreciation, when P/P∗ rises. If the real exchange rates are defined asP/eP∗, where e is nominal exchange rate in units of domestic currency, then an increase in real exchange rate denotes real appreciation.
In order to get an overview of the Balassa-Samuelson hypothesis, the sectoral data on productivity and prices in the following 4 accession counties are considered.
The series are smoothed by the seasonal adjustment X-11
12.
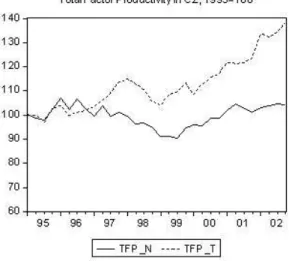
As Figure 2 indicates, the productivity in the traded sector has been growing faster than in non-traded sector over the whole sample period, except the period 1995-96 in Czech Republic and Hungary, and year 1995 in Poland. After the initial recession, these countries have experienced rapid productivity growth, particularly in their industrial sectors. Decades of central planning have resulted in emphasis on material production, while services were largely neglected (the productivity trend in non-traded sector is almost zero, in some countries negative).
Figure 2. Total factor productivity in traded and non-traded sector
12EViews provides the seasonal adjustment programCensusX-11 which is the standard method used by the U.S. Bureau of Census to seasonally adjust publicly released data.
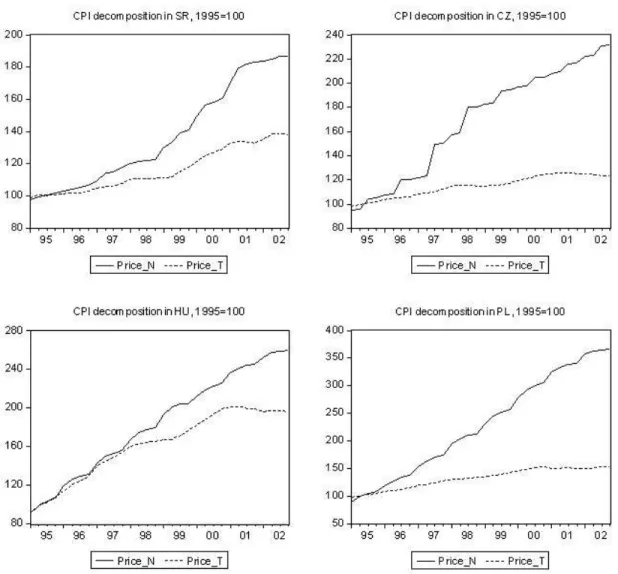
According to the Balassa-Samuelson hypothesis, the faster productivity growth in the traded sector should result in faster growth of the non-traded prices. Figure 3 demonstrates that this has been the case. Actually, this implication relates only to one (the ”home”) country, and should be correctly referred to the ”domestic”
Balassa-Samuelson hypothesis.
Figure 3. Prices in traded and non-traded sector
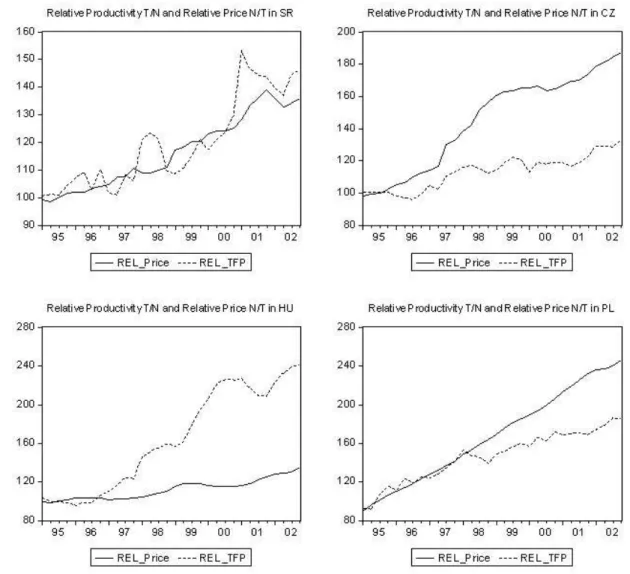
The core of the productivity hypothesis is presented in Figure 4. The relative prices (non-traded relative to traded) have tended to rise as the relative productivity (traded relative to non-traded) has increased. This is in fact the Baumol-Bowen effect, which is closely related to but distinct from the Balassa-Samuelson effect.
The Baumol-Bowen effect takes place in the ”home” country, while the Balassa-
Samuelson effect compares two countries: domestic versus foreign.
Figure 4. The Baumol-Bowen effect
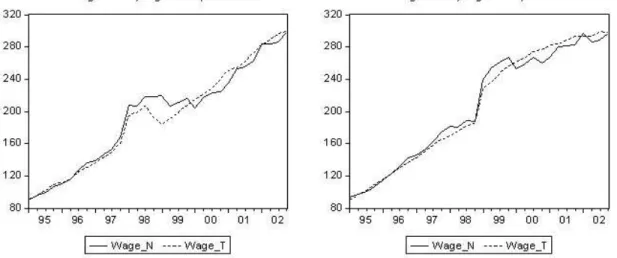
Figure 5 describes the evolution of nominal wages in the traded and non-traded sector in these 4 CEE countries.
Figure 5. Nominal wages in traded and non-traded sector
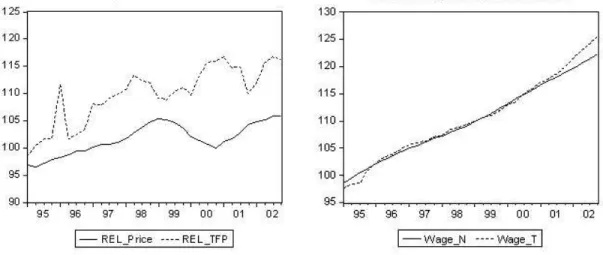
Figure 6 provides the same analysis for the Euro area. The first panel indicates that the productivity growth in the traded good sector has been higher than in the non-traded good sector. Higher productivity in the traded sector translates into higher prices in the non-traded sector. The second panel shows that the ”domestic”
Balassa-Samuelson hypothesis holds from the middle of 1996. As the third panel demonstrates, except the period 1999-01, the Baumol-Bowen effect seems to hold, i.e., the relative price have tended to rise as the relative productivity has increased.
In the fourth panel, the wages in both sectors move together.
13Figure 6. Euro area
13Due to the wage equalization in the Euro area, the wage growth differential in the foreign country (4wTt∗− 4wNt ∗) will disappear from equation (16), i.e. we will estimate the following equation:
4pt− 4p∗t =4et+ (1−α)[eδ
eγ4aTt − 4aNt ]−(1−α∗)[δe∗ f
γ∗4aTt∗− 4aNt ∗]−eδ(1−α)(4wTt − 4wNt ).
In Table 2, the same information is summarized for the accession countries in the terms of growth, i.e., the productivity growth and the inflation rate. Observe that the average productivity growth in the traded sector ranges from 4.5 % in the Czech Republic to 10.8 % in Hungary. On the other hand, the average productivity growth in the non-traded sector moves around 0 % or is even negative, the case of Hungary and Poland. The average inflation rate lies in interval 5.8 % and 12.9 %.
Compared to the Euro area, the average productivity growth in the traded sector is 2.4 %, in the non-traded sector 0.4%, and inflation rate is 2.1 %.
Table 2. Average productivity growth and inflation rate
4.4 Estimates of Balassa-Samuelson Term
The Balassa-Samuelson model presented in Section 3 suggests that there is a spe- cific relationship between the relative price differential, the productivity differential and, potentially, the wage differential.
At first, we will provide individual country estimates of the Balassa-Samuelson term obtained by ordinary least squares. The use of quarterly data and the short sample period (1995:1-2002:4) makes the application of time series techniques ex- tremely difficult, and it must be stressed out that the results should be treated and interpreted with caution. To resolve this power problem, in second part of our empirical analysis, we employ panel regressions.
For each country, we estimate three models:
• ”standard” specification of BS hypothesis (equation 14);
• ”full” specification of BS hypothesis (equation 17) without assuming that PPP holds for tradables;
• ”extended” specification of BS hypothesis (equation 16) without assuming that wages tend to get equalized across sectors.
An additional explanatory variable, the real interest rate differential, is added to each regression equation. Recall that the real interest rate was captured in constant term c of equation (8).
Some additional simplifying assumptions are worth of noting. None of the em- pirical papers studying the Balassa-Samuelson effect (including this one) tries to regress these equations with different relative labour intensities in the non-traded and traded sectors δ/γ. As argued by Mihaljek (2002), the use of these intensities can significantly affect the magnitude of estimated BS term. Due to the lack of the sectoral employment data, we set the ratio of labour intensities to one in our empirical work.
According to the theoretical model presented earlier in this paper, an increase
(decrease) in the productivity differential should result in increase (decrease) in the
relative price differential. In other words, the estimates of the Balassa-Samuelson
term should have a positive sign.
Individual country estimates of BS term:
First, we estimate the following equation, which represents the ”standard” spec- ification of BS hypothesis:
(4p
CEE− 4p
EA)
t= β
14e
CEEt+ β
2[(1 − α
CEE)(4a
CEET− 4a
CEEN)
t−
−(1 − α
EA)(4a
EAT− 4a
EAN)
t] + ε
t(18) where 4p is the gross inflation rate, 4e is the rate of change of the nominal exchange rate, 4a
Tand 4a
Nare the growth rates of productivities (gross), ε
tare residuals and β’s are the estimated coefficients, the superscript CEE denotes the central European country (SR, CZ, HU, PL) and EA the Euro area.
Throughout this paper, the coefficient β
2refers to the Ballasa-Samuelson ef- fect
14, which measures the impact of the productivity growth on the relative prices.
The results are reported in Tables 3 - 6 at the end of this section. The first two columns provide the coefficients of the benchmark model (case A indicates that the real interest rate has been added).
Then, the following null hypothesis is tested:
H
0: β
2= 0 against H
0: β
2> 0
where the alternative hypothesis represents the Balassa-Samuelson hypothesis (pro- ductivity differential has a positive impact on relative price differential).
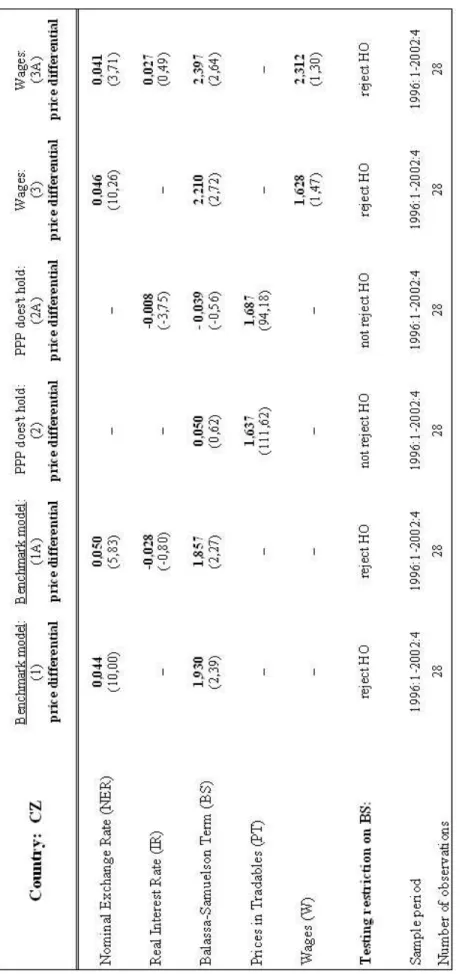
The first columns in Tables 3 - 6 show that a percentage point increase in the productivity differential in Slovakia is associated with an increase of about 2.5 % in the relative prices when compared to the Euro area. In the Czech Republic, if the productivity differential rises by 1 %, the relative price of non-traded to traded goods increases by 1.9 %. According to these estimates, the productivity growth differential results in 2.8 percentage point higher relative prices in Hungary, and 3.4 percentage point higher relative prices in Poland. Adding the real interest rate is accompanied by lower magnitude of the BS term (except Slovakia), and
14In order not to confuse the reader, we provide a brief revision of terminology used. The Ballasa-Samuelson effectexplains a tendency for countries with higher productivity in tradables, compared with non-tradables, to have a higher aggregate price level (Obstfeld and Rogoff, 1996).
In this paper the Ballasa-Samuelson effect is captured by coefficient β2. TheBallasa-Samuelson term is [(1−αCEE)(4aCEET − 4aCEEN )t −(1−αEA)(4aEAT − 4aEAN )t]. And the Ballasa- Samuelson hypothesistests whether the productivity growth differential has a positive influence on the relative price differential. In the empirical work, we test the null hypothesisH0:β2= 0.
enters insignificantly
15. For all countries, we rejected the null hypothesis, i.e., the productivity growth differential has a positive influence on relative price differential.
According to the magnitude of the estimates, there is a strong evidence for the Balassa-Samulson effect.
Second, we explore the stationarity of the real exchange rate using augmented Dickey-Fuller test for unit root. The real exchange rates appear difference statio- nary I(1), i.e., PPP does not hold
16. And thus, it seems to be reasonable investigate the Balassa-Samuelson effect under this general assumption (see equation 17).
We estimate the following equation, which represents the ”full” specification of the BS hypothesis without assuming that PPP holds for tradables
17:
(4p
CEE− 4p
EA)
t= β
1(4p
CEET− 4p
EAT)
t+
+β
2[(1 − α
CEE)(4a
CEET− 4a
CEEN)
t− (1 − α
EA)(4a
EAT− 4a
EAN)
t] + ε
t(19) where all variables are defined as in equation (18) and 4p
Tdenotes the gross rate of PPI inflation
18.
The second two columns in Tables 3 - 6 provide the coefficients of the ”full”
Balassa-Samuelson model. Not assuming that PPP holds for tradables results in little support of BS hypothesis, the coefficients of BS term are around zero or even negative. In all cases, except Hungary and Poland, we do not reject the null hypothesis, i.e., the productivity growth differential has no impact on the relative price differential. In Hungary and likewise in Poland, a percentage point higher growth of the productivity differential will result in 0.4 percentage point higher relative prices compared to the Euro area. The estimated coefficients on tradable price differential ( ˆ β
1in equation 19) are statistically significant in all regressions, and range in value from 0.9 (Hungary) to 1.7 (Slovakia and Czech Republic).
Finally, the empirical evidence that wages do not tend to equalize across sectors leads us to derive a second modification of the Balassa-Samuelson model. Following Section 3.2, we estimate the regression equation, which represents the ”extended”
15MacDonald and Ricci (2001) found the same results investigating 10 European countries.
16According to PPP, the real exchange rate must be stationary. This implies there cannot exist persistent deviations from real exchange equilibrium level only temporary ones.
17In this specification of the BS hypothesis, the danger of possible endogeneity could arise.
18Producer Price Index (PPI) is used for traded goods’ prices.
specification of the BS hypothesis
19:
(4p
CEE− 4p
EA)
t= β
14e
CEEt+ β
2[(1 − α
CEE)(4a
CEET− 4a
CEEN)
t−
−(1 − α
EA)(4a
EAT− 4a
EAN)
t] + β
3[(1 − α
CEE)(4w
TCEE− 4w
NCEE)
t] + ε
t(20) where 4w
Tand 4w
Ndenote the wage growth in the traded sector and in the non-traded sector, respectively.
According to last two columns in Tables 3 - 6, the size of the Balassa-Samuelson term is similar to one obtained from the first regression (the benchmark model) except for Slovakia. A percentage point increase in the productivity differential in Slovakia, the Czech Republic, Hungary and Poland is associated with an increase in the relative prices of about 1.3 %, 2.2 %, 2.9 % and 3.3 %, respectively. Again, in almost all cases we reject null hypothesis, i.e., the productivity growth differential has a positive impact on the relative price differential.
Recall that all these regressions contain 28 observations, which is, in fact, very short sample period. To resolve this short time span problem, we next employ a panel regression.
19Due to the fact that wages in the traded and non-traded sector move together in the Euro area, the term [(1−αEA)(4wEAT − 4wNCEE)t] will not reveal in equation (20).
Table 3. Individual estimates of Balassa-Samuelson effect for Slovakia
Table 4. Individual estimates of Balassa-Samuelson effect for Czech Republic
Table 5. Individual estimates of Balassa-Samuelson effect for Hungary
Table 6. Individual estimates of Balassa-Samuelson effect for Poland
Pooled estimates of BS term:
For the purposes explained in previous section, we have chosen fixed effects panel estimation. In this part of the paper, we extend the analysis of the previous section and estimate a model in which almost all coefficients are permitted to vary over the 4 CEE countries. Specifically, we consider three following regression equations, corresponding to ”standard”, ”full” and ”extended” specification of the BS hypothesis:
• ”standard” specification:
(4p
i− 4p
EA)
t= α
i+ β
14e
it+ β
2i[(1 − α
i)(4a
iT− 4a
iN)
t−
−(1 − α
EA)(4a
EAT− 4a
EAN)
t] + ε
iti = SR, CZ, HU, P L (21) where coefficient β
1for the rate of change of the nominal exchange rate remains constant and the Balassa-Samuelson term β
2ivaries over countries.
• ”full” specification:
(4p
i− 4p
EA)
t= α
i+ β
1(4p
iT− 4p
EAT)
t+ β
i2[(1 − α
i)(4a
iT− 4a
iN)
t−
−(1 − α
EA)(4a
EAT− 4a
EAN)
t] + ε
iti = SR, CZ, HU, P L (22) where only the Balassa-Samuelson term alters among the countries.
• ”extended” specification:
(4p
i−4p
EA)
t= α
i+β
14e
it+β
2i[(1−α
i)(4a
iT−4a
iN)
t−(1−α
EA)(4a
EAT−4a
EAN)
t] +β
3[(1 − α
i)(4w
iT− 4w
iN)
t] + ε
iti = SR, CZ, HU, P L (23) where only the Balassa-Samuelson term stays country specific.
The results are reported in Table 7 behind this section. The first two columns
provide the estimated coefficients for the benchmark model with standard assump-
tions. A percentage point increase in the productivity differential in Slovakia and
Czech Republic is associated with an increase of about 1.7 % and 1.3 % in the
relative price differential when compared to the Euro area. The results for Poland
indicate the highest magnitude of the Balassa-Samuelson term among these 4 CEE
countries of about 2 % per annum. On the other hand, the productivity growth
differential in Hungary results only in 0.8 % higher relative prices.
The second two columns in Table 7 illustrate the estimates for the ”full” Balassa- Samuelson model. Relaxing PPP for tradables results in a positive impact of the productivity growth differential on the relative price differential in Slovakia, Czech Republic and Poland. The Balassa-Samuelson effect in these three countries range from 0.4 % to 0.7 %. In contrast, a percentage point increase in the productivity differential in Hungary is associated with a decrease of about 0.1 % in relative prices when compared to the Euro area.
This is an interesting case and Hungary seems to behave differently if we employ the pooled analysis. A possible explanation can be found by examining the Baumol- Bowen effect among these accession countries. From Figure 4 we can see that the relative prices were rising with the growing relative productivity. But in a case of Hungary, the relative prices remain steady although the relative productivity is increasing. This empirical evidence suggests that the Baumol-Bowen effect in Hungary is not as substantial as among the other countries. Thus, we estimate the following regression equation for each accession country:
(4p
Nt− 4p
Tt) = const. + β
1(4a
Tt− 4a
Nt) + ε
t(24) where 4p
Tand 4p
Ndenote the prices in the traded and non-traded sector. The Baumol-Bowen effect in Hungary is about 0.2 %, while in other CEE countries ranges from 1.3 % (in Poland) to 2.4 % (in Czech Republic).
According to last two columns in Table 7, the magnitude of the Balassa-Samuel- son term in the ”extended” model (in which we add the wage growth differential as an additional explanatory variable) is very similar to magnitude of the BS term in the benchmark model.
Then, the following null hypothesis is tested:
H
0: β
2SR= β
2CZ= β
2HU= β
2P L= 0 against any of β
2i> 0 f or i = SR, CZ, HU, P L
where the alternative hypothesis represents the Balassa-Samuelson hypothesis (the
productivity differential has a positive impact on relative price differential). As
a result, for all specifications of the BS model we reject the null hypothesis, i.e.,
the productivity growth differential has a positive influence on the relative price
differential and, thus, the Balassa-Samuelson effect seems to hold.
If we allow all the coefficients of equations (21)-(23) to remain constant over all countries, the test results will slightly change. Using standard assumptions and adding the wage growth differential variable to the regression equation will lead to the rejection of the null hypothesis and to strong support of the Balassa-Samuelson effect. In contrast, relaxing some of the assumptions for Balassa-Samuelson model (e.g., PPP does not hold for tradables) results in the acceptance of the null hypoth- esis and offers little evidence in favour of the Balassa-Samuelson hypothesis. These results are reported in Table 8 behind this section.
Finally, we summarize the individual country and pooled estimates for Slovakia, the Czech Republic, Hungary and Poland in Table 9. It is worth of noting that all the obtained estimates using the fixed effects panel estimation are smaller than the individual country estimates attained by least squares in the standard model and in the modification augmented by wages. In the specification of the Balassa- Samuelson model without assuming PPP for tradables, the pooled estimates are larger except for Hungary, where the Balassa-Samuelson effect is negative.
Table 9. The estimates of the Balassa-Samuelson effect (percentage points per annum )
If we agree that estimates attained by fixed effects panel estimation are more trustworthy, then the productivity driven real appreciation ranges from 0.8 % (in Hungary) to 2 % (in Poland) under the standard assumptions. It suggests that the Balassa-Samuelson effect in these 4 CEE countries is not as sizeable as estimated by other authors
20.
20Some estimates, e.g., by Simon and Kovacs (1998), Rother (2000), Halpern and Wyplosz (2001) show that productivity driven real appreciation is approximately 3 % per annum in a number of transition economies.
Table 7. Pooled estimates of Balassa-Samuelson effect
Table 8. Pooled estimates of Balassa-Samuelson effect II.
5 Conclusion
This paper presents a theoretically-based, econometric model of the real ex- change rate appreciation in transition economies. For these purposes we have cho- sen four CEE economies: Slovakia, the Czech Republic, Hungary and Poland and compared them to the Euro area (EMU).
The key finding of this paper is the strong empirical evidence in favour of the Balassa-Samuelson effect in these four transition economies under the standard as- sumptions (1. capital is mobile, 2. labour is mobile, 3. PPP holds for tradable goods). According to our results, individual country estimates of the Balassa- Samuelson term are approximately 2.5 % per annum. Using panel estimation tech- niques, the magnitude of the Balassa-Samuelson effect is smaller. We find that the percentage point increase in the productivity growth differential will result in 1.7 % higher relative prices in Slovakia, 1.3 % higher relative prices in the Czech Republic, 0.8 % higher relative prices in Hungary and 2 % higher relative prices in Poland when compared to the Euro area.
Furthermore, relaxing one of the assumptions (3. PPP holds for tradable goods) lends a little support of the Balassa-Samuelson hypothesis, e.g., in Slovakia and Czech Republic, the productivity growth differential has no impact on the rela- tive price differential. However, in the case of Hungary and Poland, the posi- tive link still remains. In the cross-country context, if we allow a country specific Balassa-Samuelson term, we reject the null hypothesis. On the other hand, if the Balassa-Samuelson coefficients do not vary across counties, the null hypothesis is not rejected, i.e., the productivity differences have no influence on relative prices.
One important result of this paper is that EU candidate countries are expected to experience, and indeed, have experienced a substantial appreciation of the real exchange rate. Recent research on the appropriate monetary and exchange rate policies in EU accession countries discusses extensively the question of a possible conflict between the significant trend appreciation of the real exchange rate and the exchange and inflation rate criteria for EMU membership.
In the presence of the real exchange rate appreciation, the accession countries
may face trade-off between exchange rate stability and the inflation target as re-
quired for the EMU membership. Since the real appreciation can be attained
through an appreciation of the nominal exchange rate, a higher inflation rate, or a combination both, different exchange rate regimes will imply different consequences for these policy criteria. In this respect, selecting the appropriate exchange rate arrangement before adopting the euro will be crucial for the process of the real and nominal convergence in transition economies.
According to our empirical investigation, the Balassa-Samuelson effect is ”re- sponsible” for an average annual rate of the real appreciation of around 2.5 %.
Keeping the nominal exchange rate stable, as required for accession to EMU, could lead to an inflation rate 2.5 percentage point above that in the Euro area. Al- though these rates of inflation are not excessive, they violate the nominal inflation convergence criterion
21required for admission into EMU. On the other hand, if CEE countries allow their exchange rates to appreciate (as a reflection of their strong productivity growth as postulated by the Balassa-Samuelson effect), they will violate the stability of the exchange rate criterion
22for admission.
These analyses were done for the individual country estimates of the producti- vity driven real appreciation under the standard assumptions. Different scenarios will generate different outcomes. If the PPP assumption for tradables is relaxed, the magnitude of the Balassa-Samuelson effect is smaller and the violation of the inflation and exchange rate criteria does not have to occur.
In conclusion, it is important to note that the Balassa-Samuelson effect is an equilibrium phenomenon, not an undesirable transitory effect that ought to coun- teracted through policy operations. The real appreciation reflects the natural evo- lution of the economy, which has to be translated into relative prices changes.
21The annual inflation rate of EMU candidates must not exceed by more than 1.5 % the average of the three lower inflation countries in the Euro area.
22Joining the exchange rate mechanism (ERM-II), i.e. limiting for at least two years exchange rate movements within a ± 15 % band around a central parity, is a necessary step to join the Euro currency area.
Appendix I.
The first-order conditions.
The representative firm faces the problem of maximizing profit expressed in terms of tradable goods :
Π
t= Y
tT(L
Tt, K
tT)+P
RELY
tN(L
Nt, K
tN)−(W
tTL
Tt+W
tNL
Nt)−R
t(K
tT+K
tN) (A1) where W
tiis nominal wage in the relevant sector, i = T, N and R
tis the interest rate (determined in world financial market). Then the first-order conditions are:
∂Y
tT∂K
tT= P
REL∂Y
tN∂K
tN= R
t(A2)
∂Y
tT∂L
Tt= W
tT(A3)
P
REL∂Y
tN∂L
Nt= W
tN. (A4)
”Domestic” Balassa-Samuelson hypothesis.
Solving for the capital-labour ratio in equation (10):
k
tT− l
tT= log(1 − γ ) + a
Tt− r
tγ (A5)
k
Nt− l
Nt= p
REL+ log(1 − δ) + a
Nt− r
tδ (A6)
and substituting them in the wage equation, i.e. w
tT= w
Nt, we obtain the following expression for relative price:
p
REL= {δ[logγ + 1 − γ
γ log(1 − γ ) − logδ − 1 − δ
δ log(1 − δ) + r
t( 1 − δ
δ − 1 − γ γ )]}+
+ δ
γ a
Tt− a
Nt(A7)
and by replacing the term in ”{}” brackets by constant term c, we obtain equation (13).
The alternative specification is obtained by calculating capital-labour ratio in equations (11), (12):
k
Tt− l
Tt= 1
1 − γ (w
Tt− logγ − a
Tt) (A8)
k
tN− l
tN= 1
1 − δ (w
Nt− p
REL− logδ − a
Nt) (A9) and substituting them in equation (10) we obtain:
p
REL= {(1 − δ)[log(1 − γ) + γ
1 − γ logγ − log(1 − δ) − δ
1 − δ logδ]}+
+ 1 − δ
1 − γ a
Tt− a
Nt− (1 − δ)(w
Tt− w
tN) + ( 1 − δ
1 − γ w
Tt− w
tN) (A10)
where the last term disappears due to the fact that nominal wages weighted by
labour intensities are proportional. Then by replacing the term in ”{}” brackets
by constant term c, and e δ ≡ 1 − δ, resp. e γ ≡ 1 − γ, we obtain equation (15).
Appendix II.
Economies and periods covered
The panel data covers 4 countries (Slovakia, the Czech Republic, Hungary and Poland) and it is compared to the Euro area (EMU). The dataset was available from 1995:Q1 to 2002:Q4. All variables are expressed as logarithms of correspond- ing indices (1995=100).
Variable definitions.
real effective exchange rates: Currency Conversions/Real Effective Exchange Rate/Total; source: OECD MEI
nominal exchange rates: of domestic currency against the euro; source: National Central Banks, IFS
real interest rates: Interest Rates/3-mth or 90-day rates; source: OECD MEI total CPI: Consumer Price Index/All items/Total; source: OECD MEI
non-tradable prices : Consumer Price Index/Services/Total; source: OECD MEI tradable prices: Producer Price Index/Industry aggregates/Manufactured prod- ucts/Total; source: OECD MEI
wages in traded sector: Labour compensation/Earnings/Manufacturing/Month- ly; source: OECD MEI
wages in non-traded sector: Labour compensation in services; source: Eurostat, Slovak Academy of Sciences (SAV)
productivity in traded sector: TFP/TFP by economic activities/Manufacturing/
Total; source: OECD ISD
productivity in non-traded sector: TFP/TFP by economic activities/Services/
Total and TFP/TFP by economic activities/Construction/Total; the weights being
specific to size of sectoral value added; source: OECD ISD
References
[1] Alberola, E., and Tyrvainen, T. (1998): In the scope for inflation differential in EMU? An empirical evaluation of the Balassa-Samuelson model in EMU countries, Working paper of Bank of Finland.
[2] Balassa, B., (1964): The purchasing power parity doctrine: a reappraisal, Journal of Political Economy, vol. 72, 584-596.
[3] Baumol, W., and Bowen, W. (1996): Performing arts: The economic dilemma, New York: Twentieth Century Fund.
[4] De Gregorio, J., A. Giovanni and H. Wolf (1994): International evidence on tradables and nontradables inflation, European Economic Review, 38, 1225-44.
[5] Desai, P. (1998): Macroeconomic fragility and exchange rate vulnerability : A cautionary record of transition economics, Journal of Comparative Economics, 26, 621-641.
[6] Engel Ch. (1999): Accounting for U.S. real exchange rate changes, Journal of Political Economy, vol. 107, no. 3.
[7] Egert, B. (2001): Estimating the impact of the Balassa-Samuelson effect on inflation during the transition: Does it matter in the run-up to EMU? The case of the Czech Republic, Hungary, Poland, Slovakia and Slovenia.
[8] Faria, J., R. and Ledesma, L. (2000): Testing the Balassa-Samuelson effect:
Implications for growth and PPP,
direct: http://www.kent.ac.uk/economics/papers/papers-pdf/2000/0008.pdf.
[9] Fisher, C. (2001): Real currency appreciation in EU accession countries : Balassa-Samuelson and investment demand, Deutsche Bank.
[10] Frankel J., and Rose A. (1996): Empirical research on nominal exchange rates, Handbook of international economics, Vol. 3., Amsterdam, North Holland.
[11] Halpern, L., and Ch. Wyplosz (1997): Equilibrium exchange rates in tran- sition economies, IMF Staff Papers, Vol. 44, No. 4, IMF.
[12] Halpern, L., and Ch. Wyplosz (1998): Equilibrium exchange rates in tran- sition economies: further results.
[13] Halpern, L., and Ch. Wyplosz (2001): Economic transformation and real
exchange rates in 2000s: the Balassa-Samuelson connection, Economic Survey of Europe, 2001, No.1., Ch.6.
[14] Harrod, F. (1993): International Economics, London: James Nisbet and Cambridge University Press.
[15] Jazbec, B. (2001): Determinants of real exchange rates in transition econo- mies, Focus on transition, No.2, Vienna: Oesterreichische Nationalbank.
[16] MacDonald, R. and L. Ricci (2001): PPP and the Balassa-Samuelson effect:
the role of the distribution sector,
direct: http : //papers.ssrn.com/paper.taf ?abstract.id = 268969
[17] Mihaljek, D. (2002): The Balassa-Samuelson effect in central Europe:
a disaggregated analysis, 8th Dubrovnik Economic Conference.
[18] Obstfeld, M. and K. Rogoff (1996): Foundation of international macroeco- nomics, MIT Press, Cambridge.
[19] Rosati, D. (1997): Exchange rate policies in post-communist economies in Zecchini S. ed. Lessons from the Economic Transition Central and Eastern Europe in the 1990s, Kluwer Academic Publishers (OECD).
[20] Rother P. (2000): The impact of productivity differentials on inflation and the real exchange reta: an estimation of the Balassa-Samuelson effect in Slovenia, IMF Staff Country Report No. 00/56
[21] Samuelson, P. (1964): Theoretical problems on trade problems, Review of Economic and Statistic, 46, 145-154.
[22] Simon, A., and Kovacs M. (1998): Components of the real exchange rate in
Hungary, National bank of Hungary, Working Paper No. 1998/3.
Author: Adriana Lojschová
Title: Estimating the Impact of the Balassa-Samuelson Effect in Transition Economies Reihe Ökonomie / Economics Series 140
Editor: Robert M. Kunst (Econometrics)
Associate Editors: Walter Fisher (Macroeconomics), Klaus Ritzberger (Microeconomics)
ISSN: 1605-7996
© 2003 by the Department of Economics and Finance, Institute for Advanced Studies (IHS),
Stumpergasse 56, A-1060 Vienna • +43 1 59991-0 • Fax +43 1 59991-555 • http://www.ihs.ac.at