Contents lists available atScienceDirect
Bone Reports
journal homepage:www.elsevier.com/locate/bonr
Calcium isotope ratios in blood and urine: A new biomarker for the diagnosis of osteoporosis
A. Eisenhauer
a,g,⁎, M. Müller
b,g, A. Heuser
a,g, A. Kolevica
a,g, C.-C. Glüer
c, M. Both
d, C. Laue
e, U.v. Hehn
f, S. Kloth
g, R. Shroff
h, J. Schrezenmeir
eaGEOMAR Helmholtz Centre for Ocean Research Kiel, 24148 Kiel, Wischhofstr.1-3, Germany
bUniversity Medical Center Schleswig-Holstein (UKSH), Arnold-Heller-Str. 3, 24105 Kiel, Germany
cSektion Biomedizinische Bildgebung, Klinik für Radiologie und Neuroradiologie, Am Botanischen Garten 14, 24118 Kiel, Germany
dKlinik für Neuroradiologie und Radiologie, (UKSH), Arnold-Heller-Str. 3, 24105 Kiel, Germany
eClinical Research Center Kiel GmbH, Schauenburgerstraße 116, 24118 Kiel, Germany
fMedistat, GmbH, Kieler Straße 15, 24119 Kronshagen, Germany
gOSTEOLABS GmbH, c/o GEOMAR Helmholtz Centre for Ocean Research Kiel, 24148 Kiel, Wischhofstr.1-3, Germany
hGreat Ormond Street Hospital for Children NHS Foundation Trust, London WC1N 3JH, United Kingdom of Great Britain and Northern Ireland
A R T I C L E I N F O Keywords:
Osteoporosis
Bone mineral density (BMD)
Dual energy x-ray absorptiometry (DXA) Calcium isotopes
Bone biomarkers Mass-spectrometry
A B S T R A C T
We assessed the potential of Calcium (Ca) isotope fractionation measurements in blood (δ44/42CaBlood) and urine (δ44/42CaUrine) as a new biomarker for the diagnosis of osteoporosis. One hundred post-menopausal women aged 50 to 75 years underwent dual-energy X-ray absorptiometry (DXA), the gold standard for determination of bone mineral density. After exclusion of women with kidney failure and vitamin D deficiency (< 25 nmol/l) 80 women remained in the study. Of these women 14 fulfilled the standard diagnostic criteria for osteoporosis based on DXA.
Both the δ44/42CaBlood(p< 0.001) and δ44/42CaUrine(p= 0.004) values were significantly different in women with osteoporosis (δ44/42CaBlood: −0.99 ± 0.10‰, δ44/42CaUrine: +0.10 ± 0.21‰, (Mean ± one standard deviation (SD),n= 14)) from those without osteoporosis (δ44/42CaBlood: −0.84 ± 0.14‰, δ44/42CaUrine: +0.35 ± 0.33‰, (SD),n= 66). This corresponded to the average Ca concentrations in morning spot urine samples ([Ca]Urine) which were higher (p= 0.041) in those women suffering from osteoporosis ([Ca]Urine-Osteoporosis: 2.58 ± 1.26 mmol/l, (SD),n= 14) than in the control group ([Ca]Urine-Control: 1.96 ± 1.39 mmol/l, (SD),n= 66). However, blood Ca concentrations ([Ca]Blood) were statistically indistinguishable between groups ([Ca]Blood, control:
2.39 ± 0.10 mmol/l (SD),n= 66); osteoporosis group: 2.43 ± 0.10 mmol/l (SD,n= 14) and were also not correlated to their corresponding Ca isotope compositions. The δ44/42CaBloodand δ44/42CaUrinevalues correlated significantly (p= 0.004 top= 0.031) with their corresponding DXA data indicating that both Ca isotope ratios are biomarkers for osteoporosis. Furthermore, Ca isotope ratios were significantly correlated to other clinical para- meters ([Ca]Urine, ([Ca]Urine/Creatinine)) and biomarkers (CRP, CTX/P1NP) associated with bone mineralization and demineralization. From regression analysis it can be shown that the δ44/42CaBloodvalues are the best biomarker for osteoporosis and that no other clinical parameters need to be taken into account in order to improve diagnosis.
Cut-off values for discrimination of subjects suffering from osteoporosis were − 0.85‰ and 0.16‰ for δ44/
42CaBloodand δ44/42CaUrine, respectively. Corresponding sensitivities were 100% for δ44/42CaBloodand ~79% for δ44/42CaUrine. Apparent specificities were ~55% for δ44/42CaBloodand ~71%. The apparent discrepancy in the number of diagnosed cases is reconciled by the different methodological approaches to diagnose osteoporosis. DXA reflects the bone mass density (BMD) of selected bones only (femur and spine) whereas the Ca isotope biomarker reflects bone Ca loss of the whole skeleton. In addition, the close correlation between Ca isotopes and biomarkers of bone demineralization suggest that early changes in bone demineralization are detected by Ca isotope values, long before radiological changes in BMD can manifest on DXA. Further studies are required to independently confirm that Ca isotope measurement provide a sensitive, non-invasive and radiation-free method for the diagnosis of osteoporosis.
https://doi.org/10.1016/j.bonr.2019.100200 Received 2 January 2019; Accepted 10 March 2019
⁎Corresponding author at: GEOMAR Helmholtz Centre for Ocean Research Kiel, 24148 Kiel, Wischhofstr.1-3, Germany.
E-mail addresses:aeisenhauer@geomar.de(A. Eisenhauer),Michael.Mueller@uksh.de(M. Müller),glueer@rad.uni-kiel.de(C.-C. Glüer),
marcus.both@uksh.de(M. Both),c.Laue@crc-kiel.de(C. Laue),info@medistat.de(U.v. Hehn),sk@osteolabs.de(S. Kloth),Rukshana.Shroff@gosh.nhs.uk(R. Shroff).
Available online 16 March 2019
2352-1872/ © 2019 The Authors. Published by Elsevier Inc. This is an open access article under the CC BY license (http://creativecommons.org/licenses/BY/4.0/).
T
1. Introduction
Calcium is an essential mineral in the body, controlling the forma- tion and maintenance of bones and teeth (Boskey, 2008), muscle con- traction, neural signal transmission, cell apoptosis and the coagulation of blood. Calcium homeostasis is carefully regulated through hormonal feedback loops in order to keep blood Ca levels within a narrow ther- apeutic range (Gussone, 2016). Essentially, three organs control the Ca homeostasis: the gastrointestinal tract (GI), where Ca is absorbed from the diet, the skeleton which is the main Ca reservoir, and the kidneys where Ca is reabsorbed from the urine back into the blood and con- trolled amounts are excreted. Physiological ageing processes as well as intestinal, bone, kidney and endocrine disorders interfere with Ca homeostasis. Osteoporosis, osteomalacia and rickets as well as renal osteodystrophy are examples of bone disorders linked to an impaired Ca metabolism. Osteoporosis is the most widely prevalent condition, mainly affecting postmenopausal women. It is a systemic disorder characterized by low BMD, increased fragility and predisposition to fractures (Consensus development conference: diagnosis, prophylaxis, and treatment of osteoporosis, 1993). In clinical practice osteoporosis is diagnosed when BMD is reduced on DXA, after exclusion of other causes (Consensus development conference: diagnosis, prophylaxis, and treatment of osteoporosis, 1993; Kanis, and WHO, Scientific, Group, 2007).
Changes in BMD are associated with a net loss of Ca from the bone.
This has been investigated by tracer experiments using stable (non- radioactive) Ca isotopes that are naturally present in the environment such as42Ca and44Ca (Abrams, 1994;Abrams et al., 1994) as well as with radioactive Ca isotopes of different half-lives (41Ca,45Ca or47Ca) (Abrams, 1994;Abrams et al., 1994;Abrams, 1999;Beck et al., 2003;
Feeman et al., 1996;Heaney and Nordin, 2002;Stürup et al., 1997).
Tracer studies have been carried out by the simultaneous administra- tion of tracer enriched Ca orally and intravenously. However these experiments are expensive, require a ‘metabolic cage’ like setting, and, in case of radioactive isotopes, are associated with harmful radiation. In contrast, studies using stable Ca isotopes naturally present in our diet, are much cheaper and avoid exposure to radioactivity (Skulan et al., 2007;Skulan and DePaolo, 1999a;Heuser and Eisenhauer, 2010).
The application of natural Ca isotopes follows the principle of ki- netic isotope fractionation that separates stable isotopes from each other as a function of their mass during unidirectional biochemical processes (Eisenhauer et al., 2009;Bullen and Eisenhauer, 2009). As a consequence of kinetic isotope fractionation, in a chain of chemical reactions the lighter isotope always becomes enriched in the product.
Thus, at a trophic level along the food chain, lighter isotopes become enriched from plants to humans. This is expressed as decreasing
44Ca/42Ca ratios (reported as δ44/42Ca) from vegetables via meat to humans (Chu et al., 2005), with human mother's milk being the most enriched reservoir for light Ca isotopes. Similarly, in the human body δ44/42Ca isotope ratios decrease as a function of biochemical processes whereby Ca from the diet goes via the blood into the skeleton (Heuser et al., 2016). This means that major Ca compartments in our body, such as blood and soft tissues, bone, urine and feces, are well characterized with a Ca isotope “fingerprint” and can be used for diagnostic purposes in order to identify distinct Ca related disorders. Different laboratories have quantitatively confirmed that the Ca isotope fractionation, and hence the isotope difference between blood and bone (Δ44/42CaBone- Blood= δ44/42CaBone - δ44/42CaBlood) is fairly constant in the order of about −0.3‰, in different vertebrate species including chickens, horses (Skulan et al., 1997;Skulan and DePaolo, 1999b), “Göttingen”
mini-pigs (Heuser and Eisenhauer, 2010) and humans (Morgan et al., 2012a), and this value is independent of the absolute Ca isotope values in blood and bone.
Based on observational data in animal and human studies (Heuser and Eisenhauer, 2010;Skulan et al., 1997;Skulan and DePaolo, 1999b;
Morgan et al., 2012a) Ca isotopes in blood and urine could theoretically
be used to study disturbances in bone mineral balance such as in os- teoporosis. This is based on the principal that the blood and bone Ca isotope compositions are in isotopic equilibrium only differing by a constant value (Δ44/42CaBone-Blood= δ44/42CaBone - δ44/
42CaBlood= −0.3‰) (Heuser and Eisenhauer, 2010; Skulan et al., 1997; Skulan and DePaolo, 1999b; Morgan et al., 2012a). During equilibrium between bone material absorption and resorption the blood Ca isotope value is not changing. Any short term disturbances of the isotope equilibrium between absorption and resorption (like an in- crease in dietary Ca intake) is re-equilibrated again within a half-life of about an hour due to low blood Ca concentrations and the high Ca exchange rates between bone and blood. However, when bone resorp- tion is persistently greater than bone absorption, as seen in osteo- porosis, the blood Ca isotope composition becomes lower. When the disequilibrium between Ca absorption and resorption continues for days to years, the bone Ca isotope composition successively decreases as a function of time towards lower and lower values also reflected in the blood Ca isotope composition by lower and lower values. The on- going loss of Ca then reflects a decrease of the BMD detectable by DXA at a certain time. Hence, a relationship between Ca isotope values in blood and urine to bone DXA values is predicted and may eventually be applied to support the diagnosis of osteoporosis. These theoretical in- ferences have not been studied in humans.
We undertook this study to determine the feasibility and diagnostic accuracy of Ca isotope fractionation measured in blood and urine for the diagnosis of osteoporosis in post-menopausal women, comparing against their corresponding DXA values as the gold standard. The po- sitive and negative predictive value of Ca isotope fractionation were determined and the association of δ44/42CaUrineand δ44/42CaBloodwith biomarkers of bone resorption, (CTX; C-terminal telopeptide), bone formation (P1NP; N-terminal propeptide of type 1 procollagen) and inflammation (CRP; C-reactive protein) ((WHO, 1994;Felsenberg et al., 1998), were studied.
2. Methods
The aim of this study was to investigate whether the natural Ca isotope ratios (δ44/42Ca) in urine (δ44/42CaUrine) and blood (δ44/
42CaBlood) can be used to diagnose osteoporosis in postmenopausal women, and the diagnostic accuracy of the Ca isotope fractionation technique compared to the gold standard DXA scans and bone bio- markers.
2.1. Study design
The study was approved and registered (NCT02967978) by an in- dependent ethics committee (The Ethical Committee of the Medical Council of Schleswig-Holstein, Bad Segeberg, Germany) and conducted according to the principles stated in the Declaration of Helsinki, the national and international guidelines of the “Dachverband für Osteoporose” (DVO) 2014 and the International Society of Clinical Densitometry (ISCD) 2015 (DVO, n.d.;ISCD, n.d.), respectively.
Post-menopausal women aged 50–75 years who had at least one risk factor for osteoporosis by age 60 years or at least 2 risk factors by age 50 years, were invited to participate in the study. Women with a known fracture within the previous 3 months, those with renal failure, cancer, and hyperparathyroidism or on sex hormone treatment were excluded. Women with Vitamin D deficiency (defined as 25 Hydroxy Vitamin D level < 25 nmol/l, as per the DVO definition) were excluded. In general, the defini- tion of Vitamin D deficiency lightly vary in different national and inter- national guidelines as defined by IOF (International Osteoporosis Foundation) and IOM (Institute of Medicine). According to IOF (IOM), 25OHD levels of < 20 ng/ml (< 12 ng/ml) is termed as deficiency, 20–30 ng/ml (12–20 ng/ml) as insufficiency, and levels > 30 ng/ml (> 20 ng/ml) as sufficiency. We have used the German national DVO recommendation which is in fact a mean value of IOM and IOF (< 25 ng).
One hundred consecutive women fulfilling the above criteria were screened at the Clinical Research Centre (CRC), Kiel. All patients un- derwent a DXA scan of the lumbar spine and proximal femur. Women were divided into those with osteoporosis and those without osteo- porosis according to the world health organization (WHO) definition (WHO, 1994): osteoporosis was considered present if BMD as assessed by DXA densitometry of the lumbar spine and/or proximal femur (total area or femoral neck) had a T-Score ≤ −2.5, and after excluding other disorders associated with a reduction in bone mineral content and os- teomalacia. We based the recruitment on the following assumptions:
according to the European Prospective Osteoporosis Study (EPOS) study (Felsenberg et al., 1998) the prevalence of osteoporosis in German postmenopausal women aged 50 to 60 years is about 15% and about 45% at the age of > 70 years. In women with risk factors such as hip fracture in father and/or mother, smoking, lactose intolerance, vegan diet, underweight (BMI < 20), diabetes, or long-standing use of loop diuretics, glucocorticoids, aromatase inhibitors and proton pump inhibitors, a higher prevalence is expected. Thus, by selecting women with at least one risk factor for osteoporosis, a higher proportion than in the general population were expected to meet the criteria for osteo- porosis. Based on these assumptions, we expected to have at least 40%
subjects suffering from osteoporosis. On screening 100 women, 20 women were found to have low vitamin D levels, renal failure or other risk factors requiring exclusion. Eighty women (n= 40) with risk fac- tors for osteoporosis and n= 40 without risk factors for osteoporosis (age-matched control group) were finally included in the study.
2.1.1. Study investigations
At the first screening visit demographic details, past medical his- tory, including risk factors for osteoporosis, and medication history were determined and suitable subjects consented and recruited. Weight and height measurements were performed and dietary intake was as- sessed using food-frequency-questionnaires (FFQ). At the second visit women were asked to bring in a single morning urine and fecal sample of that day, and blood sampling was performed. DXA of lumbar ver- tebrae and hip was performed within 4 weeks after visit 2. An optional visit 3 served for informing the subjects about their findings.
2.2. Dual X-ray absorptiometry (DXA)
DXA of the lumbar spine and hip were performed on a Hologic QDR 4500 following manufacturer's instructions and standard protocol. All images were analyzed by observers blinded to the subjects' clinical status. According to the WHO definition, osteoporosis is present when the bone density measurement is 2.5 SD below the average of 20–29 year-old women (peak bone mass), also expressed as a T-score value ≤ −2.5. A T-score value of ≤ −2.5 indicates significantly re- duced bone density and an increased risk of bone fractures. T-scores between −1 and −2.5 SD are defined as reduced bone density or os- teopenia. A T score value ≥ −1 is considered to reflect healthy bones.
In this study, the lowest T-score obtained from either vertebral spine or hip was used for the diagnosis of osteoporosis. Subjects in whom the DXA quality was poor due to scoliosis, degenerative disease or other issues were excluded from further analysis.
2.3. Chemical sample preparation and mass-spectrometer measurement 2.3.1. Sample digestion and purification
Samples were chemically treated in batches to remove all organic material before measurement in the mass spectrometer. Each batch consisting out of 20 samples (acidified prior to chemical treatment), one sample replicate, one procedural blank, one of each reference material (NIST SRM 915a, NIST SRM 1486, IAPSO Standard Seawater) and one of the in-house standards (urine AK1 or blood SERA-1). All liquid samples were homogenized by shaking prior to chemical preparation.
About 1180 μl of acidified urine, 450 μl serum and about 100 to 500 mg
feces were used for chemical digestion. About 3 ml of 14 mol/l HNO3
and 1 ml of H2O2 (30%) were added to urine and feces and 3 ml of 14 mol/l HNO3plus 100 μl HClO4were added to the serum samples.
Blank and reference materials were always treated the same way. The closed beakers were placed on a hot plate at 120 °C for 12 h then opened and evaporated afterwards. The residues were treated with nitric acid and hydrogen peroxide, heated to 120 °C and evaporated, with the procedure repeated multiple times until the solution was colorless.
Next, Ca, Magnesium (Mg) and Strontium (Sr) concentrations of the solutions were measured on a Q-ICP-MS Agilent 7500cx. An aliquot of the sample solution containing 50 μg of Ca was chemically purified using an automatic purification system (prepFAST MC, ESI, USA).
Calcium yields were in the order of or better than 95% and the Ca/Sr in the processed solution were > 10000. The Ca fraction collected from the original solutions was dried down at 120 °C and then re-dissolved in 1 ml of 14 mol/l HNO3and 0.5 ml H2O2(30%). The solution was then heated up with closed lids for 12 h at 120 °C and dried down again.
Finally the residues were re-dissolved in 0.2 mol/l nitric acid to yield a final Ca concentration of about 5 μg/ml.
2.3.2. Mass spectrometry and data evaluation
Calcium isotope measurements were performed on a MC-ICP-MS (Neptune plus, Thermo Fisher Scientific, Bremen, Germany) at the mass spectrometer facilities of the GEOMAR Helmholtz Centre for Ocean Research Kiel, Germany. The mass spectrometer was equipped with nine Faraday cups of which eight are moveable. The mass spectrometer was set up to measure masses 42, 43, 43.5 and 44 simultaneously. In order to suppress interfering Ca- and Ar-hydrides (e.g.40Ar1H2on42Ca) an APEX IR (ESI, Omaha, Nebraska, USA) sample introduction system was used. All measurements were performed in medium resolution (MR, m/Δm~4000) on the interference-free plateau of the low mass side of the peaks. This was achieved by choosing an appropriate center cup mass of 43.687 ± 0.001 amu and verified on a daily basis (cf.
(Wieser et al., 2004)). Instrumental fractionation (mass bias) was cor- rected by applying the standard-sample-bracketing approach. The measurement of a sample was bracketed by measurements of a ~5 μg/
ml Ca solution prepared from a 10,000 μg/g Ca ICP reference solution (Ca ICP). Every sample was measured at least four times during a ses- sion and the mean value used for further calculations. The Ca isotopic composition is reported as δ44/42Ca in parts per thousand (‰):
=
Ca (‰) [( Ca/ Ca) /( Ca/ Ca) ]–1
44/42 44 42
Sample 44 42
Reference (1)
Further tests confirmed that there is negligible isotope fractionation during purification (< 0.01‰). Although almost all Sr was removed from the samples during chemical preparation we monitored samples for doubly charged Sr (84Sr,86Sr and88Sr) that can interfere with the measurement of42Ca,43Ca and44Ca, respectively (cf. (Morgan et al., 2011)). We applied several criteria to reject data of a single measure- ment, a single sample and even whole sequences. Following Morgan et al. (Morgan et al., 2011) a single measurement was rejected when
|δ44/42Ca – 2·δ43/42Ca| > 0.2‰. A sample measurement (average of 4 to 5 single measurements) was rejected when the average intensity was outside a 70–130% intensity window when compared to the average intensity of the reference solution from the same batch. A complete sequence was rejected when more than one of the measured interna- tional reference materials deviated > 0.2‰ from the literature value or the data did not fall along the mass-dependent fractionation line. The continuous measurement of international standard materials in the course of this study showed that they are in line with published values in the literature.
2.4. Statistical analysis
Quantitative values evaluated in the present diagnostic study were descriptively presented as mean and standard deviation (SD), minimum
and maximum, as well as quartiles. Nominally scaled values were dis- played in absolute and percent frequencies. Checking the distribution of quantitative study variables by Kolmogorov-Smirnov test, significant deviations from normality were considered. Differences between healthy controls and women with osteoporosis were evaluated using Mann-WhitneyUtest and were graphically shown in box-whisker plots (Fig. 1). Associations between different study variables were measured by nonparametric Spearman rank correlation coefficients (Tables 1 and 2).Cut-off values for Ca isotopes in blood and urine were determined by receiver operating characteristics (ROC) analyses (Fig. 2) using the Youden criterion. Diagnostic performance was measured as sensitivity, specificity and likelihood ratio referenced to the DXA T-score values as gold standard. Predictive values were evaluated in relation to the os- teoporosis prevalence in this study. The central diagnostic meaning of Ca isotopes in combination with other influencing factors was assessed by a stepwise logistic regression analysis using backward elimination (Tables 3a, 3b).
All tests were performed two sided with a significance level (p) of 5%. An alpha adjustment for multiple testing was not applied, and the results were interpreted accordingly. Statistical calculations were done using the statistical software IBM SPSS Statistics 25 (SPSS Inc. an IBM Company, Chicago, IL).
3. Results
3.1. Differences between the osteoporosis and healthy group
Of the 100 women screened, 20 had low vitamin D levels (≤25 nmol/l) and were excluded. The remaining 80 subjects were di- vided into 2 groups based on DXA scans (Table 1): 14 women with osteoporosis (≤−2.5 T-score) and 66 without osteoporosis (> −2.5 T- score) as controls. There was no difference in age between groups (p= 0.8). None of the women had fractures in the preceding five years.
The Ca intake from milk was significantly different between groups, but total Ca was similar (p= 0.140,Table 1). As expected, [Ca]Bloodwere indistinguishable between groups (Table 1). There is also no significant isotope difference for the feces between the healthy and the osteo- porosis group.
All clinical measures indicative of bone resorption and Ca loss (δ44/
42CaBlood, δ44/42CaUrine, CRP, CTX, CTX/P1NP) and [Ca]Urinewere sig- nificantly different between the two groups (Table 1andFig. 1). In particular, Ca isotope values for blood (δ44/42CaBlood) and urine (δ44/
42CaUrine) were significantly lower in women suffering from osteo- porosis when compared to the control group (Fig. 1,Table 1).
The average DXA T-score value of the healthy and osteoporosis group are −0.98 ± 0.9 and −3.06 ± 0.8, respectively. For both lumbar spines and femoral neck average T score values are similar
−0.7 ± 1.7 and − 0.7 ± 1.15, respectively. Lumbar spines and fe- moral neck values are also significantly correlated (R= 0.537, p< 0.0001, Pearson).
3.2. Correlations of Ca isotopes and DXA to markers of mineral metabolism and bone resorption
The Ca isotope values of blood (δ44/42CaBlood) and urine (δ44/
42CaUrine) show a clear correlation (r= 0.765,p< 0.001,n= 80) to each other and a weak to moderate correlation to the DXA T-score values (see color coded values inTable 2). High to perfect as well as weak to moderate correlations also exist for the δ44/42CaBloodand δ44/
42CaUrinevalues to [Ca]Urine,[Ca]Urine/Creatinine, CRP, CTX, CTX/P1NP and Ca from milk (Table 2). The DXA values also show weak to mod- erate correlations to [Ca]Urine,[Ca]Urine/Creatinine and to CTX.
3.3. ROC determined “cut-off values” for the Ca isotopes in blood and urine for women without vitamin D deficiency
To test the power of the δ44/42CaBloodand δ44/42CaUrinevalues in the diagnosis of osteoporosis statistically significant and optimized cut off values of about −0.85‰ and 0.16‰ were calculated from ROC ana- lyses (Fig. 2,Tables 3a and 3b). Women with δ44/42CaBloodand δ44/
42CaUrinebelow their specific threshold values were considered to suffer from osteoporosis. Based on the cut-off values and relative to the DXA defined definition of osteoporosis the sensitivity to diagnose osteo- porosis from the δ44/42CaBloodvalues was 100% whereas the specificity was calculated to be 54.5%. The sensitivity of the δ44/42CaUrinevalues to diagnose osteoporosis was 78.6% and specificity was 71.2%. Positive and negative predictive values as well as the related likelihood factors are reported inTables 3a and 3b.
In order to further test the predictive power of the Ca isotopes in blood and urine in differentiating women with osteoporosis versus those without osteoporosis, all measures withp< 0.05 from univariate analysis (Table 1) were entered into a stepwise logistic regression. In the first step all parameters associated with osteoporosis (δ44/42CaBlood, δ44/42CaUrine, CRP, XTX, CTX/P1NP) were entered into the statistical model. Stepwise exclusion of parameters improved the regression model and only δ44/42CaBloodremained as the most significant and in- dependent predictor for osteoporosis (p< 0.001).
3.4. ROC determined “cut-off values” for the Ca isotope biomarker in blood and urine for the entire population
Repeating the statistical analysis for all women in this study and ignoring their vitamin D status (n= 100) showed that the best cut off value for δ44/42CaBloodvalues were −0.85‰ again which predicts os- teoporosis with a sensitivity of 94% and a specificity of 54%. These values are very similar to the values calculated for women without vitamin deficiency. Similarly for urine the best cut off δ44/42CaUrine
value was 0.23‰ which predicts an osteoporosis with a sensitivity of 72% and specificity of 67.1% again comparable to the values in women without Vitamin D deficiency.
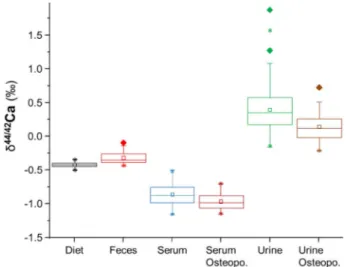
Fig. 1.Ca isotope box plot values in women with (n= 14) and without os- teoporosis (n= 66). Calcium isotope values in blood and serum are box plotted with their corresponding mean values diet, feces and calculated mean value for bone (see details in the text). There is no statistical difference in Ca isotope values between the two groups concerning the diet (p= 0.300) or the feces (p= 0.600). However, women suffering from DXA diagnosed osteoporosis showed significantly lower δ44/42CaBlood (p< 0.001) and δ44/42CaUrine
(p= 0.004) values than those not suffering from osteoporosis. Boxes mark the 25% and 75% quartile, lines mark the median and squares mark the mean value. Diamonds mark outliers and stars mark the 1% and 99% limit of the data.
4. Discussion
In accordance with earlier studies (Skulan et al., 2007;Skulan and DePaolo, 1999b; Morgan et al., 2012b) our results imply that in os- teoporotic women a greater proportion of the Ca originates from bones which changed their δ44/42CaBlood and δ44/42CaUrine values without changing their corresponding [Ca]Blood concentration but increasing their [Ca]Urine and [Ca]Urine/Creatinine values (Table. 1). Latter ob- servation indicates a higher loss of Ca from the bones in osteoporotic women when compared to the healthy control.
Statistical analyses show that the ROC optimized sensitivity is 100%
corresponding to a negative predictive value (NPV) of ~100% for δ44/
42CaBlood. This indicates that the false-positive chance of still having
osteoporosis although the δ44/42CaBloodvalues is above the ROC de- termined threshold value of −0.85‰ corresponds to zero and osteo- porosis can be excluded. For δ44/42CaUrinea NPV of ~94% indicates that the false-positive chance of still having osteoporosis although the δ44/
42CaUrinevalue is above the threshold value of 0.16 is still 6%. The corresponding negative likelihood factors are then 0 and 0.3 for δ44/
42CaBloodand δ44/42CaUrine, respectively, which qualifies them as good negative predictive biomarkers for the exclusion of osteoporosis.
However, as a consequence of the low specificity of ~55% the po- sitive predictive value (PPV) is only about ~32% for δ44/42CaBloodand
~37% for δ44/42CaUrine. This means that subjects having δ44/42CaBlood
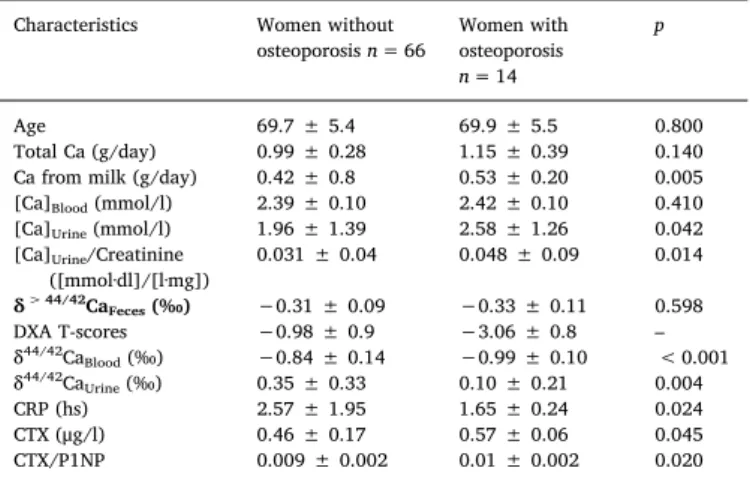
and δ44/42CaUrinebelow the corresponding ROC optimized threshold values still have a false-negative chance of ~30 to 40% of not having osteoporosis. This means the Ca isotope biomarker tends to predict Table 1
Comparison of women without and with osteoporosis.
Characteristics Women without
osteoporosisn= 66 Women with osteoporosis n= 14
p
Age 69.7 ± 5.4 69.9 ± 5.5 0.800
Total Ca (g/day) 0.99 ± 0.28 1.15 ± 0.39 0.140
Ca from milk (g/day) 0.42 ± 0.8 0.53 ± 0.20 0.005
[Ca]Blood(mmol/l) 2.39 ± 0.10 2.42 ± 0.10 0.410
[Ca]Urine(mmol/l) 1.96 ± 1.39 2.58 ± 1.26 0.042
[Ca]Urine/Creatinine
([mmol·dl]/[l·mg]) 0.031 ± 0.04 0.048 ± 0.09 0.014
δ> 44/42CaFeces(‰) −0.31 ± 0.09 −0.33 ± 0.11 0.598
DXA T-scores −0.98 ± 0.9 −3.06 ± 0.8 –
δ44/42CaBlood(‰) −0.84 ± 0.14 −0.99 ± 0.10 < 0.001
δ44/42CaUrine(‰) 0.35 ± 0.33 0.10 ± 0.21 0.004
CRP (hs) 2.57 ± 1.95 1.65 ± 0.24 0.024
CTX (μg/l) 0.46 ± 0.17 0.57 ± 0.06 0.045
CTX/P1NP 0.009 ± 0.002 0.01 ± 0.002 0.020
Note: all reported uncertainties are 1 SD.
Table 2
Pairwise Spearman rank correlations between parameters of mineral metabo- lism.
Spearman rank correlation coefficient R and p-value
δ44/42CaBlood
R (p)
δ44/42CaUrine
R (p)
DXA T scores R (p)
δ44/42CaBlood(‰) --- 0.765
(<0.001)
0.316 (0.004)
δ44/42CaUrine (‰) 0.765
(<0.001) --- 0.245
(0.028)
[Ca]Blood (mmol/l) -0.09
(0.938)
-0.018 (0.876)
-0.004 (0.971
[Ca]Urine(mmol/l) -0.489
(0.001)
-0.606 (0.001)
-0.272 (0.015)
[Ca]Urine/Creatinine -0.531
(0.001)
-0.808 (0.001)
-0.284 (0.011)
CRP 0.283
(0.011)
0.192
(0.088) 0.132
CTX 0.457
(-0.084)
0.073 (0.202)
-0.235 (0.036)
CTX/P1NP -0.242
(0.031)
-0.232 (0.039)
-0.174 (0.122) Ca from milk (g/day) -0.272
(0.015)
-0.287 (0.010)
-0.034 (0.762) Total Calcium (g/day): -0.134
(0.236)
-0.166 (0.140)
0.002 (0.984)
No to low ,0 ≤ R ≤ │0.2│
Weak to moderate, │0.2│ ≤ R ≤ │0.5│
Clear correlation, │0.5│ ≤ R ≤ │0.8│
High to perfect correlation, │0.8│ ≤ R ≤ │1│
Note: Color coding emphasizes the degree of statistical significance of the correlations. The δ44/42CaBlood- and δ44/42CaUrine-values as well as DXA T-scores are compared (Spearman correlation) with parameters of mineral metabolism.
Only parameters where at least one pair showed statistical significance are shown.
Fig. 2.ROC curves for Ca isotope values in blood and urine for the prediction of osteoporosis. The best cut off in blood for δ44/42CaBloodvalues was found at about −0.85‰which predicts osteoporosis (without vitamin d deficiency) for values lower or equal with a sensitivity of 100% and a specificity of 54.5%.The best cut off value for Ca isotopes in urine for δ44/42CaUrinewas found at about 0.16‰which predicts osteoporosis (without vitamin d deficiency) for values lower or equal to a sensitivity of 78.6% and specificity of 71.2%.
more test persons to suffer from osteoporosis than actually determined by DXA.
The apparent discrepancy in predicting osteoporosis between DXA as the gold standard and the Ca isotope biomarker may be reconciled taking the different methodological approaches into account.
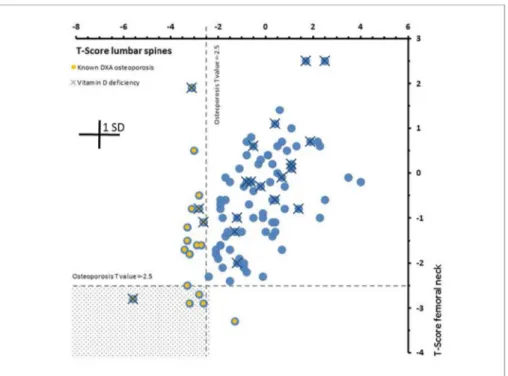
Osteoporosis induced bone Ca loss may not affect all bones simulta- neously and to the same degree. In our study, BMD heterogeneity is demonstrated by the fact that of the 18 cases, neglecting vitamin D influence, of osteoporosis diagnosed by DXA, five were jointly based on the lumbar spine and the femoral neck, while 12 were based on lumbar spine DXA alone and one on the femoral neck DXA alone (Fig. 3).
Obviously there is a distinct heterogeneity in the extent of bone de- mineralization from one bone to the other, with varying degrees of involvement in different bones and in different individuals. This is also supported by the observation that most bone fractures occur in women with normal or osteopenic BMD (Cranney et al., 2007) and there are a growing number of reports suggesting that many women who fracture have BMD higher than that usually associated with osteoporosis
((Wainwright et al., 2005) and references therein).
In contrast the Ca isotope biomarker reflects the current status and dynamics of the mineralization/demineralization process of the whole skeleton and not of a single bone. Values of δ44/42CaBlood and δ44/
42CaUrinebelow the threshold value do not necessarily indicate an acute osteoporosis but rather a significant contribution of bone Ca to the blood as it is expected for osteoporosis and eventual net loss of Ca via the urine. Latter ongoing process may then eventually result in a DXA measurable osteoporosis in a later stage. Hence, the Ca isotopes mea- sured in blood and urine reflects the net flux of bone Ca and the balance between bone mineralization and demineralization whereas DXA de- termines a distinct BMD status at a certain time. In this regard, the Ca isotope biomarker technique and DXA probably complement and ex- tend each other.
Based on the statistical values of the determined values of sensitivity and specificity in our study into we propose that in future individuals who fall below the ROC determined Ca isotope biomarker threshold values in blood and urine still undergo DXA examination to determine their individual risk of bone fracture. However, based on its high sen- sitivity to exclude osteoporosis in individuals with δ44/42CaBlood and δ44/42CaBloodvalues above the threshold limit, DXA measurements and exposure to radiation may be avoided.
4.1. Quantitative model for calcium mineralization and demineralization in humans
The results of our study show that the Ca isotopic composition of blood and urine strongly affected by mass-dependent Ca isotope frac- tionation associated with bone formation (Fig. 1). Bone is typically enriched in isotopically light Ca relative to the diet, blood and urine in terms of their Ca isotope ratios. With the following model, we de- monstrate the quantitative relationship between Ca gain and loss in the bones and the measured δ44/42CaBloodand δ44/42CaUrinevalues (Figs. 4 and 5). For simplicity in the model we focus on the δ44/42CaBloodvalue only. A similar model can also be designed for the δ44/42CaUrinevalues.
The simple two-compartment model for calcium use, transport, and fractionation in humans presented here is based on an earlier version by (Skulan and DePaolo, 1999b) on vertebrates and as well as by (Heuser and Eisenhauer, 2010) on humans. It is used to illustrate the quanti- tative relationship between skeletal Ca balance concerning bone mi- neralization and demineralization and the Ca isotope composition of blood (δ44/42CaBlood) (Figs. 4 and 5). The parameters in the model are (i) FDiet and δ44/42CaDiet, Ca flux and isotope composition of dietary calcium entering the body; (ii) FBone-Gainand δ44/42CaBone-Gain, Ca flux from the blood to the bone and its Ca isotope composition; (iii) FBone-Loss
and δ44/42CaBone-Loss, Ca flux out of the bone and its isotope composi- tion; (iv) Fexand δ44/42Caex, Ca flux and isotope composition of the excreted Ca from the organism; and (v) the term ΔBonereflects the Ca isotope fractionation during Ca precipitation in the bone during mi- neralization. This conceptual model depicted inFig. 4results in a dif- ferential Eq.(1)which can be rearranged showing the dependency of δ44/42CaBloodfrom the Ca fluxes into (FBone-Gain) and out of the bones (FBone-Loss).
= + Ca
dt F Ca Ca
F Ca Ca
F F Ca Ca
[ ]
[ ]
[ ]
Blood
Diet Diet Blood
Bone Loss Bone Loss Blood
Bone Gain Bone Ex Ex Blood
44/42
44/42 44/42
44/42 44/42
44/42 44/42
(2) In steady state (44/42dtCaBlood=0) and assuming that the term FEx 4442CaEx 4442CaBlood is actually close to zero Eq.(2)can be re- arranged:
Table 3a
Criteria to assess the diagnostic power of Ca isotopes in blood (δ44/42CaBlood).
Serum δ44/42Ca: Osteoporosis
without Vitamin D deficiency Osteoporosis without Vitamin
D deficiency Total
No Yes
No (> −0,8475) 36 (45,0%) 0 (0%) 36 (45%)
Yes (≤−0,8475) 30 (37,5%) 14 (17,5%) 44 (55%)
Total 66 (82,5%) 14 (17,5%) 80 (100%)
Quality criteria Value 95%-CI
Lower limit Upper limit
Prevalence 17.50% 9.91% 27.62%
Sensitivity 100.00% 76.84% 100.00%
Specificity 54.55% 41.81% 66.86%
Positive predictive value 31.82% 18.61% 47.58%
Negative predictive value 100.00% 90.26% 100.00%
Positive likelihood ratio (LR+) 2.20 1.69 2.87
Negative Likelihood ratio (LR-) 0 0 0
Correct classification rate 62.50% 50.96% 73.08%
Youden-Index 54.55% 42.53% 66.56%
LR+ = Sensitivity/(1-Specificity); LR- = (1-Sensitivity)/Specificity.
Table 3b
Criteria to assess of diagnostic power of Ca isotopes in urine (δ44/42CaUrine).
Urine δ44/42Ca: Osteoporosis
without Vitamin D deficiency Osteoporosis without Vitamin D
deficiency Total
No Yes
No (> 0,1638) 47 (58,8%) 3 (3,8%) 50 (62,5%)
Yes (≤−0, 1638) 19 (23,8%) 11 (13,8%) 30 (37,5%)
Total 66 (82,5%) 14 (17,5%) 80 (100%)
Quality criteria Value 95%-CI
Lower limit Upper limit
Prevalence 17.50% 9.91% 27.62%
Sensitivity 78.57% 49.20% 95.34%
Specificity 71.21% 58.75% 81.70%
Positive predictive value 36.67% 19.93% 56.14%
Negative predictive value 94.00% 83.45% 98.75%
Positive likelihood ratio (LR+) 2.73 1.71 4.36 Negative Likelihood ratio (LR-) 0.30 0.11 0.83 Correct classification rate 72.50% 61.38% 81.90%
Youden-Index 49.78% 25.67% 73.89%
LR+ = Sensitivity/(1-Specificity); LR- = (1-Sensitivity)/Specificity.
= +
+ Ca
F Ca F Ca F
F F
( )
Blood
Diet Diet Bone Loss Bone Loss Bone Gain Bone
Diet Bone Loss 44/42
44/42 44/42
(3) Define:R=FFBone Gain
Bone Loss
Then, rearranging of 3:
= +
+ Ca
F Ca F Ca F R
F F
( )
Blood
Diet Diet Bone Loss Bone Loss Bone Loss Bone
Diet Bone Loss 44/42
44/42 44/42
(4) In Eq. (4) the values for δ44/42CaDiet (−0.41‰), δ44/42CaBone
(−1.14‰) and ΔBone(−0.3‰) are already known from our study data (Fig. 1), tables and the discussions above. Furthermore, values for the absorbed amount of diet (FDiet) are taken to be 0.15 gCa/day as calcu- lated from our data and in accordance with literature values (Heaney, 2006). The two unknowns are the Ca fluxes from the blood to the bones (FBone-Gain) and back from the bone to the blood (FBone-Loss). However, FBone-Gaincan be expressed as a function of FBone-loss (Eq.(4)) which allows us to present the δ44/42CaBloodvalues as a function of the FBone- Lossto FBone-Gainratio (FBone-Loss/FBone-Gain) arbitrarily assuming that the daily loss of FBone-Lossis about 1.5 gCa/day (Bushinsky, 2010). Then Eq.
(3)can unambiguously solved as a function of the FBone-Loss/FBone-Gain ratio.
FromFig. 5it can be seen that the δ44/42CaBloodvalues decrease as a function of increasing FBone-Loss/FBone-Gain values reflecting the in- creasing contribution of isotopically light Ca from the demineralizing bones to the blood (FBone-Loss/FBone-Gain ratio > 1). In contrast in- creasing Ca fluxes from the blood to the bone (FBone-Loss/FBone-Gain
ratio > 1) correspond to increasing the δ44/42CaBlood values. Equili- brium of input and output Ca fluxes (FBone-Loss= FBone-Gain) in the blood are reflected by an FBone-Loss/FBone-Gainvalue of 1 (Fig. 5).
From our study and model values a δ44/42Ca'Bloodequilibrium value of about −0.80‰ can be calculated which is closely corresponding to the average δ44/42Ca'Bloodvalue of the healthy post-menopausal women of −0.84 ± 0.14‰ (Table 1). The corresponding calculated FBone-Loss/ FBone-Gainratio of ~1.3 (Fig. 5) indicates that these women loose about 30% more Ca by bone demineralization than they gain by mineraliza- tion. The average δ44/42Ca'Bloodvalue of −0.99 ± 0.10‰ (Table 1) of the osteoporotic post-menopausal women corresponds to a value FBone- Loss/FBone-Gainratio of ~3.3 (Fig. 5) indicating that this group of women losses about 330% more Ca than it gains by bone mineralization. Note, that these losses just reflect the exchange of Ca between bones and blood and are not taking the recycling of Ca in the kidney into account.
Based on this simple quantitative model, it is made clear that the Fig. 3.Correlations between DXA T-scores from fe- moral neck and lumbar spine for all 100 subjects.
Broken horizontal and vertical lines represent T- score threshold values of −2.5 for the diagnosis of osteoporosis. DXA diagnosed osteoporosis and vi- tamin D deficiencies are marked. Osteoporosis was diagnosed in total of 18 cases. Only in 5 cases os- teoporosis was diagnosed based on T-score values of both, femoral neck and lumbar spine (marked area).
Only in one case osteoporosis is based on the femoral neck alone and in 12 cases lumbar spines alone in- dicated osteoporosis.
Fig. 4.Simplified transport model for Ca isotopes be- tween blood and bones in humans. In this model, there is no calcium isotopic fractionation associated with ab- sorption, excretion of dietary calcium and dissolution of bones. Calcium incorporated into bone is derived from the blood, and there is a fractionation (ΔBone) associated with the formation of bones.
δ44/40CaBloodvalue in humans will provide a quantitative indication of the relative rates of mineral formation (FBone-Gain) and mineral dis- solution (FBone-Loss). Organisms experiencing FBone-Loss/FBone-Gainvalue of > 1 reflecting bone demineralization should have δ44/40CaBloodva- lues that are below the equilibrium value, whereas organisms experi- encing FBone-Loss/FBone-Gain values < 1 reflecting mineralization are characterized by δ44/40CaBlood value values above the equilibrium value.
5. Limitations of our study
•
We were unable to achieve the target number of women with os- teoporosis as estimated from initial assumptions.•
A study examining a larger population of women, and ideally with repeated measurements of Ca isotope fractionation in a longitudinal follow-up study design would be recommended.•
Our study does not examine the association of Ca isotope mea- surements against fracture outcomes, and this would be an im- portant aspect for future studies.•
Our study population was also limited to post-menopausal women only, and future studies must include other groups too.•
Other factors may potentially influence the Ca isotope composition, such as changes in the amount or type of diet, changes in the rates of renal Ca reabsorption as expected in renal impairment and the rates of Ca turnover require further investigation.•
The effects of anti-resorptive therapy such as bisphosphonates or denosuamb on changes in BMD will also be the subject of future studies.6. Summary of the results and discussion
•
Bone resorption that leads to a net loss of bone Ca in women with osteoporosis cause a decrease in the Ca isotope values of blood and urine.•
Ca isotope ratios measured in blood (δ44/42CaBlood) and urine (δ44/42CaUrine) reflects the Ca balance of the whole skeleton rather than of individual bones.
•
Ca isotopes in blood and urine correlated highly significantly with each other and with the corresponding DXA measurements.Diagnostic sensitivity for the δ44/42CaBloodvalues was 100% and for the δ44/42CaUrinevalues ~72%.
•
ROC optimized cut-off values (δ44/42CaBlood< ~−0.85, δ44/42CaUrine< ~0.16) significantly discriminated individuals with and without osteoporosis.
•
Logistic regression analysis showed that the Ca isotope compositionof blood (δ44/42CaBlood) was the strongest and independent bio- marker for osteoporosis and the addition of other clinical para- meters did not improve its diagnostic power.
•
The apparently low specificity of ~55% of Ca isotopes in blood to predict osteoporosis on DXA is inherent to the methodological ap- proaches in measuring bone mineralization by DXA and the Ca isotope biomarker.Transparency document
The Transparency document associated with this article can be found, in online version.
Acknowledgement
AE acknowledges the support of the Helmholtz association and its
“Helmholtz Impuls and Vernetzungsfond”. The GEOMAR Helmholtz Centre for Ocean Research Kiel, Germany (grant number: HV0048) is gratefully acknowledged for financial support. RS is supported by a fellowship from the National Institute for Health Research (grant number: CDF-2016-09-038). Results are partly patent protected under the code numbers DE10 2018 214 660 for Germany and EP 18191474 for Europe. We thank the two anonymous reviewers for their careful reviews. Their comments and suggestions helped to significantly im- prove the manuscript.
References
Abrams, S.A., 1994. Clinical-studies of mineral metabolism in children using stable iso- topes. J. Pediatr. Gastroenterol. Nutr. 19 (2), 151–163.
Abrams, S.A., 1999. Using stable isotopes to assess mineral absorption and utilization by children. Am. J. Clin. Nutr. 70 (6), 955–964.
Abrams, S.A., Yergey, A.L., Heaney, R.P., 1994. Relationship between balance and dual tracer isotopic measurements of calcium-absorption and excretion. J. Clin.
Endocrinol. Metab. 79 (4), 965–969.
Consensus development conference: diagnosis, prophylaxis, and treatment of osteo- porosis. Am. J. Med. 94 (6), 646–650.
Beck, A.B., Bügel, S., Stürup, S., Jensen, M., Molgaard, C., Hansen, M., Krogsgaard, O.W., Sandström, B., 2003. A novel dual radio- and stable-isotope method for measuring calcium absorption in humans: comparison with the whole-body radioisotope re- tention method. Am. J. Clin. Nutr. 77, 399–405.
Boskey, A., 2008. Biomineralization of bones and teeth. Elements 3, 385–391.
Bullen, T.D., Eisenhauer, A., 2009. Metal stable isotopes in low-temperature systems: a primer. Elements 5 (6), 349–352.
Bushinsky, D., 2010. Contribution of intestine, bone, kidney, and dialysis to extracellular fluid calcium content. Clin. J. Am. Soc. Nephrol. 5, S12–S22.
Chu, N.C., Henderson, G.M., Hedges, R.E.M., 2005. Ca isotope variations in modern dietary systems and their potential to assess the importance dairying in past cultures.
Geophys. Res. Abstr. 7 (047426).
Cranney, A., Jamal, S.A., Tsang, J.F., Josse, R.G., Leslie, W.D., 2007. CMAJ 177 (6), Fig. 5.In this diagram the blood Ca isotope values are shown as a function of the FBone-Loss/FBone-Gainratios. An FBone-Loss/FBone-Gainof 1 corresponds to the equilibrium value at which FBone-Loss equals FBone-Gain. Above the equilibrium value Ca isotope values indicate a net gain of Ca from the blood and below 1 Ca isotopes indicate a net loss of Ca from the bones. The blue point marks the average Ca isotope composition of blood (δ44/42CaBlood) for the healthy post-menopausal women (FBone-Loss/FBone- Gain~1.3) and the red point marks the average compo- sition of the osteoporotic post-menopausal women (FBone- Loss/FBone-Gain~3.3). (For interpretation of the references to color in this figure legend, the reader is referred to the web version of this article.)
575–580.
DVOhttp://www.dv-osteologie.org/dvo_leitlinien/osteoporose-leitlinie-2014.
Eisenhauer, A., Kisakurek, B., Bohm, F., 2009. Marine calcification: an alkaline earth metal isotope perspective. Elements 5 (6), 365–368.
Feeman, S., King, T., Vieira, N.E., Woodhouse, L.R., Yergev, A., 1996. Human calcium metabolism including bone resorption measured with 41Ca tracer. In: 7th International Conference on Accelerator Mass Spectrometry, Tuscon, pp. 1–14.
Felsenberg, D., Alenfeld, F., Beck, O., Hammermeister, C., Gowan, W., Grp, F.S., 1998.
Placebo-controlled multicenter study of oral alendronate in postmenopausal osteo- porotic women. Maturitas 31 (1), 35–44.
Gussone, N., 2016. Calcium Stable Isotope Geochemistry. Springer-Verlag, Berlin, Heidelberg.
Heaney, R.P., 2006. The calcium economy. In: Weaver, C.M., Heaney, R.P. (Eds.), Calcium in Human Health. Human Press, Totowa, New Jersey.
Heaney, R.P., Nordin, B.E.C., 2002. Calcium effects on phosphorus absorption: implica- tions for the prevention and co-therapy of osteoporosis. J. Am. Coll. Nutr. 21 (3), 239–244.
Heuser, A., Eisenhauer, A., 2010. A pilot study on the use of natural calcium isotope (44Ca/40Ca) fractionation in urine as a proxy for the human body calcium balance.
Bone 46 (4), 889–896.
Heuser, A., Eisenhauer, A., Scholz-Ahrens, K.E., Schrezenmeir, J., 2016. Biological frac- tionation of stable Ca isotopes in Göttingen minipigs as a physiological model for Ca homeostasis in humans. Isot. Environ. Health Stud. 52 (6), 633–648.
ISCDhttps://www.iscd.org/.
Kanis, J.A., WHO, Scientific, Group, 2007. Assessment of Osteoporosis at the Primary Health-Care Level. Technical Report. World Health Organization Collaborating Centre for Metabolic Bone Diseases, Technical Report Series 843, World Health Organization: Assessment of Fracture Risk and its Application to Screening for Postmenopausal Osteoporosis University of Sheffield, UK (Printed by the University of Sheffield, Geneva: WHO, 1994).
Morgan, J.L.L., Gordon, G.W., Arrua, R.C., Skulan, J.L., Anbar, A.D., Bullen, T.D., 2011.
High-precision measurement of variations in calcium isotope ratios in urine by multiple collector inductively coupled plasma mass spectrometry. Anal. Chem. 83 (18), 6956–6962.
Morgan, J.L.L., Skulan, J.L., Gordon, G.W., Romaniello, S.J., Smith, S.M., Anbar, A.D., 2012a. Rapidly assessing changes in bone mineral balance using natural stable cal- cium isotopes. Proc. Natl. Acad. Sci. U. S. A. 109 (25), 9989–9994.
Morgan, J.L.L., Skulan, J.L., Gordon, G.E., Romaniello, S.J., Smith, S.M., Anbar, A.D., 2012b. Using natural stable calcium isotopes to rapidly assess changes in bone mi- neral balance using a bed rest model to induce bone loss. FASEB J. 26.
Skulan, J., DePaolo, D.J., 1999a. Calcium isotope fractionation between soft and mi- neralized tissues as a monitor of calcium use in vertebrates. Biochemistry 96 (24), 13709–13713.
Skulan, J., DePaolo, D.J., 1999b. Calcium isotope fractionation between soft and mi- neralized tissues as a monitor of calcium use in vertebrates. Proc. Natl. Acad. Sci. U.
S. A. 96 (24), 13709–13713.
Skulan, J., DePaolo, D.J., Owens, T.L., 1997. Biological control of calcium isotopic abundances in the global calcium cycle. Geochim. Cosmochim. Acta 61, 2505–2510.
Skulan, J., Bullen, T., Anbar, A., Puzas, J., Shackelford, L., LeBlanc, A., Smith, S., 2007.
Natural calcium isotopic composition of urine as a marker of bone mineral balance.
Clin. Chem. 53, 1155–1158.
Stürup, S., Hansen, M., Molgaard, C., 1997. Measurements of Ca-44:Ca-43 and Ca-42:Ca- 43 isotopic ratios in urine using high resolution inductively coupled plasma mass spectrometry. J. Anal. At. Spectrom. 12 (9), 919–923.
Wainwright, S.A., Marshall, L.M., Ensrud, K.E., Cauley, J.A., Black, D.M., Hillier, T.A., Hochberg, M.C., Vogt, M.T., Orwoll, E., 2005. J. Clin. Endocrinol. Metab. 90 (5), 2787–2793.
WHO, 1994. Assessment of Fracture Risk and its Application to Screening for Postmenopausal Osteoporosis. Report of a WHO Study Group. pp. 1–129.
Wieser, M.E., Buhl, D., Bouman, C., Schwieters, J., 2004. High precision calcium isotope ratio measurements using a magnetic sector multiple collector inductively coupled plasma mass spectrometer. J. Anal. At. Spectrom. 19 (7), 844–851.