Supplement to Two-step closure of the Miocene Indian Ocean Gateway
1
to the Mediterranean
2
Bialik, Or M.1*; Frank, Martin2; Betzler, Christian3; Zammit, Raymond4; Waldmann, Nicolas D.1 3
1 Dr. Moses Strauss Department of Marine Geosciences, The Leon H. Charney School of Marine Sciences, 4
University of Haifa, Carmel 31905, Israel.
5
2 GEOMAR Helmholtz Centre for Ocean Research Kiel, Kiel, Germany.
6
3 Institute of Geology, CEN, University of Hamburg, Bundesstrasse 55, Hamburg 20146, Germany.
7
4 The School of Earth and Ocean Sciences, Cardiff University, Cardiff, Wales, UK 8
*Corresponding author (orbialik@campus.haifa.ac.il) 9
10
Analytical methods
11
For Nd isotope analyses of past seawater from ferromanganese coatings of the sediment particles, the bulk 12
sediment samples consisting mainly of nannofossil and planktonic foraminifer oozes, and chalks were dried 13
and homogenised in an agate mortar. To extract the authigenic, seawater-derived Nd isotope signature, 14
approximately 2.5 g of powdered bulk sediment was treated following the procedure described in Gutjahr 15
et al. (2007) omitting the carbonate removal step. The powdered samples were rinsed three times with de- 16
ionized (MQ) water, after which 10 ml of MQ was added and 10 ml of a 0.05M hydroxylamine 17
hydrochloride/15% acetic acid solution, buffered with NaOH to a pH of 4. Samples were placed on a shaker 18
for 1 hour and centrifuged. The supernatant containing the seawater Nd isotope signature of the 19
ferromanganese coatings was pipetted off and dried down. As preparatory steps for column chemistry, all 20
samples were refluxed in concentrated HNO3 at 80C overnight, centrifuged, and 80% of the supernatant 21
was dried down. Twice, 0.5 ml of 1 M HCl was added, and the sample was dried down, after which the 22
samples were redissolved in 0.5 ml 1 M HCl. Samples were passed through cation-exchange columns with 23
0.8 ml AG50W-X12 resin (mesh size 200‒400 m), using standard procedures, to separate Sr and the Rare 24
Earth Elements (REEs), as well as removing most of the Ba (Barrat et al., 1996). A second set of columns 25
with 2 ml Ln-Spec resin (mesh size 50‒100 m) was used to separate Nd from the other REEs and 26
remaining Ba (Le Fèvre and Pin, 2005).
27
Neodymium isotope ratios were measured on a Neptune Multiple Collector Inductively Coupled Plasma 28
Mass Spectrometer (MC-ICPMS) at GEOMAR Kiel, Germany. Measured 143Nd/144Nd results were mass- 29
bias corrected to a 146Nd/144Nd ratio of 0.7219 and were normalised to the accepted 143Nd/144Nd value of 30
0.512115 for the JNdi-1 standard (Tanaka et al., 2000), which was measured after every third sample.
31
Nd isotope ratios are reported as εNd values with respect to the Chondritic Uniform Reservoir (CHUR), 32
which are calculated as εNd = [(143Nd/144Nd)sample / (143Nd/144Nd)CHUR – 1 ] * 104 using a (143Nd/144Nd)CHUR
33
value of 0.512638. No correction of the 143Nd/144Nd for ingrowth of 143Nd from 147Sm in the samples was 34
carried out given that the difference is at maximum 0.25 ɛNd units for the oldest samples. The external 35
reproducibility (2σ) of the measurements was between 0.14 and 0.25 εNd units. The internal 2σ error was 36
applied when larger than the external reproducibility. Procedural Nd blanks were ≤30 pg Nd and thus 37
negligible.
38 39
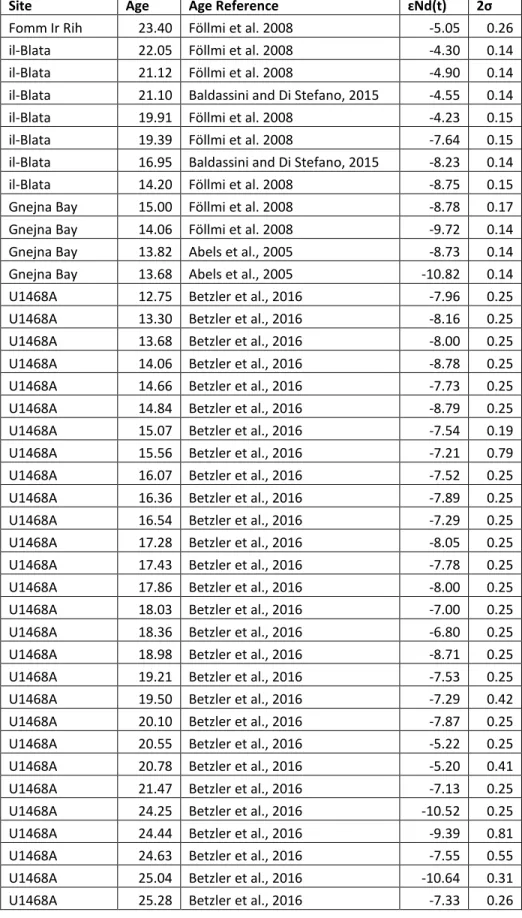
Table S1: ɛNd values from Malta and Site U1468 40
Site Age Age Reference ɛNd(t) 2σ
Fomm Ir Rih 23.40 Föllmi et al. 2008 -5.05 0.26
il-Blata 22.05 Föllmi et al. 2008 -4.30 0.14
il-Blata 21.12 Föllmi et al. 2008 -4.90 0.14
il-Blata 21.10 Baldassini and Di Stefano, 2015 -4.55 0.14
il-Blata 19.91 Föllmi et al. 2008 -4.23 0.15
il-Blata 19.39 Föllmi et al. 2008 -7.64 0.15
il-Blata 16.95 Baldassini and Di Stefano, 2015 -8.23 0.14
il-Blata 14.20 Föllmi et al. 2008 -8.75 0.15
Gnejna Bay 15.00 Föllmi et al. 2008 -8.78 0.17
Gnejna Bay 14.06 Föllmi et al. 2008 -9.72 0.14
Gnejna Bay 13.82 Abels et al., 2005 -8.73 0.14
Gnejna Bay 13.68 Abels et al., 2005 -10.82 0.14
U1468A 12.75 Betzler et al., 2016 -7.96 0.25
U1468A 13.30 Betzler et al., 2016 -8.16 0.25
U1468A 13.68 Betzler et al., 2016 -8.00 0.25
U1468A 14.06 Betzler et al., 2016 -8.78 0.25
U1468A 14.66 Betzler et al., 2016 -7.73 0.25
U1468A 14.84 Betzler et al., 2016 -8.79 0.25
U1468A 15.07 Betzler et al., 2016 -7.54 0.19
U1468A 15.56 Betzler et al., 2016 -7.21 0.79
U1468A 16.07 Betzler et al., 2016 -7.52 0.25
U1468A 16.36 Betzler et al., 2016 -7.89 0.25
U1468A 16.54 Betzler et al., 2016 -7.29 0.25
U1468A 17.28 Betzler et al., 2016 -8.05 0.25
U1468A 17.43 Betzler et al., 2016 -7.78 0.25
U1468A 17.86 Betzler et al., 2016 -8.00 0.25
U1468A 18.03 Betzler et al., 2016 -7.00 0.25
U1468A 18.36 Betzler et al., 2016 -6.80 0.25
U1468A 18.98 Betzler et al., 2016 -8.71 0.25
U1468A 19.21 Betzler et al., 2016 -7.53 0.25
U1468A 19.50 Betzler et al., 2016 -7.29 0.42
U1468A 20.10 Betzler et al., 2016 -7.87 0.25
U1468A 20.55 Betzler et al., 2016 -5.22 0.25
U1468A 20.78 Betzler et al., 2016 -5.20 0.41
U1468A 21.47 Betzler et al., 2016 -7.13 0.25
U1468A 24.25 Betzler et al., 2016 -10.52 0.25
U1468A 24.44 Betzler et al., 2016 -9.39 0.81
U1468A 24.63 Betzler et al., 2016 -7.55 0.55
U1468A 25.04 Betzler et al., 2016 -10.64 0.31
U1468A 25.28 Betzler et al., 2016 -7.33 0.26
Box model
41 42
In order to better constrain our observations, a simple box model of the Mediterranean was established. The 43
water balance of the basin was defined by equation 1:
44
1) 𝑑𝑊
𝑑𝑡
= 𝐹
𝐴𝑡𝑙𝑎𝑛𝑡𝑖𝑐+ 𝐹
𝐼𝑛𝑑𝑖𝑎𝑛+ 𝐹
𝐴𝑔𝑒𝑎𝑛+ 𝐹
𝑅𝑖𝑣𝑒𝑟𝑠− 𝐹
𝐸𝑣𝑎𝑝𝑜𝑟𝑎𝑡𝑖𝑜𝑛− 𝐹
𝑜𝑢𝑡𝑓𝑙𝑜𝑤 4546
Where F is the volume flux of water in Sv (106 m3 sec-1), Indian Ocean and Atlantic Ocean influx were set 47
at initial conditions following the results of modelling work (de la Vara et al., 2013; de la Vara and Meijer, 48
2016) at 22.64 Sv and 4.78 Sv, respectively. Evolving conditions of the Atlantic inlet were defined by a fit 49
of the relationships between the Indian and Atlantic inlet in the different modelling experiments (Fig. S1).
50
Due to uncertainty regarding the exchange with the Paratethys and the proto Aegean Sea, two modern 51
values of pre- and post-East Mediterranean Transient (EMT) of 0.35 Sv to 1.2 Sv (Roether and Klein, 1998;
52
Roether et al., 2007), respectively, were used in two different runs of the model. Riverine influx was 53
estimated at 0.025 Sv (Simon et al., 2017). Operating under the assumption of a constant volume for the 54
Mediterranean (3.75x10¹⁴ m3) set to modern water flux values, mass was balanced to be setting the outflux 55
equal to total influx minus evaporation (set to the modern value of 0.08 Sv following Shaltout and Omstedt, 56
2015) as defined by equation 2:
57
2)
𝐹
𝑜𝑢𝑡𝑓𝑙𝑜𝑤= ∑ 𝐹
𝑖𝑛𝑖− 𝐹
𝑒𝑣𝑝𝑜𝑟𝑎𝑡𝑖𝑜𝑛 5859
The neodymium concentration of the box was defined by equation 3 and εNd by equation 4:
60
3) 𝑑[𝑁𝑑]
𝑑𝑡
= 𝐹
𝐴𝑡𝑙𝑎𝑛𝑡𝑖𝑐[𝑁𝑑]
𝐴𝑡𝑙𝑎𝑛𝑡𝑖𝑐+ 𝐹
𝐼𝑛𝑑𝑖𝑎𝑛[𝑁𝑑]
𝐼𝑛𝑑𝑖𝑎𝑛+ 𝐹
𝐴𝑔𝑒𝑎𝑛[𝑁𝑑]
𝐴𝑔𝑒𝑎𝑛+
61𝐹
𝑅𝑖𝑣𝑒𝑟𝑠[𝑁𝑑]
𝑅𝑖𝑣𝑒𝑟𝑠− 𝐹
𝑜𝑢𝑡𝑓𝑙𝑜𝑤[𝑁𝑑]
𝑜𝑢𝑡𝑓𝑙𝑜𝑤 624) 𝑑𝜀𝑁𝑑
𝑑𝑡
= 𝐹
𝐴𝑡𝑙𝑎𝑛𝑡𝑖𝑐[𝑁𝑑]
𝐴𝑡𝑙𝑎𝑛𝑡𝑖𝑐𝜀𝑁𝑑
𝐴𝑡𝑙𝑎𝑛𝑡𝑖𝑐+ 𝐹
𝐼𝑛𝑑𝑖𝑎𝑛[𝑁𝑑]
𝐼𝑛𝑑𝑖𝑎𝑛𝜀𝑁𝑑
𝐼𝑛𝑑𝑖𝑎𝑛+
63𝐹
𝐴𝑔𝑒𝑎𝑛[𝑁𝑑]
𝐴𝑔𝑒𝑎𝑛𝜀𝑁𝑑
𝐴𝑔𝑒𝑎𝑛+ 𝐹
𝑅𝑖𝑣𝑒𝑟𝑠𝑓
𝑁𝑖𝑙𝑒[𝑁𝑑]
𝑅𝑖𝑣𝑒𝑟𝑠𝜀𝑁𝑑
𝑁𝑖𝑙𝑒+ 𝐹
𝑅𝑖𝑣𝑒𝑟𝑠(1 −
64𝑓
𝑁𝑖𝑙𝑒)[𝑁𝑑]
𝑅𝑖𝑣𝑒𝑟𝑠𝜀𝑁𝑑
𝑅ℎ𝑜𝑛𝑒− 𝐹
𝑜𝑢𝑡𝑓𝑙𝑜𝑤[𝑁𝑑]
𝑜𝑢𝑡𝑓𝑙𝑜𝑤𝜀𝑁𝑑
𝑀𝑒𝑑 6566
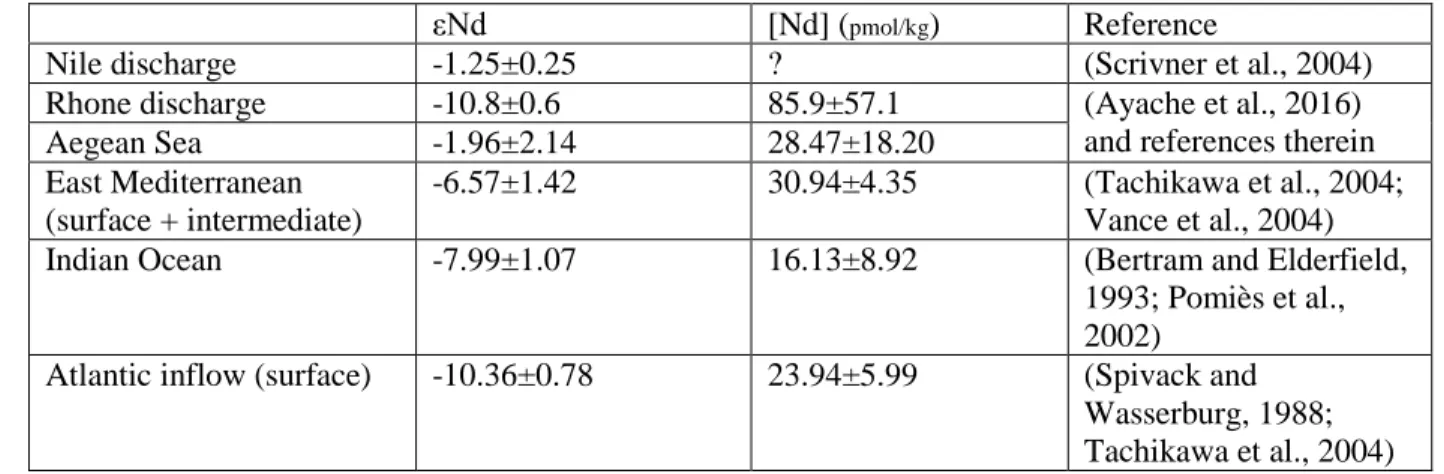
Where fNile represents the fraction of the total freshwater supply supplied by the Nile River (based on pre- 67
1900 values; Said, 1993). Neodymium concentration and εNd values for each of the water sources are 68
detailed in Table S2. Given that no concentration data are available for the Nile, it was assumed they are 69
similar to that of the Rhone. Based on ferromanganese crust data (O’Nions et al., 1998) and the results of 70
this study for the western Indian Ocean, present-day values of ɛNd for the Indian Ocean appear to be 71
reasonable for the Miocene. Results of this version of the run are shown in figure S2. Further experiments 72
carried out with the model using different values for the possible contribution sources (based on other 73
sources noted in the text as well as observed values for the Maldives from this data set) have failed to 74
reproduce the observed range of the Early Miocene from the Maltese record (Fig. S3).
75
To account for a possible volcanic contribution along the gateway itself a modification of the Indian Ocean 76
flux component was introduced resulting in the following equations:
77
5) 𝑑[𝑁𝑑]
𝑑𝑡
= 𝐹
𝐴𝑡𝑙𝑎𝑛𝑡𝑖𝑐[𝑁𝑑]
𝐴𝑡𝑙𝑎𝑛𝑡𝑖𝑐+ 𝐹
𝐼𝑛𝑑𝑖𝑎𝑛([𝑁𝑑]
𝐼𝑛𝑑𝑖𝑎𝑛+ [𝑁𝑑]
𝑣𝑜𝑙𝐴/10
3𝐹
𝐼𝑛𝑑𝑖𝑎𝑛) +
78𝐹
𝐴𝑔𝑒𝑎𝑛[𝑁𝑑]
𝐴𝑔𝑒𝑎𝑛+ 𝐹
𝑅𝑖𝑣𝑒𝑟𝑠[𝑁𝑑]
𝑅𝑖𝑣𝑒𝑟𝑠− 𝐹
𝑜𝑢𝑡𝑓𝑙𝑜𝑤[𝑁𝑑]
𝑜𝑢𝑡𝑓𝑙𝑜𝑤 796) 𝑑𝜀𝑁𝑑
𝑑𝑡
= 𝐹
𝐴𝑡𝑙𝑎𝑛𝑡𝑖𝑐[𝑁𝑑]
𝐴𝑡𝑙𝑎𝑛𝑡𝑖𝑐𝜀𝑁𝑑
𝐴𝑡𝑙𝑎𝑛𝑡𝑖𝑐+ 𝐹
𝐼𝑛𝑑𝑖𝑎𝑛([𝑁𝑑]
𝐼𝑛𝑑𝑖𝑎𝑛𝜀𝑁𝑑
𝐼𝑛𝑑𝑖𝑎𝑛+
80[𝑁𝑑]𝑣𝑜𝑙𝐴𝜀𝑁𝑑𝑣𝑜𝑙𝐴
103𝐹𝐼𝑛𝑑𝑖𝑎𝑛
) + 𝐹
𝐴𝑔𝑒𝑎𝑛[𝑁𝑑]
𝐴𝑔𝑒𝑎𝑛𝜀𝑁𝑑
𝐴𝑔𝑒𝑎𝑛+ 𝐹
𝑅𝑖𝑣𝑒𝑟𝑠𝑓
𝑁𝑖𝑙𝑒[𝑁𝑑]
𝑅𝑖𝑣𝑒𝑟𝑠𝜀𝑁𝑑
𝑁𝑖𝑙𝑒+
81𝐹
𝑅𝑖𝑣𝑒𝑟𝑠(1 − 𝑓
𝑁𝑖𝑙𝑒)[𝑁𝑑]
𝑅𝑖𝑣𝑒𝑟𝑠𝜀𝑁𝑑
𝑅ℎ𝑜𝑛𝑒− 𝐹
𝑜𝑢𝑡𝑓𝑙𝑜𝑤[𝑁𝑑]
𝑜𝑢𝑡𝑓𝑙𝑜𝑤𝜀𝑁𝑑
𝑀𝑒𝑑 8283
84
Where NdvolAis the total contribution of the neodymium introduced into to the seaway mixed with Indian 85
Ocean waters along the northern Arabian Plate, and ɛNdvolA represents the corresponding ɛNd, which was 86
set at +5, the median value of all the potential sources (Lease and Abdel-Rahman, 2008; Azizi and 87
Moinevaziri, 2009; Trifonov et al., 2011; Ma et al., 2013). The results of this iteration are shown in figure 88
3 of the main text. In order to contribute the needed amount of radiogenic Nd as observed in the Early 89
Miocene of Malta, some 0.2 mol/sec were needed to be supplied along the conduit. Assuming an area of 2 90
x 105 km2,a mean Nd content of 31.5 ppm and basalt density of 3 g / cm3 the erosion rate required would 91
be 0.048 mm/year.
92
The model was run for 250 years from the initial modern value of the Eastern Mediterranean to steady state.
93
The steady state values were used as initial conditions for subsequent runs during which FIndian was 94
diminished stepwise from the initial value of 22 Sv to 0 Sv. Each iteration of the diminishing flux runs was 95
run for 250 years to allow for a steady state to be established.
96
To account for a possible contribution from a western Mediterranean source, we also allowed for 97
contribution from a source along the Atlantic source:
98
7) 𝑑[𝑁𝑑]
𝑑𝑡
= 𝐹
𝐴𝑡𝑙𝑎𝑛𝑡𝑖𝑐([𝑁𝑑]
𝐴𝑡𝑙𝑎𝑛𝑡𝑖𝑐+ [𝑁𝑑]
𝑣𝑜𝑙𝑆/10
3𝐹
𝐴𝑡𝑙𝑎𝑛𝑡𝑖𝑐) + 𝐹
𝐼𝑛𝑑𝑖𝑎𝑛([𝑁𝑑]
𝐼𝑛𝑑𝑖𝑎𝑛+
99[𝑁𝑑]
𝑣𝑜𝑙𝐴/10
3𝐹
𝐼𝑛𝑑𝑖𝑎𝑛) + 𝐹
𝐴𝑔𝑒𝑎𝑛[𝑁𝑑]
𝐴𝑔𝑒𝑎𝑛+ 𝐹
𝑅𝑖𝑣𝑒𝑟𝑠[𝑁𝑑]
𝑅𝑖𝑣𝑒𝑟𝑠− 𝐹
𝑜𝑢𝑡𝑓𝑙𝑜𝑤[𝑁𝑑]
𝑜𝑢𝑡𝑓𝑙𝑜𝑤 1008) 𝑑𝜀𝑁𝑑
𝑑𝑡
= 𝐹
𝐴𝑡𝑙𝑎𝑛𝑡𝑖𝑐([𝑁𝑑]
𝐴𝑡𝑙𝑎𝑛𝑡𝑖𝑐𝜀𝑁𝑑
𝐴𝑡𝑙𝑎𝑛𝑡𝑖𝑐+
[𝑁𝑑]𝑣𝑜𝑙𝑆𝜀𝑁𝑑𝑣𝑜𝑙𝑆103𝐹𝐴𝑡𝑙𝑎𝑛𝑡𝑖𝑐
) +
101𝐹
𝐼𝑛𝑑𝑖𝑎𝑛([𝑁𝑑]
𝐼𝑛𝑑𝑖𝑎𝑛𝜀𝑁𝑑
𝐼𝑛𝑑𝑖𝑎𝑛+
[𝑁𝑑]𝑣𝑜𝑙𝐴𝜀𝑁𝑑𝑣𝑜𝑙𝐴103𝐹𝐼𝑛𝑑𝑖𝑎𝑛
) + 𝐹
𝐴𝑔𝑒𝑎𝑛[𝑁𝑑]
𝐴𝑔𝑒𝑎𝑛𝜀𝑁𝑑
𝐴𝑔𝑒𝑎𝑛+
102𝐹
𝑅𝑖𝑣𝑒𝑟𝑠𝑓
𝑁𝑖𝑙𝑒[𝑁𝑑]
𝑅𝑖𝑣𝑒𝑟𝑠𝜀𝑁𝑑
𝑁𝑖𝑙𝑒+ 𝐹
𝑅𝑖𝑣𝑒𝑟𝑠(1 − 𝑓
𝑁𝑖𝑙𝑒)[𝑁𝑑]
𝑅𝑖𝑣𝑒𝑟𝑠𝜀𝑁𝑑
𝑅ℎ𝑜𝑛𝑒−
103𝐹
𝑜𝑢𝑡𝑓𝑙𝑜𝑤[𝑁𝑑]
𝑜𝑢𝑡𝑓𝑙𝑜𝑤𝜀𝑁𝑑
𝑀𝑒𝑑 104105
Where NdvolSis the total contribution of the neodymium introduced to water coming from the Atlantic and 106
ɛNdvolS represents the corresponding ɛNd, which was set at -4, the median value based on sources in Sardinia 107
(Downes et al., 2001). This western Mediterranean source was scaled to half the Arabian source in the 108
experiments. These values represent a maximum value used to estimate the highest impact. For illustration, 109
figure S4 shows the output of a model experiment using the maximum erosion input rate. While there is 110
some dampening of the trend by this source, its contribution is not highly significant nor changes the 111
outcomes in any significant manner even at this high relative contribution.
112 113 114
Table S2: Modern neodymium composition of the Mediterranean and source end members 115
εNd [Nd] (pmol/kg) Reference
Nile discharge -1.25±0.25 ? (Scrivner et al., 2004)
Rhone discharge -10.8±0.6 85.9±57.1 (Ayache et al., 2016)
and references therein
Aegean Sea -1.96±2.14 28.47±18.20
East Mediterranean (surface + intermediate)
-6.57±1.42 30.94±4.35 (Tachikawa et al., 2004;
Vance et al., 2004)
Indian Ocean -7.99±1.07 16.13±8.92 (Bertram and Elderfield,
1993; Pomiès et al., 2002)
Atlantic inflow (surface) -10.36±0.78 23.94±5.99 (Spivack and Wasserburg, 1988;
Tachikawa et al., 2004) 116
117 118
119
Figure S1: Relation between influx from the Indian (IG) and Atlantic (AG) Oceans into the 120
Mediterranean based on published model simulations (de la Vara et al., 2013; de la Vara, 2015; de la Vara 121
and Meijer, 2016) 122
123
124
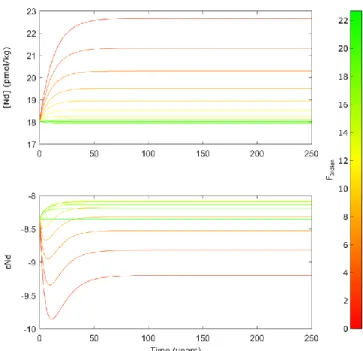
Figure S2: model results for Nd concentration and ɛNd in the Mediterranean using Indian ocean fluxes (F 125
Indian) and composition of water as described in Table S1.
126
127
Figure S3: Partial outputs of different runs of the model where the ɛNd of the inputs was changed.
128
129
Figure S5: Model output results comparing changes in the ɛNd of Mediterranean seawater along a 130
diminishing contribution from the Indian Ocean with a northern Arabian Plate contribution and a 131
combination of the western Mediterranean and northern Arabian Plate contribution.
132 133
Additional figures
134
135
Figure S6: Compilation of all ɛNd from the Indian Ocean and the Mediterranean discussed in this 136
manuscript.
137
138
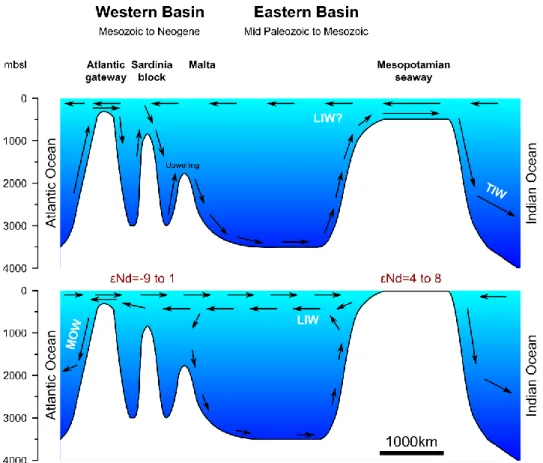
Figure S7: Schematic illustration of the main circulation patterns in the Mediterranean and in either 139
gateway before (upper) and after (lower) decoupling from the Indian Ocean. Directions are based on 140
Hamon et al. (2013); de la Vara et al. (2013); de la Vara (2015) and de la Vara and Meijer (2016). ɛNd 141
values listed refer to values of exposed volcanic rocks in the marked locations; see text.
142 143
References:
144
Ayache M., Dutay J. C., Arsouze T., Révillon S., Beuvier J. and Jeandel C. (2016) High-resolution 145
neodymium characterization along the Mediterranean margins and modelling of Nd distribution in 146
the Mediterranean basins. Biogeosciences 13, 5259–5276.
147
Azizi H. and Moinevaziri H. (2009) Review of the tectonic setting of Cretaceous to Quaternary volcanism 148
in northwestern Iran. J. Geodyn. 47, 167–179.
149
Barrat J. A., Keller F., Amossé J., Taylor R. N., Nesbitt R. W. and Hirata T. (1996) Determination of rare 150
earth elements in sixteen silicate reference samples by ICP-MS after tm addition and ion exchange 151
separation. Geostand. Geoanalytical Res. 20, 133–139.
152
Bertram C. J. and Elderfield H. (1993) The geochemical balance of the rare earth elements and 153
neodymium isotopes in the oceans. Geochim. Cosmochim. Acta 57, 1957–1986.
154
Downes H., Thirlwall M. . and Trayhorn S. . (2001) Miocene subduction-related magmatism in southern 155
Sardinia: Sr–Nd- and oxygen isotopic evidence for mantle source enrichment. J. Volcanol.
156
Geotherm. Res. 106, 1–22. Available at:
157
http://linkinghub.elsevier.com/retrieve/pii/S0377027300002699.
158
Le Fèvre B. and Pin C. (2005) A straightforward separation scheme for concomitant Lu–Hf and Sm–Nd 159
isotope ratio and isotope dilution analysis. Anal. Chim. Acta 543, 209–221. Available at:
160
http://linkinghub.elsevier.com/retrieve/pii/S0003267005006860.
161
Gutjahr M., Frank M., Stirling C. H., Klemm V., van de Flierdt T. and Halliday A. N. (2007) Reliable 162
extraction of a deepwater trace metal isotope signal from Fe–Mn oxyhydroxide coatings of marine 163
sediments. Chem. Geol. 242, 351–370.
164
Hamon N., Sepulchre P., Lefebvre V. and Ramstein G. (2013) The role of eastern tethys seaway closure 165
in the middle miocene climatic transition (ca. 14 Ma). Clim. Past 9, 2687–2702.
166
de la Vara A. (2015) Model Analysis of the Role of Marine Gateways in the Palaeoceanography of the 167
Miocene Mediterranean and Paratethys., Utrecht studies in Earth Sciencies, No. 98, Utrecht.
168
de la Vara A. and Meijer P. (2016) Response of Mediterranean circulation to Miocene shoaling and 169
closure of the Indian Gateway: A model study. Palaeogeogr. Palaeoclimatol. Palaeoecol. 442, 96–
170
109.
171
de la Vara A., Meijer P. T. and Wortel M. J. R. (2013) Model study of the circulation of the Miocene 172
Mediterranean Sea and Paratethys: closure of the Indian Gateway. Clim. Past Discuss. 9, 4385–
173
4424.
174
Lease N. A. and Abdel-Rahman A. F. M. (2008) The Euphrates volcanic field, northeastern Syria:
175
Petrogenesis of Cenozoic basanites and alkali basalts. Geol. Mag. 145, 685–701.
176
Ma G. S.-K., Malpas J., Suzuki K., Lo C.-H., Wang K.-L., Iizuka Y. and Xenophontos C. (2013) 177
Evolution and origin of the Miocene intraplate basalts on the Aleppo Plateau, NW Syria. Chem.
178
Geol. 335, 149–171.
179
O’Nions R. ., Frank M., von Blanckenburg F. and Ling H.-F. (1998) Secular variation of Nd and Pb 180
isotopes in ferromanganese crusts from the Atlantic, Indian and Pacific Oceans. Earth Planet. Sci.
181
Lett. 155, 15–28.
182
Pomiès C., Davies G. R. and Conan S. M. H. (2002) Neodymium in modern foraminifera from the Indian 183
Ocean: Implications for the use of foraminiferal Nd isotope compositions in paleo-oceanography.
184
Earth Planet. Sci. Lett. 203, 1031–1045.
185
Roether W. and Klein B. (1998) The great eastern Mediterranean deep-water transient. Rapp. Comm. Int.
186
Mer Méditérranée 35, 12–16.
187
Roether W., Klein B., Manca B. B., Theocharis A. and Kioroglou S. (2007) Transient Eastern 188
Mediterranean deep waters in response to the massive dense-water output of the Aegean Sea in the 189
1990s. Prog. Oceanogr. 74, 540–571.
190
Said R. (1993) The River Nile. Geology, Hydrology and Utilization., Pergamon, Oxford.
191
Scrivner A. E., Vance D. and Rohling E. J. (2004) New neodymium isotope data quantify Nile 192
involvement in Mediterranean anoxic episodes. Geology 32, 565–568.
193
Shaltout M. and Omstedt A. (2015) Modelling the water and heat balances of the Mediterranean Sea 194
using a two-basin model and available meteorological, hydrological, and ocean data. Oceanologia 195
57, 116–131.
196
Simon D., Marzocchi A., Flecker R., Lunt D. J., Hilgen F. J. and Meijer P. T. (2017) Quantifying the 197
Mediterranean freshwater budget throughout the late Miocene: New implications for sapropel 198
formation and the Messinian Salinity Crisis. Earth Planet. Sci. Lett. 472, 25–37.
199
Spivack A. J. and Wasserburg G. J. (1988) Neodymium isotopic composition of the Mediterranean 200
outflow and the eastern North Atlantic. Geochim. Cosmochim. Acta 52, 2767–2773.
201
Tachikawa K., Roy-Barman M., Michard A., Thouron D., Yeghicheyan D. and Jeandel C. (2004) 202
Neodymium isotopes in the Mediterranean Sea: Comparison between seawater and sediment 203
signals. Geochim. Cosmochim. Acta 68, 3095–3106.
204
Tanaka T., Togashi S., Kamioka H., Amakawa H., Kagami H., Hamamoto T., Yuhara M., Orihashi Y., 205
Yoneda S., Shimizu H., Kunimaru T., Takahashi K., Yanagi T., Nakano T., Fujimaki H., Shinjo R., 206
Asahara Y., Tanimizu M. and Dragusanu C. (2000) JNdi-1: a neodymium isotopic reference in 207
consistency with LaJolla neodymium. Chem. Geol. 168, 279–281.
208
Trifonov V. G., Dodonov A. E., Sharkov E. V., Golovin D. I., Chernyshev I. V., Lebedev V. A., Ivanova 209
T. P., Bachmanov D. M., Rukieh M., Ammar O., Minini H., Al Kafri A. M. and Ali O. (2011) New 210
data on the Late Cenozoic basaltic volcanism in Syria, applied to its origin. J. Volcanol. Geotherm.
211
Res. 199, 177–192.
212
Vance D., Scrivner A. E., Beney P., Staubwasser M., Henderson G. M. and Slowey N. C. (2004) The use 213
of foraminifera as a record of the past neodymium isotope composition of seawater.
214
Paleoceanography 19, 1–17.
215 216