Proceedings of the International Ocean Discovery Program Volume 361 publications.iodp.org
https://doi.org/10.14379/iodp.proc.361.202.2020
Data report: evaluation of shipboard magnetostratigraphy by alternating field demagnetization of discrete samples, Expedition 361, Site U1475
1J. Just2 and the Expedition 361 Scientists3
Keywords: International Ocean Discovery Program, IODP, JOIDES Resolution, Expedition 361, Site U1475, anhysteretic remanent magnetization, natural remanent magnetization
1 Just, J., and the Expedition 361 Scientists, 2020. Data report: evaluation of shipboard magnetostratigraphy by alternating field demagnetization of discrete samples, Expedition 361, Site U1475. In Hall, I.R., Hemming, S.R., LeVay, L.J., and the Expedition 361 Scientists, South African Climates (Agulhas LGM Density Profile). Proceedings of the International Ocean Dis- covery Program, 361: College Station, TX (International Ocean Discovery Program). https://doi.org/10.14379/iodp.proc.361.202.2020
2 Faculty of Geoscience, University of Bremen, Germany. Correspondence author: janna.just@uni-bremen.de
3 Expedition 361 Scientists’ affiliations.
MS 361-202: Received 08 November 2019 · Accepted 14 April 2020 · Published 15 July 2020 This work is distributed under the Creative Commons Attribution 4.0 International (CC BY 4.0) license.
Contents
1 Abstract 1 Introduction
3 Materials and methods 3 Results
3 Concluding remark 3 Acknowledgments 4 References
Abstract
The paleomagnetic shipboard data of International Ocean Dis- covery Program Site U1475, with a record reaching back to approx- imately 7 Ma, allowed for the identification of major magnetic polarity chrons and subchrons back to ~3.5 Ma. However, the natu- ral remanent magnetization (NRM) was very weak, and transitional intervals with unclear polarity were as thick as several meters. The midpoints of these transitional intervals were reported in the shipboard results without decimal places because of the poor data quality. To evaluate and possibly refine the shipboard magneto- stratigraphy, subsampling was performed across the polarity transi- tions. Detailed alternating field (AF) demagnetization experiments were conducted on these discrete samples and were complemented by anhysteretic remanent magnetization acquisition measurements and subsequent demagnetization. AF demagnetization data of NRM were analyzed using anchored principal component analysis (PCA) to obtain the characteristic remanent magnetization. These PCA results generally confirm the smoothed signal across polarity transitions at Site U1475. However, the midpoint depths of the top of the Keana Subchron, the Gauss-Matuyama and Matuyama-Brun- hes boundaries, and the base of the Olduvai Subchron were ad- justed.
Introduction
Sediment cores from International Ocean Discovery Program (IODP) Expedition 361 Site U1475 (41°25.61′S, 25°15.64′E; 2669 m water depth) located at the Agulhas Plateau provide a continuous sedimentary record of the past approximately 7 My (see the Site
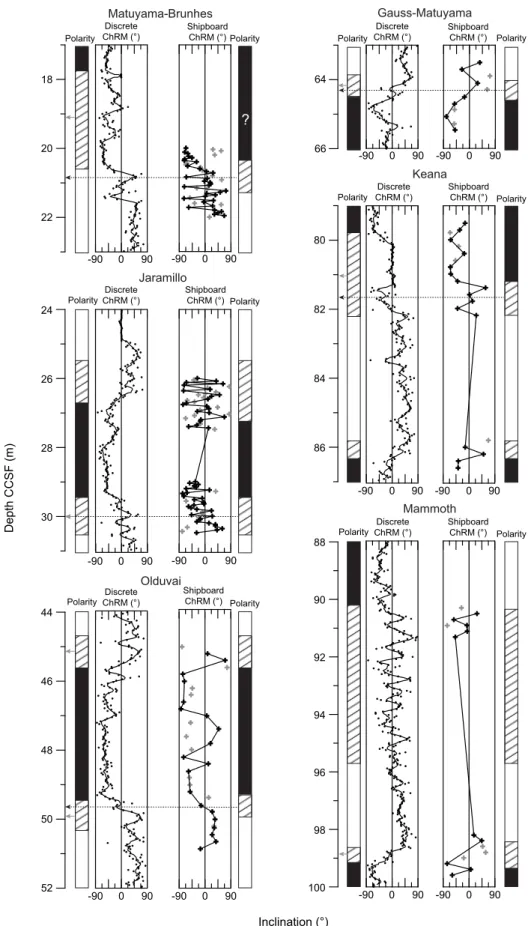
U1475 chapter [Hall et al., 2017]). These carbonate-rich sediments have a low concentration of magnetic minerals and therefore a weak paleomagnetic signal. Although we could identify major paleo- magnetic chrons and subchrons, the precise position of their boundaries was difficult to determine because changes in inclina- tions were stretched over 1–2 m and sometimes up to 5 m (Figure F1). Such thick intervals and assumed sedimentation rates of ~3 cm/ky (see the Site U1475 chapter [Hall et al., 2017]) would corre- spond to a duration of 30–60 ky, whereas observed reversal pro- cesses are generally much faster in other archives. In particular, for the Matuyama–Brunhes transition, durations between a few centu- ries (e.g., Just et al., 2019; Macrì et al., 2018; Sagnotti et al., 2016) and 5–10 ky (e.g., Channell, 2017; Valet and Fournier, 2016; Xuan et al., 2016) have been observed. The polarity transition at the base of Jaramillo Subchron was recently found to have occurred within less than 3 ky (Just et al., 2019).
Varying durations for the polarity transitions may result from regional expressions of nondipole components of the Earth’s mag- netic field (Leonhardt and Fabian, 2007); however, the apparently very long durations at Site U1475 likely result from depositional, compositional, or analytical effects. Virtually longer transitions could be related to the recording process in the sediment, for exam- ple, a low potential to record field changes when magnetic mineral concentrations are low or when the Earth magnetic field dipole component is weak (e.g., Valet and Fournier, 2016). Moreover, a deep lock-in zone (Shcherbakov and Shcherbakova, 1987) in combi- nation with low sedimentation rates would result in an averaged re- corded paleomagnetic signal within the sample volume (e.g., Roberts et al., 2013; Valet and Fournier, 2016). Smoothed transitions could also result from magnetic overprint imparted by the Earth’s
Figure F1. Characteristic remanent magnetization (ChRM) inclinations of discrete samples across magnetic polarity zone boundaries compared with shipboard inclination data. Polarity is based on shipboard (left) and discrete sample (right) data. Black (white) stands for normal (reversed) polarity, and transitional phases are indicated by hatched pattern. Inner left column shows shipboard individual measurements (dots) with a 5-point running average (line). Inner right column shows discrete sample ChRM inclinations with maximum angular deviations (MADs) <15° in black, joined by a line. PCA inclinations with MADs >15°
are shown as gray crosses. Arrows point toward the midpoint depths of the two data sets. CCSF = core composite depth below seafloor.
18
20
22
Depth CCSF (m)
24
26
28
30
44
46
48
50
64
66
80
82
84
86
88
90
92
94
96 Matuyama-Brunhes
Jaramillo
Olduvai
Gauss-Matuyama
Keana
Mammoth
?
Shipboard ChRM (°)
Shipboard ChRM (°)
Shipboard ChRM (°)
Shipboard ChRM (°) Discrete
ChRM (°)
Discrete ChRM (°)
Discrete ChRM (°)
Discrete ChRM (°) Discrete ChRM (°) Discrete
ChRM (°)
Shipboard ChRM (°)
Shipboard ChRM (°) -90 0 90
-90 0 90 -90 0 90
-90 0 90
-90 0 90 -90 0 90
-90 0 90 -90 0 90 Polarity
Polarity Polarity
Polarity
Polarity
Polarity
Polarity
Polarity
Polarity
Polarity Polarity
Polarity
magnetic field or from the coring process (Richter et al., 2007). Core halves were subjected to a soft alternating field (AF) demagnetiza- tion treatment (25 mT) on board to minimize the latter overprinting effects. Smoothing could also be related to the response curve of the magnetometer, resulting in averaging of data across 20 cm of the sediment core (Richter et al., 2007), but this cannot account for the smearing of directions across meter scales.
To evaluate whether all viscous and coring overprints were re- moved by the shipboard AF treatment and to refine the shipboard magnetostratigraphy, discrete samples from the working halves were taken across polarity zone boundaries and subjected to de- tailed AF demagnetization experiments. These data were then ana- lyzed by principal component analysis (PCA) (Kirschvink, 1980), and the characteristic remanent magnetization (ChRM) was calcu- lated for each sample.
Materials and methods
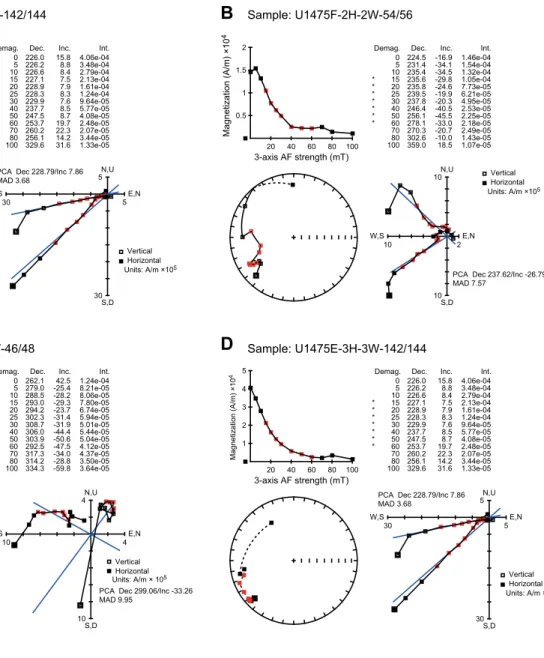
In total, 269 discrete 8 cm3 cube samples were collected from working halves of the spliced core composite. Sampling focused on the Gauss–Matuyama and Matuyama–Brunhes polarity transitions, as well as on the base and top of the Mammoth, Keana, Olduvai, and Jaramillo Subchrons, which were identified in the shipboard mag- netic data (see the Site U1475 chapter [Hall et al., 2017]). Cube samples were measured using a 2G cryogenic superconducting rock magnetometer at the University of Bremen (Germany). The natural remanent magnetization (NRM) was demagnetized using 12 AF steps between 5 and 100 mT peak fields. Afterward, an anhysteretic remanent magnetization (ARM) was imparted using a 100 mT AF and a 50 μT bias field, and the samples were subsequently demagne- tized using the same 12 AF steps. PCA of NRM demagnetization data was performed using Puffinplot software (Lurcock and Wilson, 2012) to compute the ChRM. Because the demagnetization data of some samples cluster at stable components (cf. Figure F2C), per- forming PCA without using the origin as an anchoring point would result in random directions. We therefore chose the PCA anchored to the origin for the analyses. The number of steps included was adapted to data quality of individual samples and varies between four and six steps. The maximum angular deviation (MAD) of the PCA inclinations provides further quality control of the computed directional data. Because data were not corrected for core orienta- tions, we present here only the inclination.
Results
Magnetic intensities of NRM (see U1457NRM.xlsx in Supple- mentary material) are on the order of 10−1 to 10−2 mA/m, which is only a factor of 10–100 higher than the sample handler magnetiza- tion. Consequently, demagnetization diagrams are of mixed quality and are noisy for low-intensity samples. Nevertheless, even some of the weak samples show clustering inclinations for successive demagnetization steps so that ChRM with acceptable MAD values <15° have been computed (Figure F2) using the an- chored PCA approach. ARM varies between 1 and 10−1 mA/m (see
U1475ARM.xlsx and U1475ARMdemag.xlsx in Supplementary material).
Figure F1 displays the shipboard split core inclination data next to the ChRM of discrete samples (see U1475ChRM.xlsx in Supple- mentary material) and the inferred polarity from both data sets.
Shipboard and refined polarity boundary midpoints are presented in Table T1. It should be noted that because of the noisy character of the data, the shipboard midpoint depths (see the Site U1475 chapter [Hall et al., 2017]) were reported in meters without decimal places.
Discrete samples with MAD values <15° are plotted in black and connected by a line, and samples with MAD values >15° (poor qual- ity) are indicated in gray. At the base of the Mammoth Subchron, the polarity transition in the shipboard data is reproduced by the discrete samples (midpoint depth = ~99 m), whereas at its top, subsampling was not sufficient to capture the transition. In the shipboard data, the transition is stretched over some meters. Addi- tionally, the base of the Keana Subchron was not captured in the discrete sample measurements. At the top of the Keana Subchron, the polarity switch from reversed to normal polarity appears sharper than in the split core data (82.2–81.2 m) with a midpoint depth of 81.7 m. At the top of the Gauss Chron, the midpoint of the polarity boundary at ~64 m from the shipboard data is corrobo- rated. For both the base of the Olduvai (~50 m) and the Jaramillo (~30 m) Subchrons, the ChRM parallels the change in the shipboard inclination. For the Olduvai Subchron, the transition appears to be narrower in the discrete samples (49.8–49.2 m) with a derived mid- point depth of 49.5 m. The tops of Olduvai and Jaramillo Subchrons are inconclusive from the discrete samples. For the Matuyama–
Brunhes boundary, a change in inclination corresponds to the ship- board data. The transitional interval was previously postulated be- tween 20.8 and 17.8 m (see the Site U1475 chapter [Hall et al., 2017]) (Figure F1). In light of the new discrete samples, it appears that the Matuyama–Brunhes transition only spans 21.2–20.5 m and has a corresponding midpoint depth of 20.8 m. However, the transi- tional interval visible in the shipboard split core data is not wholly covered by the subsamples, which leaves some uncertainty.
Concluding remark
The new discrete sample demagnetization data set largely paral- lels the shipboard data and supports the shipboard magnetostrati- graphy. Some transitional zones appear thinner in the discrete sample data and lead to revised midpoint depths.
Acknowledgments
This research used samples provided by the IODP, and we thank the staff of the IODP Gulf Coast Repository at College Station for logistical support during the sampling party. The M8 PostDoc Ini- tiative Plus of the University of Bremen sponsored the analytical costs for this study. We thank Tim van Peer for constructive review of the data report. Analytical data are also stored at the Pangaea da- tabase (https://doi.pangaea.de/10.1594/PANGAEA.913401).
References
Channell, J.E.T., 2017. Complexity in Matuyama-Brunhes polarity transitions from North Atlantic IODP/ODP deep-sea sites. Earth and Planetary Sci-
Hall, I.R., Hemming, S.R., LeVay, L.J., and the Expedition 361 Scientists, South African Climates (Agulhas LGM Density Profile). Proceedings of the International Ocean Discovery Program, 361: College Station, TX (International Ocean Discovery Program).
https://doi.org/10.14379/iodp.proc.361.104.2017
Just, J., and the Expedition 361 Scientists, 2020. Supplementary material, https://doi.org/10.14379/iodp.proc.361.202Supp.2020. Supplement to Just, J., and the Expedition 361 Scientists, 2020.Data report: evaluation Figure F2. Results of alternating field (AF) demagnetization for selected samples with different demagnetization behaviors. For each sample, four panels are shown: (1) intensity after incremental AF demagnetization; (2) intensity, inclination, and declination for each field step, as well as the field steps used for PCA (stars); (3) equal area projections; and (4) Zijderfeld diagrams for demagnetization data. For the latter, blue lines indicate the fitted PCA inclination and declina- tions, which are also given in an inset together with the maximum angular deviation (MAD). A. Sample 361-U1475E-3H-3W, 142–144 cm, shows a clear demag- netization path. B. Although data are noisy, characteristic directions with a MAD of 7° were obtained for Sample 361-U1475F-2H-2W, 54–56 cm. C. For Sample 361-U1475E-4H-2W, 46–48 cm, data of individual field steps cluster and a ChRM direction with MAD <10° was computed. D. Sample 361-U1475B-10H-3W,108–
110 cm, shows consistent but changing directions upon demagnetization, indicating the stepwise removal of various overprints. Analyses and graphics were produced using Puffinplot (Lurcock and Wilson, 2012).
5 E,N
30 S,D 30
W,S
5N,U 1
2 3 4 5
Magnetization (A/m) ×104
20 40 60 80 100
3-axis AF strength (mT)
Demag. Dec. Inc. Int.
0 226.0 15.8 4.06e-04 5 226.2 8.8 3.48e-04 10 226.6 8.4 2.79e-04
* 15 227.1 7.5 2.13e-04
* 20 228.9 7.9 1.61e-04
* 25 228.3 8.3 1.24e-04
* 30 229.9 7.6 9.64e-05
* 40 237.7 8.5 5.77e-05
* 50 247.5 8.7 4.08e-05
* 60 253.7 19.7 2.48e-05 70 260.2 22.3 2.07e-05 80 256.1 14.2 3.44e-05 100 329.6 31.6 1.33e-05
PCA Dec 228.79/Inc 7.86 MAD 3.68
Sample: U1475E-3H-3W-142/144
Vertical Horizontal Units: A/m ×105
2 E,N
10 S,D 10
W,S
10N,U 0.5
1 1.5 2
Magnetization (A/m) ×104
20 40 60 80 100
3-axis AF strength (mT)
Demag. Dec. Inc. Int.
0 224.5 -16.9 1.46e-04 5 231.4 -34.1 1.54e-04 10 235.4 -34.5 1.32e-04
* 15 235.6 -29.8 1.05e-04
* 20 235.8 -24.6 7.73e-05
* 25 239.5 -19.9 6.21e-05
* 30 237.8 -20.3 4.95e-05
* 40 246.4 -40.5 2.53e-05
* 50 256.1 -45.5 2.25e-05
* 60 278.1 -33.0 2.18e-05 70 270.3 -20.7 2.49e-05 80 302.6 -10.0 1.43e-05 100 359.0 18.5 1.07e-05
PCA Dec 237.62/Inc -26.79 MAD 7.57
Sample: U1475F-2H-2W-54/56
Vertical Horizontal Units: A/m ×105
4 E,N
10 S,D 10
W,S
4 N,U 0.5
1 1.5
Magnetization (A/m) ×104
20 40 60 80 100
3-axis AF strength (mT)
Demag. Dec. Inc. Int.
0 262.1 42.5 1.24e-04 5 279.0 -25.4 8.21e-05 10 288.5 -28.2 8.06e-05
* 15 293.0 -29.3 7.80e-05
* 20 294.2 -23.7 6.74e-05
* 25 302.3 -31.4 5.94e-05
* 30 308.7 -31.9 5.01e-05
* 40 306.0 -44.4 5.44e-05
* 50 303.9 -50.6 5.04e-05 60 292.5 -47.5 4.12e-05 70 317.3 -34.0 4.37e-05 80 314.2 -28.8 3.50e-05 100 334.3 -59.8 3.64e-05
PCA Dec 299.06/Inc -33.26 MAD 9.95
Sample: U1475E-4H-2W-46/48
Vertical Horizontal Units: A/m × 105
5 E,N
30S,D 30
W,S
5 N,U 1
2 3 4 5
Magnetization (A/m) ×104
20 40 60 80 100
3-axis AF strength (mT)
Demag. Dec. Inc. Int.
0 226.0 15.8 4.06e-04 5 226.2 8.8 3.48e-04 10 226.6 8.4 2.79e-04
* 15 227.1 7.5 2.13e-04
* 20 228.9 7.9 1.61e-04
* 25 228.3 8.3 1.24e-04
* 30 229.9 7.6 9.64e-05
* 40 237.7 8.5 5.77e-05
* 50 247.5 8.7 4.08e-05
* 60 253.7 19.7 2.48e-05 70 260.2 22.3 2.07e-05 80 256.1 14.2 3.44e-05 100 329.6 31.6 1.33e-05
PCA Dec 228.79/Inc 7.86 MAD 3.68
Sample: U1475E-3H-3W-142/144
Vertical Horizontal Units: A/m × 105
A B
C D
Table T1. Revised polarity reversal midpoint depths. Download table in CSV format.
Just, J., Sagnotti, L., Nowaczyk, N.R., Francke, A., and Wagner, B., 2019.
Recordings of fast paleomagnetic reversals in a 1.2 Ma greigite-rich sedi- ment archive from Lake Ohrid, Balkans. Journal of Geophysical Research:
Solid Earth, 124(12):12445–12464.
https://doi.org/10.1029/2019JB018297
Kirschvink, J.L., 1980. The least-squares line and plane and the analysis of palaeomagnetic data. Geophysical Journal of the Royal Astronomical Soci- ety, 62(3):699–718.
https://doi.org/10.1111/j.1365-246X.1980.tb02601.x
Leonhardt, R., and Fabian, K., 2007. Paleomagnetic reconstruction of the global geomagnetic field evolution during the Matuyama/Brunhes transi- tion: iterative Bayesian inversion and independent verification. Earth and Planetary Science Letters, 253(1–2):172–195.
https://doi.org/10.1016/j.epsl.2006.10.025
Lurcock, P.C., and Wilson, G.S., 2012. PuffinPlot: a versatile, user-friendly program for paleomagnetic analysis. Geochemistry, Geophysics, Geosys- tems, 13(6):Q06Z45. https://doi.org/10.1029/2012GC004098 Macrì, P., Capraro, L., Ferretti, P., and Scarponi, D., 2018. A high-resolution
record of the Matuyama-Brunhes transition from the Mediterranean region: the Valle di Manche section (Calabria, Southern Italy). Physics of the Earth and Planetary Interiors, 278:1–15.
https://doi.org/10.1016/j.pepi.2018.02.005
Richter, C., Acton, G., Endris, C., and Radsted, M., 2007. Technical Note 34:
Handbook for Shipboard Paleomagnetists. Ocean Drilling Program.
https://doi.org/10.2973/odp.tn.34.2007
Roberts, A.P., Tauxe, L., and Heslop, D., 2013. Magnetic paleointensity strati- graphy and high-resolution Quaternary geochronology: successes and future challenges. Quaternary Science Reviews, 61:1–16.
https://doi.org/10.1016/j.quascirev.2012.10.036
Sagnotti, L., Giaccio, B., Liddicoat, J.C., Nomade, S., Renne, P.R., Scardia, G., and Sprain, C.J., 2016. How fast was the Matuyama-Brunhes geomagnetic reversal? A new subcentennial record from the Sulmona Basin, central Italy. Geophysical Journal International, 204(2):798–812.
https://doi.org/10.1093/gji/ggv486
Shcherbakov, V.P., and Shcherbakova, V.V., 1987. On the physics of acquisition of postdepositional remanent magnetization. Physics of the Earth and Planetary Interiors, 46(1–3):64–70. https://doi.org/10.1016/0031- 9201(87)90171-3
Valet, J.-P., and Fournier, A., 2016. Deciphering records of geomagnetic rever- sals. Reviews of Geophysics, 54(2):410–446.
https://doi.org/10.1002/2015RG000506
Xuan, C., Channell, J.E.T., and Hodell, D.A., 2016. Quaternary magnetic and oxygen isotope stratigraphy in diatom-rich sediments of the southern Gardar Drift (IODP Site U1304, North Atlantic). Quaternary Science Reviews, 142:74–89. https://doi.org/10.1016/j.quascirev.2016.04.010