474 Douma and van Dalen: Diagnostic value of haptoglobin and transferrin levels in serum Z. Klin. Chem. Klin. Biochem.
12.Jg. 1974, S. 474-476
An Evaluation of the Diagnostic Value of Haptoglobin and Transferrin Levels in Serum
r· t By G. J. Douma and A. van Dalen
Laboratory of Clinical Chemistry and Radionuclear Medicine (Director Dr. A. van Dalen) Bleuland Hospital, Gouda, The Netherlands .
(Eingegangenam 2 2 . Februar/8. August 1974) . · . ' ; '
Levels of haptoglobin and transferrin in serum from patients with a diagnosis of lung carcinoma were assessed in view of the recent work published by Abraham & Schutt (1970), this j. 8, 92-98 and Schutt & Hoffmeister (1971), this j. P, 201-206.
These levels were also compared with those obtained from patients with either a lung inflammation or an extraneous malignancy.
Die Konzentrationen von Haptoglobin und Transferrin im Serum von Patienten mit Lungencarcinom werden unter dem Aspekt der Arbeiten von Abraham & Schutt (1970), diese Z. 8, 92-98 und Schutt & Hoffmeister (1971), diese Z. P, 201-206, betrachtet.
Die Werte werden außerdem mit denen von Patienten mit Pneumonie oder extrapulmonalen Carcinomen verglichen.
Abraham (1) and Schutt (2), employing the method of continuous polyacrylamide electrophoresis for the sepa^
ration of serum proteins, found abnormal variations of haptoglobin levels together with those of transferrin (these proteins being a2- and j3-globulins respectively), which gave a good indication for an early diagnosis of bronchial neoplasms. These authors reported (1,2) that in patients with various inflammatory lung pro- cesses, the haptoglobin rises above normal, but in the case of bronchial neoplasms these values are much higher than in benign lung processes, while transferrin levels are lower.
We were somewhat suspicious of a report by Nyman (3) about the conclusion of Abraham (1) and Schutt (2), which caused us to reinvestigate the possible correlation between haptoglobin and transferrin values and bronchial processes. Values of these globulins were divided into three groups according to the patient anamnesis and diagnosis:
I. From very likely to certain bronchial carcinoma.
II. Benign lung processes, like embolism, pneumonism, etc.
III. Other malignancies, like breast or prostate carci-
v noma, etc.
Materials and Methods
-' Disc-Electrophoresis was performed by:
a) Analytical Acrylophor M 140 (Pleuger, Wijnegem).
b) Canalco apparatus with a special QDF-kit for fine splitting of serum proteins (Canalco Europe, Vlaardingen).
The quantitative measurement of haptoglobin and transferrin was done by the method of radial diffusion (4) on M-Partigen plates (Behringwerke, Marburg-Lahn).
Protein standard serum-B (Behringwerke, Marburg^Lahn) was used as a standard.
The typing of haptoglobin was necessary because in using M-Partigen plates (Behringwerke, Marburg-Lahn) we needed different factors for the quantitative determination of the genetic types: Hp 1-1; Hp 2-1; Hp 2-2.
Typing of haptoglobin was performed by discontinuous polyacrylamide electrophoresis (5, 6), and found to give a high number of very sharp bands which in spite of their good reso- lution were difficult to identify.
The number of bands with their moving distances is specific for the genetic type (1).
Levels of haptoglobin and transferrin were determined in fifty two healthy donors ill order to obtain the normal range of values of these globulins. ·
Classification of the groups I, II and III was made from a study of the anamnesis and diagnosis of the patient, a pathological confirmation of the latter being available in most cases.
Results
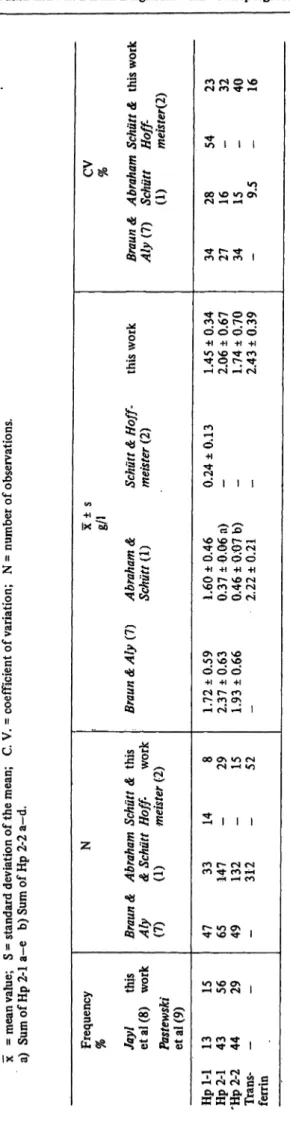
The normal range levels of haptoglobin and transferrin found in this work are summarized in table 1, together with the results of other authors.
The following mean values were found:
Hp 1-1; Hp 2-1; Hp 2-2: 1.45, 2.06 and 1.74 g/1 respec- tively, and for transferrin 2.43 g/1.
These results are in good agreement with those of Braun
&Aly (7), who also used the radial diffusion technique with Protein standard serum-B of Behringwerke (Mar- burg-Lahn), our values being lowered by a factor of about 0.9.
The results abtained by Abraham (1) and Schutt (2) which used the continuous electrophoresis method are in disagreement with the results of Braun &Aly (7)
Z. Klin. Chem. Klin. Biochem. / 12. Jahrg. 1974 / Heft 10
Douma and van Dalen: Diagnostic value of haptoglobin and transferrin levels in serum 475
e/jC
.0
1
1 °
Λ 0Μ ϊ 1
<U cΙ * 51
•a g
·§ |
s 'S
M w
i « • 1
§ 8C II
1°;
o ^cd C*o E
Ί C i
|||
1 1*8
s *^ ε
•5 4l <»
§ J3·
i ϊτ
d w «β•| «3
0 §*0
1* u fe ix 1e
i-H
'S H
|
.2
4-1
~M ^
*Q <^*'
ill
vvait; S> |
^ ^ "§ S
•^ "S ^
***~ IT δ ·£>
flQ^
o£
.£3
^
^S § §
n.
C/i
•fl _
*~
"*ί νί τς £>
ε
«a
| δ
||
(N
Hl
fc ^ 2 i§•I^~^ ^ ^
Ǥ
H^s
t/ί »·«
o ^ ;§'S i
| ^r l®'
^ »t« iltS
f ) <S O VO
»o 1 1 1
*o
OO VO Ό ON
?! R S ι
^· r^ O o>
eo vo r*· m
+1 +1 -fl +1
*o vo -^ m
^ O P^ Tf
£J>i— 1 +1
1 1 1
/-s
vo vo c^· — t
^- O O C4 C> O Q 0 +1 +1 +1 -H
O r- vo <N
VO CO -«fr <N
^H CD oi
iO VO VO +1 +1 +1
<N r- c^>
oo ON *o C"4
<N -H »o
2 ι ι ι
CO Γ- <N <S CO ^- cO *H
*H ^H CO
r- »o os ,
<*· vo ^- 1
10 VO ON . i-l »Ο Γ4 1
CO CO ^·
-H ^ 01
^0,^ § Ί
^cSand with those reported here. However, the mean trans- ferrin value of Abraham (1) and ScAtftt (2) (2.22 g/1) is comparable with our transferrin mean value (2.43 g/1).
The haptoglobin values of the groups I, II and III are shown in table 2.
Tab. 2. Haptoglobin values of patient groups I, II, III and normal value.
χ = mean value; S = standard deviation of the mean;
C. V. = coefficient of variation; N = number of patients.
Ν χ S CV (g/D (g/D (%) Group 1 35 6.30 2.63 42 Group II 30 6.18 1.70 28 Group III 37 6.99 2.75 39 Control Group 52 1.91 0.72 38
It is obvious that the mean value of haptoglobin is markedly elevated in the three patient groups as com- pared with the control group of fifty two healthy donors.
Transferrin values were taken at random in the patient groups I, II and III and showed in all groups a definite lowered mean value in relation with the donors.
The differences in the mean haptoglobin values of patients groups I, II and III are not statistically signifi- cant. (Student t-test).
Discussion
The normal mean value of haptoglobin found by Abraham (1) and Schutt (2), when that value is taken as
the sum of the polymeric bands obtained by con- tinuous polyacrylamide electrophoresis,
xHp 2-1 = xHp 2-1 a + xHp 2-1 b + xHp 2-1 c>
give a lower value than the one we reported here. How- ever, these authors have reported very different values (1.60 g/1) and 0.24 g/1 in 1. c. (1) and 1. c. (2) respec- tively for the haptoglobin Hp 1-1.
Abraham (1) and Schutt (2) studied haptoglobin levels in two groups:
I. patients with bronchial neoplasms.
II. patients with inflammatory or other benign pro- cesses in the lung. Within their patient groups they worked out the results according to the haptoglobin types. It was evident that the differences in the mean haptoglobin values were statiscally significant between both groups for all the three haptoglobin types.
We therefore concluded from these results that without differentiation of the Hp-type there was still a signifi- cant difference in the mean value of haptoglobin between their patient groups.
Z. Klin. Chem. Klin. Biochem. / 12. Jahrg. 1974 / Heft 10
476 Douma and van Dalen: Diagnostic value of haptoglobin and transferrin levels in serum
The only reason we did a genetic typing of haptoglobin was the fact that different factors are given for the different haptoglobin types using M-Partigen pjates. The factors for Hp 2-1 and Hp 2-2 on M-Partigen plates are however not very different (1.3 and 1.5 respectively).
Our frequency distribution of the genetic types of haptoglobin differs from that found by Jay l et äl. (8) andPastewski et al. (9).
Nevertheless we found the same frequency distribution within our patient groups I, II and III and the group of healthy donors.
A reasonable explanation seems to be that typing of haptoglobins using the haptoglobin-hemqglobin com- plex was not so easy to identify between Hp 2-1 and Hp 2-2.
The mean values of haptoglobin in our patient groups I, II and III are at least three times the mean normal value.
However, between the patient groups we found no statistically significant difference. Abraham (1) and
Schutt (2), with comparable patient groups I and II, have a clearly significant difference between their groups.
The only reasonable explanation of this phenomenon seems to be the different techniques that were used.
In our opinion the radial immunodiffusion technique, which is widely used in the quantitative measurement of serum proteins, cannot contribute to the diffe- rentiation of haptoglobin values in malignant or benign lung processes.
All that remains of significant value is: An increase in haptoglobin levels together with a lowered transferrin level gives an indication of a pathological condition.
Our investigation seems to be in agreement with the con- clusion öfNyman (3):
The determination of haptoglobin is of no or very little importance for the diagnosis of an early or later phase of cancer.
References
1. Abraham, K. & Schutt, K. (1970), this j. 8, 92-98. · 2. Schutt, K. & Hoffmeister (1971), this j. 9, 201-206.
3. Nyman, M. (1959), Scand. J. Clin. Lab. Invest. 11, suppl.
39.
4. Mancini, G., Carbonara, A. O. & Heremans, J. F. (1963), Immunochemistry 2, 235-254.
5. Ornstein, L. (1964), Annals N. Y. Acad. Sei. 121, 321.
6. Davis, B. J. (1964), Annals N. Y. Acad. Sei. 121, 404.
7. Braun, H. J. & Aly, F. W. (1971), this j. P, 508-515.
8. Jayle, M. F. & Moretti, J. (1962), Progr. Hemat. 3, 342.
9. Pastewski, J. V., Ness, A. T. & Peacock, A. C. (1966), Clin. Chem. Acta 14, 219-226.
Drs. G. J. Douma, Bleulandziekenhuis Bleulandweg 10 Gouda
The Netherlands
Z. Klin. Chem. Klin. Biochem. /12. Jahrg. 1974/Heft 10