FROM THE SEAFLOOR INTO THE NORTH SEA dissertation
zur Erlangung des Doktorgrades
der Mathematisch-Naturwissenschaftlichen Fakultät der Christian-Albrechts-Universität zu Kiel
LISA VIELSTÄDTE
Kiel, 2015
Koreferent: ... Priv. Doz. Dr. Mark Schmidt Tag der mündlichen Prüfung: ... 22.02.2016
Zum Druck genehmigt: ... 22.02.2016
Der Dekan
Hiermit erkläre ich, dass die vorliegende Doktorarbeit selbständig, abgesehen von der Beratung durch den Betreuer, erstellt wurde. Weder diese noch eine ähnliche Arbeit wurden an einer anderen Abteilung oder Hochschule im Rahmen eines Prüfungsverfahrens vorgelegt, veröffentlicht oder zur Veröffentlichung vorgelegt. Ferner versichere ich, dass die Arbeit unter Einhaltung der Regeln guter wissenschaftlicher Praxis der Deutschen Forschungsgemeinschaft entstanden ist.
Kiel, den 15. Dezember 2015
Lisa Vielstädte
This study was realized under supervision of Dr. Matthias Haeckel and Prof. Dr. Klaus Wallmann. In the beginning, I would like to thank Matthias for his professional support, his readiness for discussion, and for the pleasant and amicable working atmosphere throughout the period of my PhD. Thank you, Matthias!
I sincerely thank Prof. Dr. Klaus Wallmann for accepting me as a PhD student within the Research Unit Marine Geosystems and for acting as a co-supervisor and referee for this dissertation. Klaus had always an open ear and many times he gave helpful advise. Thank you, Klaus!
I would also like to thank Dr. Marcus Dengler for being a member of my Thesis Committee.
Marcus provided valuable insights into phyiscal oceanography which considerably helped to improve the progress in plume dispersion modelling. Thank you, Marcus!
Moreover, I am grateful to Prof. Dr. Daniel F. McGinnis for fruitful cooperation and for supporting me in the very beginning of my PhD. He provided first valuable insights into bubble dissolution modelling. Thank you, Dan!
Special thanks go to Dr. Jens Karstens, who supported me with seismic data analysis. He also joint me at the International Conference “Gas in Marine Sediments” in Taipei and various ECO2 project meetings. It was always a pleasure to discuss and have him by my side! Thank you, Jens!
I would also like to thank Prof. Dr. Jens Greinert and Prof. Dr. John Pohlman who saw the potential of integrating my studies on gas bubble dissolution into their work. This work resulted in a manuscript and two conference talks, which I could contribute to as a co-author.
In this context, I would also like to thank Prof. Dr. Rachael James for involving me into her work. This cooperation resulted into a co-authorship of a review paper on effects of climate change on methane emissions from the seafloor sediments in the Arctic Ocean.
During my PhD, I took part in five seagoing expeditions. I would like to owe thanks to the crews and masters of RV Alkor and RV Celtic Explorer as well as the teams of ROV Kiel 6000 and Phoca for their valuable support during the cruises CE12010 and AL412. I gratefully thank Dr. Peter Linke and Sergiy Cherednichenko who designed the Gas Release Experiment providing extensive data for this dissertation. Special thanks go to Meike Dibbern, Matthias Haeckel, and Dirk Schroller for their support during onboard geochemical analysis. I also gratefully acknowledge the research diving team, Nikolaus Bigalke, Christian Howe, and Matthias Kreuzburg for excellent collaboration and support during our expeditions to natural CO2 seeps offshore Panarea Island. Without their outstanding expertise much of the work
Further, I would also like to thank the DFG-funded Cluster of Excellence “The Future Ocean”, the projects ECO2, MIDAS, and SUGAR for financing my PhD studies and for giving me the possibility to present the progress of my work at various international project meetings, workshops, and conferences.
I also want to thank all my colleagues and friends at GEOMAR for the friendly atmosphere.
Special thanks go to Christian Deusner and Dirk Schroller who shared an office with me.
Thank you for the nice conversation, the friendly working climate, and for tolerating the chaos on my desk!
Special thanks go to my friends and family for always supporting me. In particular, I want to thank Jana Wellendorf for her valuable support in the final phase of my PhD and Björn Klein for his encouragement and the affectionate companionship during the past years.
| I
Leakage from hydrocarbon wells is of concern because the primary fugitive component of oil and gas is methane (CH4) – a potent greenhouse gas (GHG) which has a significant warming potential. Current regulations only target the leakage of produced fossil fuels from surface oil and gas installations (wellhead, pumps, controllers etc.), commonly identified by testing of sustained casing pressure. Because operators and regulators stop assessing well integrity after well abandonment and do not consider shallow gas migration along the outside of wells, fugitive CH4 emissions are currently underestimated. Understanding GHG emissions from the hydrocarbon-industry requires a profound knowledge of all types of leakage, including well integrity failure and shallow gas migration from both active and abandoned wells.
Consequently, the present thesis investigates the leakage of shallow gas along hydrocarbon wells; one of the missing emission sources in GHG inventories.
In the North Sea, and in other hydrocarbon-prolific areas of the world shallow gas pockets are frequently observed in the sedimentary overburden above the deep hydrocarbon reservoirs. When drilling wells for oil and gas exploration and production, these shallow gas accumulations are penetrated, thereby fracturing the sediment surrounding the well providing a highly permeable escape route for the shallow gas.
Chapter II provides the first qualitative and quantitative data on this type of leakage in the North Sea. It presents geochemical and seismic analysis of anthropogenic gas emissions at three abandoned wells in the Central North Sea and estimates the emitted seabed and atmospheric methane fluxes. The data are interpreted with respect to the geology at the wells and compared to other anthropogenic emissions at the blowout site (22/4b) and natural methane seepage in the North Sea. High methane concentrations, low abundance of higher hydrocarbons, and light ∂13C-signatures in the emanating gas, a geochemical signature that significantly differs from the deep hydrocarbon reservoirs, clearly point towards a shallow, biogenic emissions source. Quantitative data further indicate that the methane emissions at the three investigated wells are comparable to those at major natural seeps in the North Sea and thus, constitute an unconsidered, but potentially significant methane source.
To further investigate the relevance of these anthropogenic methane fluxes, a North Sea-wide quantification of drilling-induced CH4 emissions is provided in Chapter III. Quantifications are based on the extrapolation of observed gas emissions at the three leaky wells investigated in Chapter II and by correlating seismically mapped shallow gas pockets with 55 well paths in a representative area of the Central North Sea. Seismic evidence of numerous wells poking through shallow gas pockets indicates that one third of the existing well may leak methane.
be almost 10-times larger than the other known methane sources (rivers, Wadden Sea, and natural seeps). It may account for a large fraction of the methane export into the North Atlantic and the atmospheric degassing flux which exceed the known sources by one order of magnitude. Together with other anthropogenic emissions from the blowout site (22/4b), the calculated methane input from shallow gas leakage largely closes the CH4 budget of the North Sea.
The findings of Chapter II and III indicate that shallow gas leakage is likely a widespread phenomenon in the North Sea. This conclusion has important implications for Carbon Capture and Storage (CCS) since it implies that leakage from a carbon dioxide (CO2) storage site can potentially occur along any type of well (production, exploration, or abandoned), as long as it penetrates the subsurface CO2 plume.
As a consequence Chapter IV focuses on the Sleipner CO2 storage site in the Central North Sea and investigates hypothetic, but probably realistic leakage of CO2 along a well that penetrates the subsurface CO2 plume and leaks into the ~80 m deep water column, using a combination of experimental field data and numerical modelling. The data are interpreted with respect to potential environmental consequences and leak detection. The results demonstrate that the impact and detectability of such leakage at low rates (<55 t yr-1 of CO2) would be very localized, i.e. a few tens to one hundred meter around the gas release spot which is arguably not significant on a regional scale. Strong tidal currents and cycles, both prominent in the North Sea, significantly diminish the spreading of low-pH water masses into the far field of a leak by efficiently diluting elevated pCO2 levels with background concentrations. The consequences of a single well leaking CO2 are thus, found to be insignificant in terms of storage performance, environmental impact, and a climate control point of view.
Considering the millions of oil and gas wells drilled world-wide and the prospective implementation of CCS at a scale that would have significant impact on global CO2 emissions, the leakage of gas along wells may become a wide-spread phenomenon contributing to future anthropogenic emissions of carbon-based greenhouse gases (CH4 and prospectively CO2), particularly onshore where gas is directly emitted into the atmosphere. This thesis stresses that pressure-based testing of well integrity is not sufficient for identifying and quantifying gas emissions (CH4 or CO2) along hydrocarbon wells. Therefore, it is important to improve our surveying and monitoring efforts and adapt the respective regulatory frameworks (national and international).
| III
Undichte Kohlenwasserstoff-Bohrungen sind besorgniserregend, da die primär flüchtige Komponente von Öl und Gas Methan (CH4) ist – ein starkes Treibhausgas welches erheblich zur globalen Klimaerwärmung beiträgt. Derzeitige Regulierungen verpflichten die Betreiber und Aufsichtsbehörden ausschließlich dazu die Freisetzung produzierter Kohlenwasserstoffe zu fahnden. Dieses wird üblicherweise durch spezielle Drucktests am Bohrkopf festgestellt.
Die Integrität stillgelegter Bohrlöcher und die mögliche Migration von flachem Gas entlang der Bohrloch-Außenseite sind daher weitesgehend unbekannt. Dies führt zu einer Unterschätzung der flüchtigen CH4 Emissionen in die Atmosphäre. Ein umfassendes Verständnis dieser industriellen CH4 Emissionen erfordert detaillierte Kenntnisse über alle Leckagearten, einschließlich solcher, die durch das Integritätsversagen und der Migration von flachem Gas verursacht werden, sowohl von aktiven als auch stillgelegten Bohrlöchern.
Die vorliegende Arbeit beschäftigt sich daher mit einem der in den Treibhausgasinventaren fehlenden industriellen Emissionsquellen: das Austreten von flachem Gas entlang Öl- und Gasbohrungen.
In der Nordsee, wie auch in anderen Kohlenwasserstoff-reichen Gebieten der Welt, kommen flache Gasakkumulationen sehr häufig in den Sedimenten über den tiefen Kohlenwasserstoffvorkommen vor. Beim Bohren für die Öl- und Gasexploration und -Produktion werden diese flachen Gasansammlungen durchbohrt und die umliegenden Sedimente gestört und zerklüftet, wodurch sich durchlässige Wegsamkeiten für das umliegende flache Gas bilden.
Kapitel II beinhaltet die ersten qualitativen und quantitativen Daten zu dieser Art der Leckage in der Nordsee. Es präsentiert geochemische und seismische Analysen anthropogener Gasaustritte entlang von drei stillgelegten Bohrlöchern in der zentralen Nordsee und schätzt die emittierten Methanflüsse am Meeresboden und in die Atmosphäre ab. Die Daten werden im Hinblick auf die lokale Geologie an den Bohrlöchern interpretiert und mit anderen anthropogenen Emissionen an dem Gas-Blowout (22/4b) sowie natürlichen Methanaustritten in der Nordsee verglichen. Hohe Methan-Konzentrationen, geringe Mengen an höheren Kohlenwasserstoffen und leichte ∂13C-Werte in den austretenden Gasen, eine Signatur deutlich unterschiedlich derer tiefer Kohlenwasserstoff-Reservoire, weisen auf eine biogene Gasquelle im flachen Untergrund hin. Quantitative Daten zeigen, dass die von den drei untersuchten Bohrlöchern freigesetzten Methanemissionen mit denen natürlicher Methanaustritte in der Nordsee vergleichbar sind. Die erhobenen Daten zeigen, dass die Migration von flachem Gas einen unbeachteten, aber potenziell bedeutsamen Methaneintrag in die Nordsee darstellt.
sich Kapitel III mit der Nordseeweiten Quantifizierung der Bohrloch-induziereten CH4- Emissionen. Die Quantifizierung basiert auf der Extrapolation der gemessenen Gasflüsse an den drei undichten Bohrlöchern, die in Kapitel II untersucht wurden, und der seismischen Kartierung von flachen Gasvorkommen, die mit dem Verlauf von 55 Bohrpfaden in einem repräsentativen Bereich der zentralen Nordsee korreliert werden. Die Korrelation deutet darauf hin, dass ein Drittel der Bohrlöcher durch flaches Gas gebohrt wurden und folglich potentielle Wegsamkeiten für die Migration des flachen Gases bilden. Der sich aus dieser Art der Leckage ergebende Methaneintrag in die gesamten Nordsee ist fast 10-mal größer als die anderen bekannten Methanquellen (Flüsse, Wattenmeer, und natürliche Seeps) und könnte somit erheblich zu den 20-fach größeren Methansenken, der Export in den Nordatlantik und die Entgasung in die Atmosphäre, beitragen. Zusammen mit den anthropogenen Emissionen des Gas-Blowouts (22/4b) kann der berechnete Methaneintrag das CH4 Budget der Nordsee weitestgehend schließen.
Die erhobenen Daten aus Kapitel II und III lassen vermuten, dass die Migration von flachem Gas entlang von Bohrlöchern ein in der Nordsee weit verbreitetes Phänomen ist.
Diese Beobachtung liefert wichtige Implikationen für die geologische Speicherung von CO2 (kurz CCS), weil sie impliziert, dass das verpresste CO2 möglicherweise entlang eines jeden Bohrlochs (Produktion, Exploration, oder stillgelegt) und ungeachtet dessen Integrität aus der Speicherstätte austreten kann, so lange dieses das unterirdische CO2-Vorkommen durchdringt.
Folglich befasst sich Kapitel IV mit dem CO2 Speicherungsprojekt „Sleipner“, das in der zentralen Nordsee operiert, und es untersucht das hypothetische, aber realistische Austreten von CO2 entlang eines Bohrlochs, welches die unterirdische CO2-Ansammlung durchdringt und in die ~ 80 m tiefe Wassersäule leckt. Die Arbeit beruht auf experimentellen und numerischen Daten, die im Hinblick auf die potentiellen Umweltauswirkungen und die Detektierbarkeit einens undichten Bohrlochs bei Sleipner interpretiert werden. Die experimentellen und numerischen Ergebnisse beweisen, dass die Detektierbarkeit und die Umweltauswirkungen einer solchen Leckage mit geringen Gasflüssen (< 55 t CO2 yr-1) auf einen kleinen Bereich (einige zehner- bis einhundert Meter) um das Leck herum begrenzt sein werden. Diese räumliche Beeinflussung ist in einem regionalen Kontext der Nordsee nicht relevant. Die Ausbreitung von Wassermassen mit einem CO2-induzierten, niedrigen pH Wert wird durch die Nordseeweiten starken Strömungen und Gezeiten reduziert, indem diese die erhöhten CO2 Werte effizient mit Hintergrundkonzentrationen mischen. Die Folgen eines einzigen undichten Bohrlochs werden daher als unbedeutend im Hinblick auf die CO2 Speicher-Performance, Umweltauswirkungen und den Klima Schutz eingeschätzt.
|V
Implementation von CCS in einem Ausmaß, das einen erheblichen Einfluss auf die globalen CO2 Emissionen hätte, könnte die Leckage von Gas entlang von Bohrlöchern ein weit verbreitetes Phänomen werden, das zu den prospektiven, anthropogenen Emissionen der Kohlenstoffbasierten Treibhausgase (CH4 und zukünftig CO2) beiträgt, vor allem an Land, wo die Gasaustritte direkt in die Atmosphäre gelangen. Diese Dissertation betont, dass das Druck-basierte Testen der Bohrloch-Integrität unzureichend ist um Gasaustritte (CH4 und CO2) entlang von Kohlenwasserstoffbohrungen zu identifizieren und quantifizieren.
Eine optimierte Überwachung und Anpassung entsprechender Regelwerke (national und international) sind daher unerlässlich.
| VII
Chapter I: IntroduCtIon
I.1 Anthropogenic greenhouse gas emissions into the atmosphere I.1.1 The carbon-based greenhouse gases CO2 and CH4
I.1.2 The ocean’s role in anthropogenic greenhouse gas emissions I.2 Anthropogenic CH4 emissions from hydrocarbon wells
I.2.1 Shallow gas leakage along the outside of wells
I.2.2 Geochemical tools to distinguish between reservoir and shallow gas leakage I.3 Carbon Capture and Storage
I.4 The North Sea
I.4.1 Bathymetry and hydrology I.4.2 Geological setting and CH4 sources I.4.3 Shallow gas accumulations
I.4.4 Well inventory and integrity I.4.5 The Sleipner CO2 storage project References
Chapter II: quantIfICatIonofmethaneemIssIonsfromabandonedwellsInthenorthsea
Abstract
II.1 Introduction
II.1.1 Study area II.2 Methodology
II.2.1 Sediment and gas sampling
II.2.2 Video based quantification of gas emissions II.2.2.1 Gas flow measurements
II.2.2.2 Bubble size spectra II.2.3 Gas bubble dissolution model II.3 Results
II.3.1 Gas composition and isotopic signatures II.3.2 Leakage site characteristics
II.3.3 Seabed methane emissions II.3.4 Bubble size measurements
II.3.5 Contribution to atmospheric methane via direct bubble transport II.4 Discussion
II.4.1 Gas origin
II.4.2 The nature of gas migration along an abandoned well II.4.3 Geological control of leakage
II.4.4 Methane emissions in a North Sea context II.4.5 Methane contribution to the atmosphere II.5 Conclusions
Acknowledgements References
abstraCt Kurzfassung
tableofContents
I III VII 1 1 1 3 5 6 8 8 10 10 10 12 13 13 14 21 22 24 25 25 26 26 27 28 31 31 32 32 34 35 36 36 37 39 40 41 42 42 43
VIII
Chapter III: leaKywellsanunConsIderedsourCeforbIogenICmethaneInthenorth sea
Introductory Paragraph III.1 Letter
III.2 Methods summary Acknowledgements References
Chapter IV: footprIntandenVIronmentalImpaCtofawellleaKIng Co2Intothenorth sea
Abstract
IV.1 Introduction
IV.2 Methodology
IV.2.1 The Gas Release Experiment
IV.2.1.1 Monitoring the gas discharge in the water column IV.2.1.2 Measuring the initial bubble size distribution IV.2.1.3 Measuring local hydrodynamics
IV.2.1.4 Evaluation of field data IV.2.2 Modelling CO2 leakage
IV.2.2.1 Bubble dissolution
IV.2.2.2 Advection-dispersion of dissolved CO2 IV.2.2.3 pCO2 and pH calculation
IV.2.3 Input data and simulation settings
IV.2.3.1 Simulating the Gas Release Experiment IV.2.3.2 Simulating CO2 leakage from a well IV.3 Results and Discussion
IV.3.1 The Gas Release Experiment IV.3.2 The leaky well sceanrios
IV.3.2.1 CO2 plume dispersion and relationship with tides
IV.3.2.2 Environmental impact of a well leaking CO2 into the CNS IV.3.2.3 Detectability and monitoring af a leaky well
IV.3.2.4 Propensity of wells to leak at Sleipner IV.4 Conclusions
Acknowledgements References
Chapter V: synthesIs
References
Chapter VI: supplementarymaterIal
Appendix A: Additional work I contributed to during the period of my PhD Appendix B: Supplementary Material to Chapter II
Appendix C: Supplementary Material to Chapter III Appendix D: Supplementary Material to Chapter IV CurrICulum VItae
50 52 57 58 58
61
62 63 64 65 66 67 67 68 68 70 73 73 73 76 76 76 79 80 82 84 85 87 87 88 93 95 97 97 99 101 123 139
Figure I.1: A) Atmospheric concentrations of the carbon-based greenhouse gases, carbon dioxide (CO2) and methane (CH4), and nitrous oxide (N2O) over the past 2,000 years (IPCC, 2007). B) Globally averaged atmospheric methane concentrations over the past three decades showing a quick rise before 1992, stagnant concentrations between 1999 and 2006, and the renewed increase of methane in the atmosphere since 2007 (modified after Nisbeth et al., 2014).
I. General Introduction
I.1 Anthropogenic greenhouse gas emissions into the atmosphere I.1.1 The carbon-based greenhouse gases CO2 and CH4
Anthropogenic greenhouse gas (GHG) emissions have been in the focus of scientific research in the last decades because rapidly increasing atmospheric GHG concentrations are suspected to induce global climate warming (Cook et al., 2013; Crowley, 2000), which is one of the major challenges for the global community in the next decades to centuries (Cias et al., 2013). GHGs strongly influence the radiative properties of the atmosphere, as they increase the capacity to adsorb long-wave radiation emitted from the earth surface. The carbon-based GHGs, that are carbon dioxide (CO2) and methane (CH4), are the two most abundant and important GHGs in the atmosphere, making up roughly 0.04 and 0.00018% (or 400 ppm and 1.85 ppm) of the total amount of atmospheric gases, respectively (see esrl.noaa.
gov). Aside differences in their abundance, the carbon-based GHGs differ in their warming potential and atmospheric life-times: on short time scales CH4 has an at least 20-fold higher warming potential as compared to the same amount of CO2. However, CH4 has an atmospheric life-time of only about 7 years whereas CO2 persists in the atmosphere over a much longer period of time.
Since pre-industrial times (defined as 1750), atmospheric concentrations of carbon-based GHGs have increased incessantly by 40% for CO2 and 150% for CH4 (Fig. I.1), now reaching values that exceed those reconstructed from ice core records dating back 800,000 years (Cias et al., 2013; IPCC, 2014). This rapid increase is decidedly attributed to anthropogenic sources
| 2
with industrial CO2 emissions accounting for about 78% of the total GHG emissions increase during the last 40 years (IPCC, 2014). Moreover, around two-thirds of the total CH4 emissions are caused by human-actions (Nisbet et al., 2014; Cias et al., 2013 based on top-down estimates). The human-induced change in the atmospheric composition, with which major tropospheric, terrestrial, and oceanic sinks cannot compete with, primarily results from emissions associated with energy use (primarily contributing to atmospheric CO2) and urbanization and land use changes (e.g. deforestation for CO2 and agriculture for CH4) (Karl and Trenberth, 2003).
The burning of fossil fuels (coal, oil, gas) is the primary source for the growth in atmospheric CO2, also slightly contributing to other atmospheric GHGs, i.e. CH4 and nitrous oxide (N2O). Energy-related emissions other than fossil fuel combustion significantly contribute to the acceleration of “old or fossil” CH4 (14C-free) in the atmosphere, primarily due to the fugitive loss of natural gas (containing ~90% of CH4) from hydrocarbon equipment leaks, gas venting and flaring, fossil fuel treatment and transportation. Based on the Emission Database for Global Atmospheric Research (EDGAR v.4.2) roughly 20% of the total anthropogenic CH4 sources are attributed to fugitive emissions from oil and gas production.
It should however be noted that, while some of these fugitive emission sources are intended (e.g. vent and flare systems), and therefore relatively well characterized, the quantity and composition of accidental or unintended emissions (e.g. equipment leaks during production and transportation) are subjected to significant uncertainty, as mentioned by the IPCC Guidelines for National Greenhouse Gas Inventories (2006).
Poor understanding of the quantity and composition of fugitive emissions is reflected by its debated role in controlling global atmospheric CH4 concentrations. Stagnant CH4 concentrations in the atmosphere between 1999 and 2006 and the renewed increase of CH4 in the atmosphere since 2007 (Fig. I.1b) have been linked to decreasing fugitive emissions from the hydrocarbon industry (Kirschke et al., 2013 and references therein) and to the subsequent intensification of shale gas and oil extraction by hydraulic fracturing in the United States (Nisbet et al., 2014; Kirschke et al. 2013), respectively. However, this inference is debated because atmospheric CH4 has become more depleted in 13C since 2007, an indication that growth is dominated by 12C-richer emissions from biogenic sources such as wetlands and ruminants (Nisbet et al., 2014 and references therein).
Considering that the human impact on the global climate system is already apparent by increasing global temperatures on land and in the oceans, partial melting of the Greenland and Antarctic ice sheets, ocean acidification, extreme weather events, and a global mean sea level rise of 19 cm during the last century, (IPCC, 2014) there is a strong need of human efforts to better understand GHG emissions so that appropriate mitigation strategies can be developed and implemented in order to control climate change.
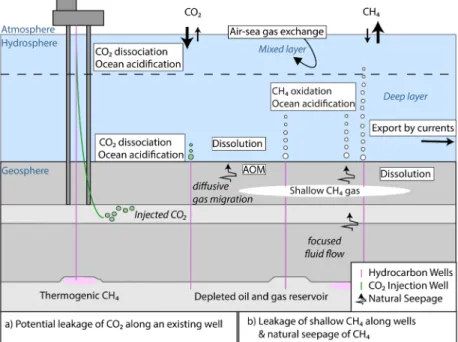
Figure I.2: Scheme illustrating anthropogenic and natural GHG emissions (CH4 and prospectively CO2) from the seabed into the Ocean (natural, hydrothermal venting of CO2 is not shown). Further processes controlling the fate of seeping (or leaking gases) during upward migration through the sediment, through the water column, and up towards the atmosphere are shown. Bold arrows illustrate that the ocean is a net source for atmospheric CH4 and a net sink for atmospheric CO2.
I.1.2 The ocean’s role in anthropogenic GHG emissions
The oceans play a key role in global warming because they constitute a net sink for atmospheric carbon, having absorbed ~30% of the anthropogenic CO2 emissions throughout the industrial era (IPCC, 2014). While this has a positive impact on the magnitude of global warming, increasing levels of dissolved inorganic carbon (DIC) in the oceans are changing the chemistry of seawater and making it more acidic, which poses risks for marine ecosystems. From a climate control point of view, there is concern that due to complex feedback mechanisms in the carbon-climate system, this oceanic uptake of atmospheric CO2 may substantially decline primarily as a consequence of the weakening of the ocean thermohaline circulation in the event of ongoing climate warming (Sarmiento and Le Quéré, 1996). This is supported by coupled climate models revealing that a weakening of the Atlantic Meridional Overturning Circulation (AMOC), is very likely to occur (IPCC, 2014 Chapter 3).This reduction would have a major impact on the future growth rate of atmospheric CO2 because the AMOC is associated with the production of about half of the global ocean’s deep waters in the northern North Atlantic and responsible for most of the meridional transport of heat and carbon (IPCC, 2014). Observations of changes in the AMOC are too short to provide evidence for any long-term trend, showing however interannual variability (IPCC, 2014 Chapter 3).
One idea to extent the oceanic sink in a manner that avoids ocean acidification is to capture CO2 from industrial sources and store it in marine sediments 1-3 kilometers below the
| 4
seafloor. However, there is concern that CO2 might escape from the storage reservoir and leak into the ocean posing risk for marine ecosystems or may be mixed back into the atmosphere causing climate damage. Studying the suitability of marine sediments to constitute an “extra”
oceanic sink for atmospheric CO2 is an important step in mitigating climate change.
Aside from the prospective implementation of submarine CCS at a scale that would have a significant impact on reducing anthropogenic CO2 emissions, substantial amounts of carbon (i.e. in the form of CH4) are already stored in marine sediments and submarine gas hydrates (i.e. >455 Gt of methane-bound carbon; Wallmann et al., 2012). These quantities of CH4 originate from mainly two distinctly different processes 1) the microbial (anaerobic) degradation of shallow, organic-rich sediments (termed biogenic CH4) or 2) the thermal breakdown of organic compounds in deeply buried sediments (termed thermogenic CH4).
Minor amounts of CH4 in the oceans are abiogenic in origin and are derived by inorganic processes operating deep within the Earth’s crust and underlying mantle (Kvenvolden, 2005).
Only a fraction of the sedimentary CH4 migrates upwards to the seafloor and reaches the water column. The microbial process of anaerobic oxidation of CH4 (AOM) constitutes the most efficient sink for seeping CH4, efficiently removing it from marine sediments before it reaches the sediment-water-interface (Hinrichs and Boetius, 2002 and references therein). Due to higher vertical advection velocities of migrating bubbles in marine sediments as compared to diffusive fluxes, rising CH4 bubbles can by-pass this microbial filter and directly transport CH4 into the water column, where gas bubbles are prone to dissolution during their ascent.
Here, dissolved CH4 is subjected to advective transport by ocean currents and oxidation by microbes where aerobic metabolism can be efficient under some circumstances (Steinle et al., 2015). Thus, depending on the gas ebullition type (i.e. diffusive or bubble flux) and the oceanic setting (i.e. water depth, stratification, and microbial oxidation potential) only a fraction of the seeping gas may reach the atmosphere, either via direct bubble transport or via the diffusive sea-air gas exchange which finally transports CH4 dissolved in the surface mixed layer to the atmosphere (Fig. I.2).
As a result, global oceanic CH4 fluxes are small, contributing roughly 2% to the global atmospheric CH4 emissions. While all of this oceanic CH4 contribution, meanwhile included in global GHG inventories (Cias et al., 2013), is currently attributed to natural seabed sources, that are mud volcanoes, natural seeps, and oceanic ridges, some must also result from leaking oil and gas wells.
Poor understanding of oceanic methane sources is due to the challenge for oceanic GHG emission studies to detect (all) sources at the seabed and attributing observed gas flares or CH4 concentrations in seawater to multiple potential seabed sources, both natural and anthropogenic. Attribution is complicated by the fact that anthropogenic emissions from leaky wells can look like natural gas seepage because many of the abandoned wells
Figure I.3: Scheme illustrating possible leakage pathways through (white arrows) and along (red arrow) an abandoned well: a) Between casing and cement; b) between cement plug and casing; c) through the cement pore space as a result of cement degradation; d) through casing as a result of corrosion; e) through fractures in cement; and f ) between cement and rock along the outside of the well (modified after Gasda et al., 2004).
“disappeared” with no evidence of their existence at the seafloor.
I.2 Anthropogenic CH4 emissions from hydrocarbon wells
As a result of extensive hydrocarbon exploration the world hosts several millions of wells (onshore and offshore), many believed to be leaking CH4 which is the primary fugitive component of fossil fuels and has a significant warming potential. Gas leakage from hydrocarbon wells can arise from two different mechanisms: (1) the failure of well material, (primarily) leading to uncontrolled gas migration from the reservoir or (2) the drilling- induced disturbance and fracturing of sediments around the wellbore, leading to unintended release of gas (from the deep reservoir or any other hydrocarbon accumulation in the shallower subsurface) along the outside of the well (Fig. I.3).
Present regulations only target leakage of produced fossil fuels and formation fluids from the reservoir, primarily due to human and environmental safety reasons (e.g. U.S. Mineral Management Service, Norwegian NORSOK). Therefore, the petroleum industry considers the potential failure of well material (e.g. damaged casing steel and poorly bonded or
| 6
degraded cement), typically identified by diagnostic testing of sustained casing pressure (SCP) (Brufatto, et al., 2003; Wojtanowicz, 2001; Davies et al., 2014). Available data on such well integrity issues is published by operating companies and governmental authorities and provides an uncertain estimate of 2-75% of all wells (onshore and offshore, Davies et al., 2014) being compromised and potentially at risk for leakage. The problem with this kind of pressure tests is that they lack information on the integrity of plugged and abandoned wells whose wellheads were cut off so that pressure tests cannot be conducted. In addition, SCP cannot detect shallow gas leakage through fractured and disturbed sediments in the surrounding of the well because it doesn’t influence the pressure in the well annulus. As such, shallow gas migration along the outside of wells and gas leakages through abandoned wells are badly quantified. Both leakage types currently represent missing emission sources in GHG inventories, particularly because data on emission factors (e.g. leakage rates) and activities (well counts), used in GHG inventories to calculate fugitive emissions, is not available (EPA, 2015).
Poorly identified and quantified leakages from the oil and gas industry likely result in an underestimation of fugitive CH4 emissions, particularly onshore where gas is directly emitted into the atmosphere. This is supported by growing evidence for increased CH4 emissions primarily in evolving unconventional gas production areas in the United States relative to national GHG inventories (Allen et al., 2013; Alvarez et al., 2012; Caulton et al., 2014;
Miller et al. 2013; Schneising et al., 2014; Zhang et al., 2014; Brandt et al., 2014; Kang et al., 2014). These emissions are generally attributed to leakage of the produced fossil fuel from the infrastructure and equipment during various operation steps (Allen et al., 2013) and after well abandonment (Kang et al., 2014), but some must also result from shallow, biogenic sources as indicated by 12C-richer isotopic signatures in the emanating CH4 (Kang et al., 2014).
I.2.1 Shallow gas leakage along the outside of wells
In this thesis shallow gas leakage is defined as the migration of CH4 along the outside of the well originating from a shallow gas accumulation in the upper 1,000 m of the sediment that the well has been drilled through. Although shallow gas migration is mentioned as a potential emission source (UNFCCC, 2009; IPCC, 2006), it is not considered in national and global GHG inventories, because the quantities of these unintended releases are difficult to predict.
Shallow gas migration along a well can either be driven by overpressure, buoyancy or a combination of both. Overpressure-driven leakage is usually related to drilling incidents where large amounts of shallow gas are suddenly released after drilling into an unnoticed, but highly pressurized gas pocket in the shallow subsurface. Such an incident occurred in 1990, when Mobile North LTD created a massive gas blowout in the Central UK North Sea
Figure I.4: Gas ebullition at the blowout well 22/4b in the British Sector of the North Sea after drilling into an unnoticed by highly pressurized shallow gas pocket in 1990 (Schneider von Deimling et al., 2015).
(57.922°N, 1.6325°E, WGS84) after drilling into an over-pressurized gas pocket about 360 m below the seafloor (Fig. I.4). The drilling site had to be abandoned after the incident and CH4 emissions (“leakage”) from the created seabed depression persisted over several decades (Rehder et al., 1998; Schneider von Deimling et al., 2007; Schneider von Deimling et al., 2015) representing the strongest gas seepage quantified to date (Leifer, 2015). Less persistent blowouts have been reported by the U.S. Mineral Management Service, where 39 blowouts occurred during drilling operations on the U.S. outer continental shelf in the period between 1992 and 2006 (Izon et al., 2007). The majority of these blowouts were due to shallow gas influx (Izon et al., 2007).
Smaller leaks can result from drilling through less-pressurized shallow gas pockets. In the absence of high overpressures, gas migration along a well can be best described by buoyancy- driven capillary invasion of drilling induced pathways where the gas has to exceed the capillary pressure to enter an initially water-saturated conduit (Clayton et al., 1994; Gurevich et al., 1993). Because drilling disturbs and fractures the sediment around a wellbore mechanically (Gurevich et al., 1993) it may create highly efficient pathways for the upward migration of gas drawing CH4 from the surrounding sediment because of lower capillary pressure in the fracture (Bethke et al., 1991; Judd and Hovland, 2007).
The buoyant release of shallow gas along the outside of hydrocarbon wells results in significantly lower gas emissions compared to the blowout case, and is likely not related to fatalities, injuries or economic losses. Nonetheless, considering the millions of wells drilled world-wide and the ubiquitous gas accumulations in the shallow subsurface, smaller leaks of CH4 are likely wide-spread potentially adding significant amounts of “extra” industry-related CH4 into the ocean and/or to the atmosphere. Therefore, it is important to understand and quantify this type of CH4 emission source so that appropriate mitigation (or compensation) strategies can be developed and implemented.
| 8
I.2.2 Geochemical tools to distinguish between reservoir and shallow gas leakage
As a result of different fractionation (kinetic isotope effects) and generation processes of biogenic and thermogenic methane, shallow gas leakage and reservoir leakage can often be distinguished by their isotopic signatures and molecular ratios, such as ∂13C of CH4,
∂D of CH4, and methane/(ethane+propane) (C1/(C2+C3)). Shallow gas leakage of biogenic methane is enriched in light 12C (-110‰<∂13C<-50‰ VPDB; Whiticar, 1999), depleted in D (-400‰<∂D<-150‰ SMOW), and contains only trace amounts of higher alkanes (C1/C2+>1,000). This is because methane producing organisms (methanogens) preferably use the light isotopes such as 12C and 1H for their metabolism and do not produce significant amounts of higher hydrocarbons. By contrast, leakage of thermogenic methane from the deep HC reservoir is depleted in 12C (-50‰<∂13C<-20‰ VPDB; Whiticar, 1999) and has a high abundance of higher alkanes, with values C1/(C2+C3)<100 (Wiese and Kvenvolden, 1993). With increasing maturity the C1/∑C2+ ratio decreases and the isotopic signature of the thermogenic gas gets progressively heavier because at the late stages methane is the dominant product over other hydrocarbon gases and the available organic matter is enriched in 13C due to earlier fractionation with preferential removal of 12C (i.e. the 13C-12C bonds are stronger than the12C-12C bonds).
It should be noted that potential gas sources for shallow gas leakage include both upward migrated thermogenic gas principally from deeper thermally mature source rocks and biogenic methane originating from geologically young, organic-rich sediments, or a mixture of both sources. As such, shallow gas leakage must not be restricted to biogenic gas signatures making a distinct geochemical characterization of shallow and reservoir leakage challenging in some places.
I.3 Carbon Capture and Storage
Carbon Capture and Storage (CCS) is considered as a key technology in reducing CO2 emissions into the atmosphere and thereby to slow down global warming. It aims at capturing the CO2 arising from the (energy-related) combustion of fossil fuels and other industrial processes, transporting it and storing it in deep geological formations. The IEA World Energy Outlook (2014) estimated that the global consumption of fossil fuels continues to increase, with energy-related CO2 emissions rising by 20% to 2040, which puts the world on a path consistent with a long-term global average temperature increase of 3.6°C. This would be far above the goal to stopping global warming at 2°C above preindustrial levels, a threshold value suggested to preventing dangerous/irreversible anthropogenic interference in the climate system (Cias et al., 2013). Therefore, significant CCS deployment at a global-scale (in addition to other mitigation options) is projected to be needed from 2020 to 2030 to achieving the 2-degree target (IEA, 2013).
CCS is a technically feasible method demonstrated by 55 CCS projects that have been established around the world by 2014 (Global CCS Institute, 2014). The capturing of CO2 can be applied by three main principles: 1) post-combustion, where CO2 is removed from waste-gas or natural gas combustion by wet scrubbing with aqueous amine solutions or 2) prior to combustion of coal and biomass by applying physical solvents to gasified fossil fuels, or (3) oxyfuel combustion of gas and coal using oxygen-enriched gas instead of air which results in final flue-gases that consists mainly of CO2 (Gibbins and Chalmers, 2008). After separation, the captured CO2 gas is typically cooled and compressed to a high density to facilitate both transport (if required via pipelines and/or ships) and storage (Metz et al., 2005). CO2 storage is realized via one or several injection wells that typically are made of corrosion-resistant well material (steel and cement) to withstand the highly corrosive force of dissolved CO2 in the formation water.
The storage of CO2 is possible in several geological formations, such as depleted hydrocarbon reservoirs, deep, un-minable coal seams, and notably in deep saline aquifers, both onshore and offshore (Metz et al., 2005). From a climate control point of view, offshore CCS has the benefit that in the event of leakage, atmospheric CO2 emissions would be reduced because the water column acts as a barrier for seeping gases from the seafloor.
Globally, the majority of gas storage projects are in depleted oil and gas reservoirs and saline formations (Metz et al., 2005). The former are promising for storing CO2 because these structures tend to be geologically well understood with existing wellbore and seismic data helping to characterize the local geology and overburden, demonstrated their integrity and safety by containing hydrocarbons for a very long time, and may already have infrastructures in place (Metz et al., 2005). One downside of storing CO2 in developed sites is the presence of pre-existing wells (Gasda et al., 2004; Nordbotten et al., 2005) which have been identified as posing a greater risk for gas leakage from CO2 storage formations than geological features, such as faults or fractures (Bachu and Watson, 2009).
Saline aquifers offer the highest potential capacity for CO2 globally because they are widespread in sedimentary basins throughout the world, both onshore and on the continental shelves (Michael et al., 2010; Metz et al., 2005). The three large-scale CCS projects Sleipner, SnØhvit and In Salah (all injecting CO2 from natural gas production) make use of this storage reservoir and various commercial projects are planned for the future (Michael et al., 2010).
In a saline aquifer the injected CO2 will end-up either as a separated phase beneath the top seal (as in Sleipner), a residual gas saturated in the pore space, dissolved in the formation brine, or precipitated in the mineral phase (Michael et al., 2010). Although these trapping mechanisms for CO2 are relatively well known, the rates and timing of the various process still have to be better constrained (Michael et al., 2010).
| 10
For every storage site, monitoring is required for purposes of managing, proving its integrity, and verifying the extent of CO2 emissions reduction which has been achieved (Metz et al., 2005). The suitability of CCS as a climate change mitigation option will particularly depend on the long-term (> 1,000 years) containment of CO2 in the reservoir.
I.4 The North Sea
I.4.1 Bathymetry and Hydrology
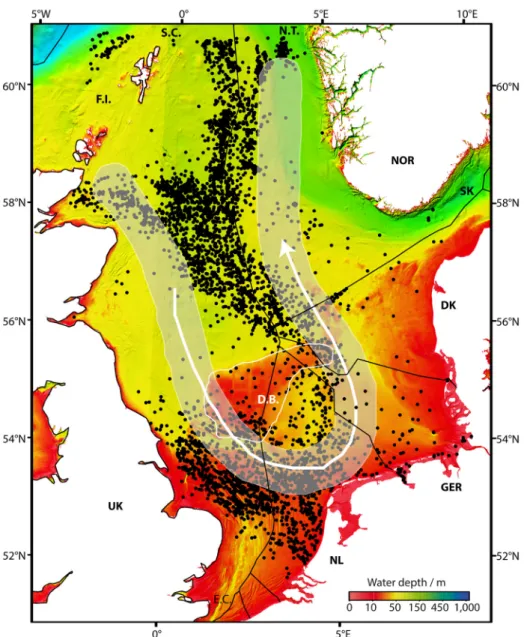
As part of the northwestern European continental shelf, the North Sea is a semi-enclosed shallow sea with an open northern and southern boundary to the North Atlantic Ocean, and an eastern connection to the Baltic Sea. The average water depth is 74 m, deepening from south to north (Otto et al., 1990). The Norwegian Channel (incl. the Skagerrak) along the east coast of Norway forms a prominent, deep intrusion in the shelf (Fig. I.5). Here, the water depth increases to 400 m in the Norwegian Channel and 750 m in the Skagerrak. In the southern region, the Dogger Bank forms a significant morphological high in the otherwise fairly flat bathymetry of the North Sea. The water depths south of the Dogger Bank are less than 50 m deep enabling continuous vertical mixing of water mases, whereas the deeper northern part is subjected to seasonal stratification (Thomas et al., 2005).
The hydrology of the North Sea is dominated by continuous water exchange across the northern opening to the North Atlantic Ocean (NAO) with minor inputs via the English Channel (Thomas et al., 2005 and references therein). As a consequence the main residual flow pattern is an anti-clockwise “u-shaped” circulation of North Atlantic Ocean water (Fig. I.5), entering the north-western boundaries of the North Sea via the Shetland Channel and Fair Island Channel, flowing along the Scottish/British coast to the Dutch, German, Danish, and Norwegian coast, and leaving along the Norwegian Trench, with residence times of less than one year (i.e. 0.75 years; Thomas et al., 2005 and references therein). Riverine input of freshwater and inflow of brackish water from the Baltic lead to local nutrient inputs, admixtures, and dilution of North Sea water masses. It should be noted that the hydrological characteristics described above are bulk patterns and the dispersion of a tracer (such as CH4 and CO2) may locally and temporally differ from this advection scheme.
I.4.2 Geological Setting and CH4 sources
In terms of petroleum geology the North Sea is a complex buried graben structure that experienced extensional tectonics and failed rifting during the latest Jurassic and earliest Cretaceous time as well as various subsequent post-rifting events (Gautier, 2005). The North Sea Graben Province, which can be subdivided into three sub-basins, that are the Viking Graben in the north, the Central Graben in the south, and the Moray Firth/Witch Ground near the British coast, is one of the world’s great petroleum provinces, ranked number 8
Figure I.5: Bathymetric map of the North Sea (EMODnet) showing the surface location of wells (black dots), and its hydrology (white arrow; after Thomas et al., 2005). The flow pattern of the North Sea is mainly dominated by inflow of North Atlantic Ocean water via the Faire Island Channel (F.I), minor inflow through the English Channel (E.C.), and outflow through the Norwegian Trench (N.T.). The arrow indicates the dominant anticlockwise circulation of North Atlantic Ocean water through the North Sea. The locationof the Dogger Bank (D.B.) is indicated (white rim).
among 76 world priority provinces in terms of volumes of discovered oil and gas (Gautier, 2005). The oil and gas accumulations found there occur in a variety of structural settings and within reservoir rocks of various ages (ranging from Devonian to Eocene), but almost all originates from marine, organic-rich shales (Kimmeridgian Shale) that were deposited during the period of intensive extension and rifting (Gautier, 2005). Aside from dominant Kimmeridgian Shales, pre-rifting Carboniferous coal deposits are economically important
| 12
source rocks for natural gas in the Southern North Sea (Gautier, 2005). After subsidence and continuous burial of Carboniferous coal measures and the Kimmeridgian Shale in most of the North Sea Graben Province, oil and gas generation began locally by Cretaceous time and has continued in various places ever since (Gautier, 2005). In addition to thermogenic sources, biogenic CH4 originates from geologically young, organic-rich sediments, such as Quaternary peats and Lower-Middle Pleistocene delta sediments (primarily in the southern North Sea), and Tertiary lignites (Judd et al., 1997).
Vertical migration of hydrocarbons in the North Sea is often associated with tectonic stresses, salt doming, and depressurization of gas-holding sediments (after glaciation periods). While some of these natural conduits (i.e. faults, fractures, and gas chimneys) connect source rocks with suitable structural traps and reservoir rocks, others may reach the seafloor, leading to the natural losses of hydrocarbons (mainly gas) from the seafloor at some places. Drilling incidents and hydrocarbon wells, constituting additional man-made conduits for the upward migration of gas, (potentially) lead to additional, unintended releases of sedimentary CH4 into the North Sea.
Various gas flares and pockmarks, as well as CH4 supersaturations in the surface seawater of the open North Sea (with respect to atmospheric levels) have been reported in the scientific literature (Bange et al., 1994; Rehder et al.,1998; Schneider von Deimling et al., 2007; Judd and Hovland, 2007; Judd et al., 1997; Schroot et al., 2005), and originate from various potential seabed sources (natural and anthropogenic), which are however badly identified and quantified.
I.4.3 Shallow gas accumulations
In the North Sea, shallow gas accumulations are apparently abundant in unconsolidated sediments of Miocene-Holocene age (Schroot et al., 2005; Laier et al., 1990). Potential gas sources include upward migrated thermogenic gas principally from deeper thermally mature source rocks (i.e. Kimmerige Clay and Coal Measures) and biogenic methane originating from geologically young, organic-rich sediments, such as Quaternary peats and Lower-Middle Pleistocene delta sediments (primarily in the southern NS), and Tertiary lignites (Judd et al., 1997). Clay-rich sediments known as Nordland Shales (Horvig, 1982) largely act as a seal for upward migrating fluids, except for sections with pre-existing or pressure-induced fractures.
Shallow gas accumulations have been identified in industrial and scientific seismic data by tracking seismic anomalies that are indicative for the presence of gas, such as seismic turbidity (i.e. chaotic seismic reflections) and bright spots (i.e. reverse polarity high amplitude anomalies). While the former is indicative for the rather unfocused distribution of gas (<1%
gas in pore space), the latter indicates the presence of free gas accumulations in the pore
space. Some of the identified gas accumulations are large enough (bright spots with diameters up to 10 km; Schroot et al., 2005) to be of commercial interest, but many others are smaller or have not yet been explored.
I.4.4 Well inventory and integrity
As a result of extensive hydrocarbon exploration since 1964, the North Sea hosts 15,781 wells (including sidetracked and multilateral wells, Fig. I.5). While most of these wells are inactive today and have been abandoned, around 4,447 are currently used for oil and gas production, and injection of formation waters or CO2 (see Supp. Tab. III.3). Based on reported data on well integrity issues on the British and Norwegian Continental Shelf, 10 to 18% of the active wells (Davies et al., 2014 and references therein) and up to 38% of the temporarily abandoned wells (which still have their wellhead in place; Vignes, 2011) are being compromised and potentially at risk to leak.
I.4.5 The Sleipner CO2 storage project
The Statoil operated CO2 storage project “Sleipner” is located in the Norwegian Sector of the Central North Sea and is the world’s first large-scale CCS project with an annual injection rate of ~1 Mt of CO2 since 1996 (Fig. I.6). To meet the specifications of maximum 2.5%
by volume of CO2 in the sale gas, CO2 is stripped from natural gas production containing 4-9.5% of CO2 using a conventional amine process (KorbØl and Kaddour, 1995). The CO2 tax, introduced in 1991 by the Norwegian authorities, was one of the triggers for Statoil to store the separated CO2 underground by injection into a saline aquifer in ~700-1,000 m sediment depth, overlying the natural gas reservoir. CO2 injection is realized by a single well, consisting of a high quality stainless steel tubing to prevent corrosion (Eiken et al., 2011).
The injection point is located 1,012 m below sea level, some 200 m below the top of the storage reservoir (Chadwick et al., 2009; Arts et al., 2008), so that the injected CO2 is in a supercritical phase.
The Utsira storage Formation (Fm.) is a highly elongated sand reservoir extending for more than 400 km from north to south and between 50-100 km from east to west (Torp and Gale, 2004), and has a thickness of about 250 m in the vicinity of the injection site (Arts et al., 2008). The sandstone formation is of Tertiary age and consists of mainly un-cemented fine grained, highly porous (35-40%; Torp and Gale, 2004), very permeable (1-3 Darcy; Arts et al., 2008), homogenous sand deposited on a shallow marine shelf (KorbØl and Kaddour, 1995). The Utsira Fm. is overlain by the ~800 m thick Nordland Fm., which lower 200-300 m consists of shale forming the main reservoir cap rock. Coarser sediments, such as silts and sand dominate the shallower parts of the Nordland Fm.
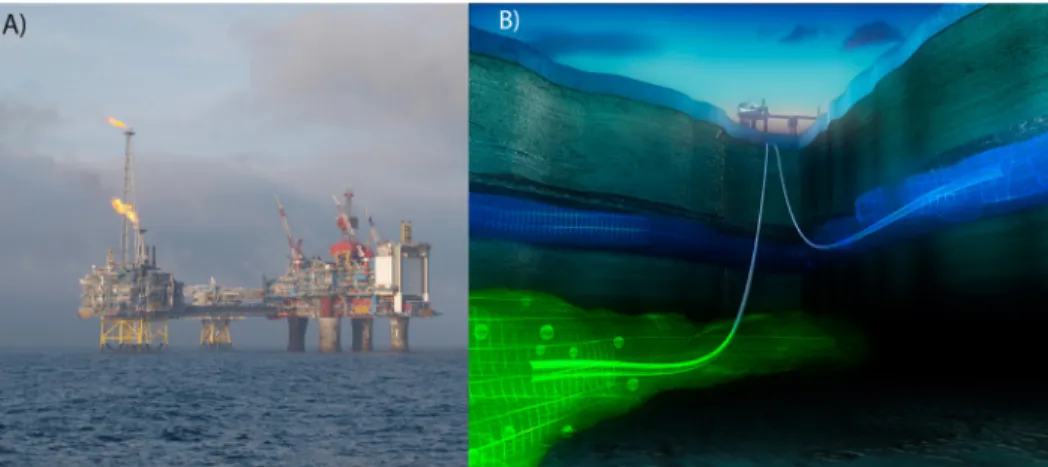
Figure I.6: A) Sleipner A Platform from which CO2 is being injected into the Utsira storage formation (Picture: Jens Karstens). B) CO2 is injected into a saline aquifer (blue) in ~900 m sediment depth overlying the deep hydrocarbon reservoir (green) (Picture: Statoil).
| 14
For the purpose of monitoring, Statoil uses a number of monitoring techniques, namely temperature and pressure monitoring at the injection wellhead (bottom hole pressure is not measured; Eiken et al., 2011), and repeated seismic and gravity surveys. A set of seven repeat 3-D seismic surveys, in 1994, 1999, 2001, 2002, 2004, 2006, and 2008, (Eiken et al., 2011;
Chadwick et al., 2009) has shown that the buoyant CO2 migrates upward from the injection point and accumulates under the overlying cap rock (Torp and Gale, 2004). Here, the CO2 migration has a prominent north-ward trend and follows a linear topographic ridge at the top reservoir (Chadwick et al., 2009). Furthermore, three time-lapse seafloor gravity surveys have been carried out, in 2002, 2005 and 2009, namely to estimate the amount of CO2 absorbed in the formation water, which is currently not feasible by seismic data (Eiken et al., 2011).
In addition, the seafloor has been mapped with multibeam echo sounding, side-scan sonar, and ROV video footage. However, no seafloor changes (pockmarks, bubbles; Eiken et al., 2011) or systematic changes in the overburden (Chadwick et al., 2009) have been observed indicating that CO2 is being contained within the storage reservoir at Sleipner.
References:
Allen, D.T., et al., 2013. Measurements of methane emissions at natural gas production sites in the United States. Proc. Natl. Acad. Sci. U.S.A. 110, 17768-17773.
Alvarez, R.A., Pacala, S.W., Winebrake, J.J., Chameides, W.L., Hamburg, S.P., 2012. Greater focus needed on methane leakage from natural gas infrastructure. Proc. Natl. Acad. Sci. U.S.A.
109, 6435-6440.
Arts, R.J., Chadwick, R.A., Eiken, O., Thibeau, S., Nooner, S., 2008. Ten years‘ experience of monitoring CO2 injection in the Utsira Sand at Sleipner, offshore Norway. EAGE Special
15
Topic 26, 56-72.
Bachu, S., and Watson, T.L., 2009. Review of failures for wells used for CO2 and acid gas injection in Alberta, Canada. Energy Procedia 1, 3531-3537. doi:10.1016/j.
egypro.2009.02.146.
Bange, H.W., Bartell, U.H., Rapsomanikis, S., Andreae, M.O., 1994. Methane in the Baltic and North Seas and a reassessment of the marine emissions of methane. Glob. Biogeochem.
Cycles 8, 465–480.
Brufatto, C., et al., 2003. From mud to cement - Building gas wells. Oilfield Rev. 15, 62-76.
Behtke, C. M., Reed, J.D., Olzt, D.F., 1991. Long –range petroleum migration in the Illinois Basin. American Association of Petroleum Geologists (Bulletin) 75, 925-45.
Brandt et al., 2014. Methane Leaks from North American Natural Gas Systems. Science 343, 733-735.
Caulton, D.R., et al. , 2014. Toward a better understanding and quantification of methane emissions from shale gas development. Proc. Natl. Acad. Sci. U.S.A. 111, 6237-6242.
Chadwick, R.A., Noy, D., Arts, R.J., Eiken, O., 2009. Latest time-lapse seismic data from Sleipner yield new insights into CO2 plume development. Energy Procedia 1, 2103–2110.
doi:10.1016/j.egypro.2009.01.274.
Ciais, P., et al., 2013. Climate Change 2013: The Physical Science Basis. Contribution of Working Group I to the Fifth Assessment Report of the Intergovernmental Panel on Climate Change, in: Stocker, T.F., Qin, D., Plattner, G.-K., Tignor, M., Allen, S.K., Boschung, J., Nauels, A., Xia, Y., Bex, V., Midgley, P.M. (Eds.). IPCC, Cambridge, UK, pp. 465-570.
Clayton, C.J., Hay, J., 1994. Gas migration mechanisms from accumulation to surface. Bull.
Geol. Soc. Den. 41, 12-23.
Cook, J., et al., 2013. Quantifying the consensus on anthropogenic global warming in the scientific literature. Environ. Res. Lett. 8 (2), 024024. doi:10.1088/1748-9326/8/2/024024.
Crowley, T.J., 2000. Causes of Climate Change Over the Past 1000 Years. Science 289, 270–
277. doi:10.1126/science.289.5477.270.
EDGAR v.4.2. CH4 FT2010. http://edgar.jrc.ec.europa.eu/overview.php?v=42FT2010.
Eiken, O., et al., 2011. Lessons Learned from 14 years of CCS Operations: Sleipner, In Salah and SnØhvit. Energy Procedia 4, 5541-5548.
EPA, 2015. Inventory of U.S. Greenhouse Gas Emissions and Sinks: 1990-2013. Chapter 3 Energy. http://www3.epa.gov/climatechange/Downloads/ghgemissions/US-GHG- Inventory-2015-Chapter-3-Energy.pdf.
| 16
Gasda S, Bachu S, Celia M., 2004. The potential for CO2 leakage from storage sites in geological media: analysis of well distribution in mature sedimentary basins. Environ. Geol.
46 (67), 707–20.
Gautier L., 2005. Kimmeridgian Shales Total Petroleum System of the North Sea Graben Province: U.S. Geol. Surv. Bull. 2204-C, 24 p.
Gibbins, J., Chalmers, H., 2008. Carbon capture and storage. Energy Policy 36, 4317–4322.
doi:10.1016/j.enpol.2008.09.058.
Global CCS Institute, 2014. The Global Status of CCS: 2014, Melbourne, Australia. 199 pp.
Gurevich, A.E., Endres, B.L., Robertson Jr, J.O., Chilingar, G.V., 1993. Gas migration from oil and gas fields and associated hazards. J. Petr. Sci. Eng. 9, 233-238.
Hinrichs, K.-U. and Boetius, A., 2002. The anaerobic oxidation of methane: New insights in microbial ecology and biogeochemistry In: Wever, G., Billett, D., Hebbeln, D., Jørgensen, B.
B., Schlüter, M., and van Weering, T. C. E. Eds., Ocean Margin Systems. Springer-Verlag, Heidelberg.
Horvig, S., 1982. WDSS 40 01 16 7 2: Geological Completion Report Well 16/7-2. Esso Exploration and production Norway Inc.
IEA, 2013. Annual Report 2013. OECD Publishing. https://www.iea.org/publications/
freepublications/publication/2013_AnnualReport.pdf.
IEA, 2014. World Energy Outlook 2014, Executive Summary. OECD Publishing. http://
www.iea.org/textbase/npsum/weo2014sum.pdf.
IPCC, 2006. IPCC Guidelines for National Greenhouse Gas Inventories. Chapter 4 Fugitive Emissions.
IPCC, 2007. Changes in Atmospheric Constituents and in Radiative Forcing. In: Climate Change 2007: The Physical Science Basis. Contribution of Working Group I to the Fourth Assessment Report of the Intergovernmental Panel on Climate Change [Solomon, S., D.
Qin, M. Manning, Z. Chen, M. Marquis, K.B. Averyt, M.Tignor and H.L. Miller (eds.)].
Cambridge University Press, Cambridge, United Kingdom and New York, NY, USA.
IPCC, 2014. Climate Change 2014: Synthesis Report. Contribution of Working Groups I, II and III to the Fifth Assessment Report of the Intergovernmental Panel on Climate Change [Core Writing Team, R.K. Pachauri and L.A. Meyer (eds.)]. IPCC, Geneva, Switzerland, 151 pp.
Izon, D., Danenberger, E.P., Mayes, M., 2007. Absence of fatalities in blowouts encouraging in MMS study of OCS incidents 1992-2006. Drilling Contractor.
Judd, A., Hovland, M., 2007. Seabed fluid flow: the impact on geology, biology and the marine environment. Cambridge University Press, Cambridge. doi:10.1017/cbo9780511535918.
Judd, A., et al., 1997. Contributions to atmospheric methane by natural seepage on the U.K.
continental shelf. Mar. Geol. 140, 427-455.
Kang et al., 2014. Direct measurements of methane emissions from abandoned oil and gas wells in Pennsylvania. Proc. Natl. Acad. Sci. U.S.A. 111, 18173–18177.
Karl, T.R., Trenberth, K.E., 2003. Modern Global Climate Change. Science 302, 1719-1723.
Kirschke et al, 2013. Three decades of global methane sources and sinks. Nat. Geosci. 6, 813–823, doi: 10.1038/NGEO1955.
Korbøl, R., Kaddour, A., 1995. Sleipner vest CO2 disposal-injection of removed CO2 into the Utsira Formation. Energy Conv. Manag. 36, 509–512.
Kvenvolden, K.A., Rogers, B.W., 2005. Gaia‘s breath—global methane exhalations. Mar.
Petrol. Geol. 22, 579–590. doi:10.1016/j.marpetgeo.2004.08.004.
Laier, T., JØrgensen, N.O., Buchardt, B., Cederberg, T., Kuijpers, A., 1992. Accumulation and seepages of biogenic gas in Northern Denmark. Cont. Shelf Res. 12 (10), 1173-1186.
Leifer, I., 2015. Seabed bubble flux estimation by calibrated video survey for a large blowout seep in the North Sea. Mar. Petrol. Geol. 68, Part B, 743–752.
Metz, B., Davidson, O., De Coninck, H.C., Loos, M., 2005. IPCC special report on carbon dioxide capture and storage. Prepared by Working Group III of the Intergovernmental Panel on Climate Change. IPCC.
Michael, K., Golab, A., Shulakova, V., Ennis-King, J., Allinson, G., Sharma, S., Aiken, T., 2010. Geological storage of CO2 in saline aquifers: A review of the experience from existing storage operations. Int. J. Greenh. Gas Control 4, 659–667. doi:10.1016/j.ijggc.2009.12.011.
Miller, S.M., et al., 2013. Anthropogenic emissions of methane in the United States. Proc.
Natl. Acad. Sci. U.S.A. 110, 20018-20022.
Nisbet, E.G., Dlugokencky, E.J., Bousquet, P., 2014. Methane on the Rise-Again. Science 343, 493-495.
Nordbotten, J.M., Celia, M.A., Bachu, S., Dahle, H.K., 2005. Semianalytical Solution for CO2 Leakage through an Abandoned Well. Environ. Sci. Technol. 39, 602-611.
NORSOK Standard D-010, 2004. http://www.standard.no/PageFiles/1315/D-010r3.pdf.
Otto, L., Zimmerman, J.T.F., Furnes, G.K. Mork, M., Seatre, R., Becker, G., 1990. Review of the phydical oceanography of the North Sea. Neth. J. Sea Res. 26 (2-4), 161-238.
| 18
Rehder, G., Keir, R.S., Suess, E., Pohlmann, T., 1998. The multiple sources and patterns of methane in North Sea waters. Aquat. Geochem. 4, 403-427.
Sarmiento, J.L., Le Quéré, C., 1996. Oceanic Carbon Dioxide Uptake in a Model of Century-Scale Global Warming. Science 274, 1346-1350.
Schneider von Deimling, J.,Brockhoff, J., Greinert, J., 2007. Flare imaging with multibeam systems: data processing for bubble detection seeps. Geochem. Geophys. Geosys. 8.
Schneider von Deimling, J., Linke, P., Schmidt, M., Rehder. G., 2015. Ongoing methane discharge at well site 22/4b (North Sea) and discovery of a spiral vortex bubble plume motion.
Mar. Petr. Geol. 68, Part B, 718–730.
Schneising, O., et al., 2014. Remote sensing of fugitive methane emissions from oil and gas production in North American tight geologic formations. Earth's Future 2, 548-558.
Schroot, B.M., Klaver, G.T., Schüttenhelm, R.T.E., 2005. Surface and subsurface expressions of gas seepage to the seabed- examples from the Southern North Sea. Mar. Petrol. Geol. 22, 499-515.
Steinle et al., 2015. Water column methanotrophy controlled by a rapid oceanographic switch. Nat. Geosci. 8, 378–382.
Thomas, H., et al., 2005. The carbon budget of the North Sea. Biogeosciences 2, 87-96.
Torp, T.A., Gale, J., 2004. Demonstrating storage of CO2 in geological reservoirs: The Sleipner and SACS projects. Energy 29, 1361-1369.
UNFCCC, 2009. UNFCCC Resource Guide: For preparing the national communications of non-annex I parties. Module 3 National Greenhouse Gas Inventories.
Vignes, B., 2011. Contribution to Well Integrity and Increased Focus on Well Barriers from a Life Cycle Aspect (PhD thesis). University of Stavanger.
Wallmann et al., 2012. The Global Inventory of Methane Hydrate in Marine Sediments: A Theoretical Approach. Energies 5, 2449-2498.
Whiticar, M.J., 1999. Carbon and hydrogen isotope systematics of bacterial formation and oxidation of methane. Chem. Geol. 161, 291-314.
Wiese, K., Kvenvolden, K.A., 1993. Introduction to Microbial and Thermal Methane. The Future Of Energy Gases. U.S. Geol. Surv. Prof. Paper 1570.
Wojtanowicz, A.K., Nishikiwa, S., Rong, X., 2001. Diagnostic and remediation of sustained casing pressure in wells. Mineral. Manag. Serv.
Zhang, Y., Zhao, H., Zhai, W., Zang, K., Wang, J., 2014. Enhanced methane emissions from oil and gas exploration areas to the atmosphere – The central Bohai Sea. Mar. Pollut. Bull. 81, 157-165.