Three years of trace gas observations over the EuroSiberian domain derived from aircraft sampling —
a concerted action
By I. LEVIN1*, P. CIAIS2, R. LANGENFELDS3, M. SCHMIDT1, M. RAMONET2, K. SIDOROV4, N. TCHEBAKOVA5, M. GLOOR6, M. HEIMANN6, E.-D. SCHULZE6, N. N. VYGODSKAYA4, O. SHIBISTOVA5and J. LLOYD6, 1Institut fu¨r Umweltphysik, Universita¨t Heidelberg (UHEI-IUP), Im Neuenheimer Feld 229, 69120 Heidelberg, Germany; 2L aboratoire des Sciences du Climat et de l’Environnement (L SCE), CE Saclay, Orme des Merisiers, Baˆt. 709, 91191 Gif-sur-Y vette Cedex, France;
3CSIRO Atmospheric Research (CAR), Private Bag 1, Aspendale, V ictoria 3195, Australia; 4Svertsov Institute for Evolutionary and Ecological Problems (IPEE), L eninskii pr. 33, 117071 Moscow, Russia;
5Institute of Forest, Siberian Branch, Russian Academy of Sciences (IF SB RAS), Akademgorodok, 660036 Krasnoyarsk, Russia;6Max-Planck-Institut fu¨r Biogeochemie (MPI-BGC), Postfach 100 164, 07701 Jena,
Germany
(Manuscript received 2 July 2001; in final form 22 April 2002)
ABSTRACT A three-year trace gas climatology of CO
2and its stable isotopic ratios, as well as CH 4, N
2O and SF
6, derived from regular vertical aircraft sampling over the Eurasian continent is presented.
The four sampling sites range from about 1°E to 89°E in the latitude belt from 48°N to 62°N.
The most prominent features of the CO2observations are an increase of the seasonal cycle amplitudes of CO2andd13C–CO2in the free troposphere (at 3000 m a.s.l.) by more than 60%
from Western Europe to Western and Central Siberia.d18O–CO2shows an even larger increase of the seasonal cycle amplitude by a factor of two from Western Europe towards the Ural mountains, which decreases again towards the most eastern site, Zotino. These data reflect a strong influence of carbon exchange fluxes with the continental biosphere. In particular, during autumn and winterd18O–CO2shows a decrease by more than 0.5‰ from Orle´ans (Western Europe) to Syktyvkar (Ural mountains) and Zotino (West Siberia), mainly caused by soil respiration fluxes depleted ind18O with respect to atmospheric CO2. CH
4mixing ratios in the free troposphere at 3000 m over Western Siberia are higher by about 20–30 ppb if compared to Western Europe. Wetland emissions seem to be particularly visible in July–September, with largest signals at Zotino in 1998. Annual mean CH4mixing ratios decrease slightly from 1998 to 1999 at all Russian sites. In contrast to CO
2 and CH
4, which show significant vertical gradients between 2000 and 3000 m a.s.l., N
2O mixing ratios are vertically very homogeneous and show no significant logitudinal gradient between the Ural mountains and Western Siberia, indicating insignificant emissions of this trace gas from boreal forest ecosystems in Western Siberia. The growth rate of N2O (1.2–1.3 ppb yr−1) and the seasonal amplitude (0.5–1.1 ppb) are similar at both aircraft sites, Syktyvkar and Zotino. For SF
6an annual increase of 5% is observed, together with a small seasonal cycle which is in phase with the N
2O cycle, indicating that the seasonality of both trace gases are most probably caused by atmospheric transport processes with a possible contribution from stratosphere–troposphere exchange.
* Corresponding author.
e-mail: ingeborg.levin@iup.uni-heidelberg.de
1. Introduction bution over the extended land masses of European Russia and Siberia is still very limited. Up to date, only one systematic study of vertical aircraft pro- The inexorable rise of CO
2in the atmosphere
primarily reflects anthropogenic emissions from filing over the Eurasian continent extending from Moscow to Yakutsk was reported by Nakazawa fossil fuel and land use changes. The annual
average rate of atmospheric CO
2increase is, how- and co-workers (1997a). They made regular obser- vations of CO
2 and its stable isotope ratios as ever, less than half the anthropogenic emissions,
which implies that sinks, probably both in the well as CO, CH 4 and N
2O; however, these were limited to the summer periods of 1992, 1993 and oceans and on land, currently absorb the other
fraction. More than 10 years ago, Keeling et al. 1994. Within the European project EuroSiberian CarbonFlux three new sites for regular aircraft (1989), in a modelling study based on observed
latitudinal gradients of CO
2and13CO2, located a sampling over Russia have been established:
Fyodorovskoye, Syktyvkar and Zotino. Together large fraction of these sinks in the northern hemi-
sphere, mainly in the North Atlantic ocean, while with new data from a parallel aircraft program over Western Europe, at Orle´ans, these measure- Tans et al. (1990), in a study based on sea-to-air
fluxes inferred from the CO
2 saturation state of ments provide important new information on the trace gas climatology over the Eurasian continent surface sea waters and on the latitudinal distribu-
tion of atmospheric CO
2, pointed out that a from about 1°E to 89°E in the latitude belt of 48°N to 62°N. In this paper, only the results from significant sink of carbon must be attributed to
the Northern Hemisphere continental biosphere. flask sampling at and above 2000 m a.s.l. are discussed. Also, we will only compare the measure- Since then, atmospheric studies (Fan et al., 1998;
Bousquet et al., 1999; Kaminski et al., 1999; ments of greenhouse gases, i.e. CO
2concentration and stable isotope ratios in CO
2as well as CH 4, Rayner et al., 1999) and ecological measurements
( Valentini et al., 2000) tend to support this latter N
2O and SF
6mixing ratios. For more information on the complete set of trace substances and vertical finding by Tans et al. (1990), but the partitioning
of the northern land sink between longitudes is profiles measured at these sites, see detailed reports by Lloyd et al. (2002), Ramonet et al. (2002a), still a point of debate.
In the last decade, the global network of atmo- and Sidorov et al. (2002).
spheric stations significantly increased at mid to high northern latitudes. However, most of the new
2. Sampling sites and methods stations are located in the marine boundary layer,
or on the fringe of continents. As a consequence,
2.1. Flight locations the land fluxes remain poorly constrained.
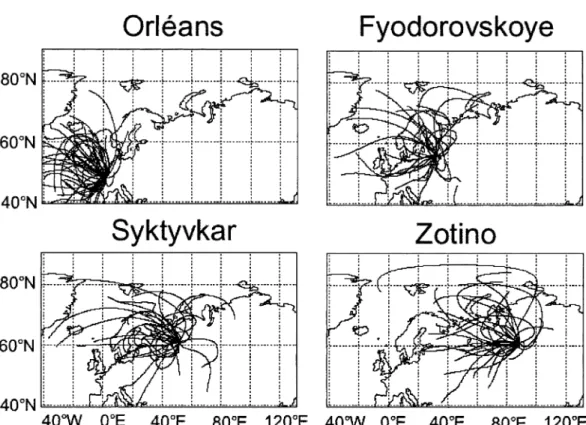
Although the atmospheric transport is a superb Figure 1 shows the map of the EuroSiberian study region with the sampling locations.
integrator of the surface fluxes, it is nevertheless
difficult to make measurements in the continental Extending from Western Europe to the Siberian Highlands, the four sampling sites represent con- atmosphere that are representative of large-scale
sources and sinks, say at the regional to contin- siderably different catchment areas which are illus- trated by trajectories that extend three days ental scale (>106km2). This is because the sources
are spatially heterogeneous and highly variable in backwards in time starting from the stations at a height of 2500 m a.s.l. The back-trajectories time, and because the atmospheric transport is
also more variable over vegetated areas than over are calculated with the Hybrid Single-Particle Lagrangian Integrated Trajectory (HYSPLIT4) the oceans (Denning et al., 1996). Therefore, stud-
ies aiming to deduce the fluxes from atmospheric model of Draxler and Hess (1997) using wind fields from the National Center for Environmental measurements are primarily limited by the lack of
adequate data. It has been hypothesised (Tans Prediction/National Oceanic and Atmospheric Administration (NCEP/NOAA) medium-range et al., 1996) and further quantified (Gloor et al.,
2000) that repeated vertical profiles in the middle weather forecast model. While the Orle´ans site largely experiences North Atlantic air masses, the of continents will improve the diagnostic power
for quantifying the land carbon fluxes. Fyodorovskoye and Syktyvkar sites, although still generally influenced by westerly winds, during Our knowledge of the atmospheric CO
2distri-
Fig. 1. Map of Eurasia with the sampling sites for vertical aircraft soundings and 3 d back trajectories calculated for the height level of 2500 m a.s.l. for the individual sampling dates and sites at Orle´ans, Fyodorovskoye, Syktyvkar and Zotino.
aircraft sampling are more influenced by north ated by the Svertsov Institute for Evolutionary and Ecological Problems (IPEE) in close co- western air masses which spent considerable
periods of time over north eastern Europe and operation with Max-Planck-Institut fu¨r Biogeo- chemie (MPI-BGC). The flight location for Scandinavia. By contrast, the most continental
Zotino sampling site on the margin of the west Fyodorovskoye is at 33°E, 56°N about 300 km north-west of Moscow. Vertical profiles of continu- wind belt also occasionally observes air masses
from north eastern Siberia and from the high ous CO
2NDIR, temperature and relative humid- ity measurements as well as flask sampling from Arctic.
The Orle´ans aircraft program is operated by 100 to 3000 m are performed every 2–4 wk. The sampling location is over the Central Forest the Laboratoire des Sciences du Climat et de
l’Environnement, CE Saclay (LSCE), in co- Reserve at Fyodorovskoye in Central European Russia, the southern taiga, where continuous operation with Meteo France since 1996. The
flight location is at 1°E, 48°N, about 300 km south ground measurement sites in a forest and a bog have been established within EuroSiberian of Paris over an area of agricultural land and
forests. Regular vertical aircraft profiles for flask CarbonFlux (Schulze et al., 2002). Flask samples have been analysed by LSCE for CO
2concentra- sampling are performed every 2–3 wk from 100 to
3000 m a.s.l. Flasks are analysed at LSCE for CO
2 tion and stable isotope ratios in CO
2, as well as for CO and CH
4 mixing ratios. Due to several concentration and stable isotope ratios (13C/12C
and18O/16O) in CO2, as well as for CO and CH
4 logistical and sampling problems, the records at this site contain large gaps, and complete seasonal mixing ratios.
The Fyodorovskoye aircraft program is oper- cycles of trace gases from flask sampling are not
yet available. For this first summary of the climato- ARROW up to June 1999 and Piper AZTEC from logy of greenhouse gases over the EuroSiberian Meteo France afterwards, whereas at the Russian region, we will only compare individual 3000 m sites, local Antonov-AN2 bi-plane aircraft were profile data points from Fyodorovskoye with used. Separate air intake lines (6 mm dekabon the other aircraft data. A more detailed report tubing) for continuous NDIR CO
2measurements summarising results from flasks and in situ profile (LiCor 6152) and for flask sampling systems were measurements is given by Ramonet et al. (2002a). installed in the wings of the respective aircraft.
The Syktyvkar aircraft program is operated by Whole air samples were collected into pre-condi- IPEE in close cooperation with MPI-BGC. Flights tioned 1-L cylindrical flasks made of Pyrex glass are performed 400 km west of the Ural mountains with PFA O-ring valves (Glass Expansion, over the Vychegodsko-Mezenskoj plain, about Australia) at both ends. Drying of the air was 100 km south east (52°E, 61°N) of the city of performed via magnesium perchlorate. Flasks Syktyvkar (160 000 inhabitants), the capital of the were flushed for more than 5 min at a flow rate Republic of Komi. The area belongs to the northern of ca. 4 L min−1, and pressurised to 1 atmosphere European taiga, dominating vegetation in this area
above ambient pressure at final filling (pump:
is pine forest (Pinus sylvestris).Vertical profiles of
KNF-Neuberger, Germany, N86KNDC with continuous CO
2NDIR soundings as well as temper-
EPDM membrane).
ature and relative humidity are measured every
Drying of the air with magnesium perchlorate 2–4 wk. Duplicate flasks are collected here only
under conditions of changing pressure may influ- at 2000, 2500 and 3000 m a.s.l. Flask sam-
ence the CO
2mixing ratio ending up in the flask.
ples have been analysed by the Institut fu¨r
In our sampling system, the drying unit is located Umweltphysik, Universita¨t Heidelberg (UHEI-
upstream of the pump unit, therewith experiencing IUP) for CO
2 concentration and stable isotope
only pressure changes according to the vertical ratios in CO
2, as well as for CH 4, N
2O and SF
6 atmospheric pressure change. Two different experi- mixing ratios.
ments have been performed to test possible system- The Zotino aircraft program is operated by the
atic biases caused by the drying agent, one in the Institute of Forest, Siberian Branch, Russian
laboratory, simulating inlet pressure drops similar Academy of Sciences (IF SB RAS) and MPI-BGC.
to those experienced during aircraft flights up to The flight location for Zotino is at 89°E, 61°N,
8.5 km (Langenfelds et al., 1996), and two tests about 600 km north of the city of Krasnoyarsk close
during real aircraft flights (Ramonet et al., 2002b).
to the small village Zotino located on the west bank
The laboratory tests resulted in no detectable of the Yenisei river. It is situated at the eastern edge
changes associated to pressure changes while the of the West Siberian Lowland, an extended
(3×10⁶km2) poorly drained area covered by 55% tests performed during aircraft flights when com- bogs and about 40% forests (Schulze et al., 2002). paring samples collected in parallel, with and The whole region belongs to the Siberian taiga without magnesium perchlorate showed differ- (boreal coniferous forest). Vertical profiles of CO
2, ences between pairs of samples collected dry measured with continuous NDIR, temperature and respectively wet of ‘‘dry–wet’’=−0.23±0.3 relative humidity, are obtained every 2–4 wk, and (n=4) during the first flight and of ‘‘dry–wet’’
air samples are collected in glass flasks between 100 =−0.10±0.3 (n=4) during the second flight.
and 3000 m a.s.l. Flask samples collected between Within the standard deviation of this comparison, June 1998 and July 2000 have been analysed by no significant offset could be observed. Any pos- CSIRO Atmospheric Research (CAR) for CO
2con- sible bias in the mixing ratios from aircraft samples centration and stable isotope ratios in CO
2, as well reported here are thus probably smaller than as for CO, CH
4, N
2O and H
2mixing ratios. Flask −0.25 ppm.
samples collected from July 2000 onwards were analysed by MPI-BGC in a newly commissioned
2.3. Flask analysis facility.
Laboratories responsible for flask analysis were 2.2. Flask sampling
LSCE at Orle´ans and Fyodorovskoye, UHEI- IUP at Syktyvkar and CAR and MPI-BGC at At the Orle´ans site, vertical profiling for flask
sampling was performed with light aircraft Piper Zotino. At LSCE, CO
2concentration analysis was
performed by NDIR (Hartmann & Braun, ory working standards (pure CO
2) and finally to the whole-air standards used to check the extrac- Germany, URAS-3G), whereas at UHEI-IUP,
CAR, and at MPI-BGC gas chromatographic tion procedures in the individual laboratory. This is particularly true ford18O. However, whole-air (GC) systems with a nickel catalyst for conversion
of CO
2into CH
4, and flame ionisation detectors standards such as those for CO
2mixing ratios are not yet available for stable isotope ratios in CO
2; (FID) were used. Stable isotope ratios in CO
were measured in all four laboratories by isotope2 therefore, using carbonate or water standards transferred to CO
2is the only ‘‘absolute’’ way to ratio mass spectrometry (IRMS, Finnigan-252,
Bremen, Germany), after cryogenic extraction of provide calibration of isotope ratio measurements in atmospheric CO
2. To date, MPI-BGC d18O CO2from the whole air samples. For description
of the CO
2 concentration and isotopic measure- data are calibrated against a whole air standard using the value assigned to it by CAR. All isotope ment procedures see Francey et al. (1996), Bourg
and Ciais (1998, 1999), Neubert (1998), Ramonet ratio data are corrected for interference with N 2O.
The absolute calibration procedures used in the et al. (1999), and Jordan and Brand (2001). In all
laboratories, CH
4 was analysed by GC-FID individual labarotories are reported in the detailed descriptions of the data from the individual sites (Levin et al., 1999; Jordan and Brand, 2001;
Langenfelds et al., 2001; Werner et al., 2001). The (Lloyd et al., 2002; Ramonet et al., 2002a; Sidorov et al., 2002).
N2O mixing ratio was analysed by the GC elec-
tron capture detector technique (ECD) in all For CH
4 all laboratories relate their mixing ratios to the NOAA/CCGG scale. For N
2O no flasks from Syktyvkar and Zotino by UHEI-IUP,
CAR and MPI-BGC (Jordan and Brand, 2001; internationally agreed calibration scale is avail- able. CAR and MPI-BGC relate their standards Langenfelds et al., 2001; Schmidt et al., 2001). SF
was only measured in flasks from Syktyvkar by6 to the scale that is maintained at CAR and derived from a suite of mixtures gravimetrically prepared UHEI-IUP also using GC-ECD technique (Maiss
et al., 1994). by NOAA/CMDL, while UHEI-IUP is prelimin-
arily linked to the SIO93 scale maintained at Scripps Institution of Oceanography for the 2.4. Calibrations and drift corrections
ALE/GAGE and AGAGE programs (Weiss et al., 1981; Schmidt et al., 2001). The scale factor linking For the CO
2mixing ratio, all data are reported in the WMO CO
2mole fraction scale maintained these scales has been precisely determined through regular exchange by CAR and SIO of high-pres- at NOAA/CCGG, Boulder, CO, USA. Laboratory
standards (CO
2in natural air) were obtained from sure cylinders used as calibration standards in the AGAGE program to 0.992 52, equivalent to a NOAA/CCGG. Stable isotope ratios in CO
2are reported on the Vienna-PDB-CO
2scale. Respect- difference of 2.4 ppb (CAR-SIO93) at a N 2O mixing ratio of 315 ppb. The Zotino data pre- ive carbonate reference standard material
(NBS-19) is provided by the International Atomic sented here have been adjusted to the SIO93 scale.
Preliminary results from a flask intercomparison Energy Agency (IAEA), Vienna. These standards
have to be chemically processed to yield carbon between CAR and UHEI-IUP during the period 1998–2000 performed with stainless steel con- dioxide gas for calibration of the respective
working gases (pure CO
2) at the mass spectro- tainers (2.5 L Sirocans, n=16) and with glass flasks identical to those used in this program(n= meters. Ford18O, calibration of the mass spectro-
meter can also be obtained through water 10)showed a mean difference of 0.7 and 0.5 ppb, respectively, with UHEI-IUP data being higher.
standards ( V-SMOW) which are equilibrated with
CO2. The V-SMOW scale is then mathematically This not yet finally confirmed scale difference must be kept in mind when comparing Zotino and converted to the V-PDB-CO
2scale. In this kind
of calibration, chemical or physical processing of Syktyvkar N
2O flask data. SF
6data from UHEI- IUP are reported relative to a diluted gravimetric primary reference material is necessary for the
transfer of the V-PDB (and the V-SMOW) scale standard gas provided by Messer Griesheim, Mannheim, Germany. The dilution procedure is to atmospheric CO
2samples. Through these pro-
cesses, laboratory biases may be introduced which described by Maiss et al. (1996). Its absolute accuracy is better than 1%.
may cause systematic calibration errors of laborat-
Based on long-term tests performed at CAR measurement of flask pairs by two different laboratories. All these intercomparison results are and MPI-BGC, all CO
2 and N
2O mixing ratios
presented here have been corrected for drift during summarised by Levin et al. (2002). The mean differences and standard deviations for CO
2ana- storage. Experiments were performed by ‘‘sausage
filling’’ of multiple flasks from a high-pressure lyses between pairs of laboratories did not exceed 0.20±0.45 ppm in CO
2mixing ratio, 0.06±0.03‰
cylinder with precisely determined mixing ratios,
to a pressure typical of field samples. These in d13C and 0.15±0.17‰ in d18O analyses.
Nevertheless, these differences are large when con- storage tests will be described in detail on the
EuroSiberian CarbonFlux web site (http:// sidering the observed gradients between different sites, and need to be reduced in future work.
www.bgc-jena.mpg.de /~martin.heimann / eurosib /),
a brief summary is presented here. At CAR, test Concerning CH
4 concentration, the laboratories compare within their internal pair reproducibility, flask samples were each analysed once only, at
various times up to 7 months after collection, i.e. ±(2–5) ppb. For N
2O the laboratories com- pare to better than ±0.7 ppb. Special care was while at MPI-BGC the same samples were
re-analysed on multiple occasions up to 1 yr after taken to assure the continuity of the record at the Zotino site when transferring the analysis from collection. For CO
2, both laboratories observed
an initial offset of−0.06 ppm, and a subsequent CAR to MPI-BGC. A total of 100 flasks was analysed in both laboratories with mean differ- drift of−0.0012 ppm per day of storage. For 100 d
of storage this corresponds to a total correction ences and standard deviations of individual comparisons (MPI–BGC–CAR) of −0.11 ppm of+0.18 ppm. For N
2O, ignoring any initial offset
which was not as well resolved relative to experi- (±0.15 ppm) for CO
2 analyses, 0.03 ppb (±1.94 ppb) for CH
4and−0.09 ppb (±0.30 ppb) mental precision, at least in the CAR tests, drift
rates of −0.0035 and−0.0033 ppb per day were for N 2O.
observed by CAR and MPI-BGC, respectively.
The CAR value has been used to correct all data
2.6. Data selection and typical pair reproducibility presented here. No significant drifts were observed
for CH
4. Although the stable isotopes of CO
2 Except for the Fyodorovskoye sampling site, where serious contamination of the samples were not included in these tests, their stability has
been previously monitored by CAR in their 0.5 L occurred from November 1998 until June 1999, the quality of the flask samples was good.
glass flasks, fitted with the same types of taps and
O-rings. No significant drifts were observed in Contamination of samples through leakage in the air intake line, which occurred at Fyodorovskoye d13C. No consistent drifts were observed ind18O
although in isolated cases, individual flasks did but also at Syktyvkar during two flights in October 1999, was easily detected by extremely exhibit large drifts that were probably related to
elevated moisture levels (see also Gemery et al., high CO
2and elevated CH
4mixing ratios. For all sites CO
2results with pair differences larger than 1996).
0.5 ppm and d13C–CO2 differences larger than 0.1‰ have been rejected from the records. For 2.5. L aboratory intercomparison
the18O/16O ratio of CO2, reliable drying of the samples is essential. On some occasions this was Besides relating our measurements of green-
house gases to common international standards not achieved, and manifested itself in pair differ- ences ford18O larger than 0.15‰. Thesed18O data (where available), quality control and inter-
comparison of the individual laboratories particip- have also been removed from the data sets. For the remaining samples, the mean pair reproducibil- ating in this joint project is crucial to achieve
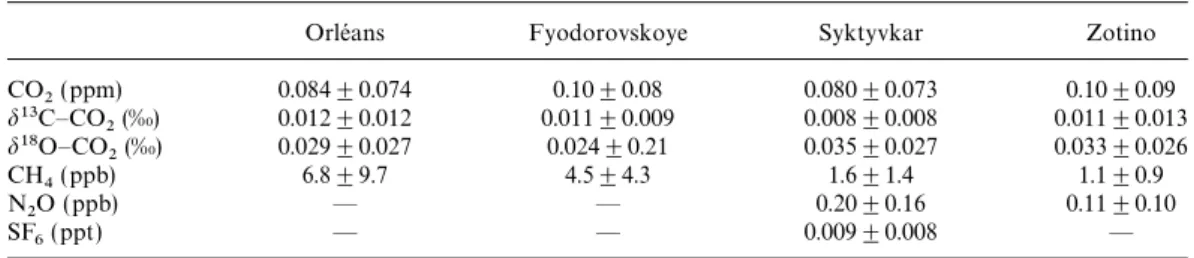
comparable and reliable results. Within the ity for the individual stations is given in Table 1.
EuroSiberian CarbonFlux project, a number of intercomparison exercises have been performed:
2.7. Curve-fitting procedures exchange of pure CO
2samples for isotopic analysis
as well as exchange of high-pressure cylinders and To derive the amplitude and phase of the sea- sonal cycles as well as annual means for the flasks identically filled with tank air. In addition,
intercomparison was performed through duplicate different components at the different sites, har-
Table 1. Pair reproducibility and its standard deviation for trace components analysed in aircraft flasks
Orle´ans Fyodorovskoye Syktyvkar Zotino
CO2(ppm) 0.084±0.074 0.10±0.08 0.080±0.073 0.10±0.09
d13C–CO
2(‰) 0.012±0.012 0.011±0.009 0.008±0.008 0.011±0.013
d18O–CO2(‰) 0.029±0.027 0.024±0.21 0.035±0.027 0.033±0.026
CH4(ppb) 6.8±9.7 4.5±4.3 1.6±1.4 1.1±0.9
N2O (ppb) — — 0.20±0.16 0.11±0.10
SF6(ppt) — — 0.009±0.008 —
monic fit curves have been calculated through the some contributions from fossil fuel emissions.
data. Linear trends and seasonal cycles using two The maximum summer sink d13C signature of harmonics and digital filtering (cut-off period −21±3‰ corresponds to an ecosystem discrim- 6 months) have been calculated with a fitting inationD of−13.5‰, assuming a mean summer routine from Nakazawa et al. (1997b). Due to CBLd13C–CO2 of −7.5‰. Mean values of the occasional data gaps of several weeks up to apparent source signature for summer (June to months, annual mean values were calculated from October) are −25.9±1.0‰ and for winter the fitted harmonic curves and not from the data −30.8±0.9‰. Similar seasonal differences of the themselves. At all Russian stations except for apparent source signature in the order of 4–5‰
Fyodorovskoye, complete annual cycles of obser- have been found at mid-northern latitude sites by vations exist only for 1999 and 2000; therefore, Bakwin et al. (1995, 1998). Lloyd et al. (2002), for these two years only mean values have been inspecting vertical profiles at Zotino extending calculated and are compared in Section 3.3. from 100 up to 3000 m, also observed winter situations with source d13C–CO2 as depleted as
−31.6‰. These situations could be clearly identi- 3. Results fied as ‘‘polluted’’ by enhanced CO mixing ratios.
Again during the winter season, however, they 3.1. Carbon dioxide mixing ratios and13C/12C also frequently observed CO
2 increases in the ratio in atmospheric CO
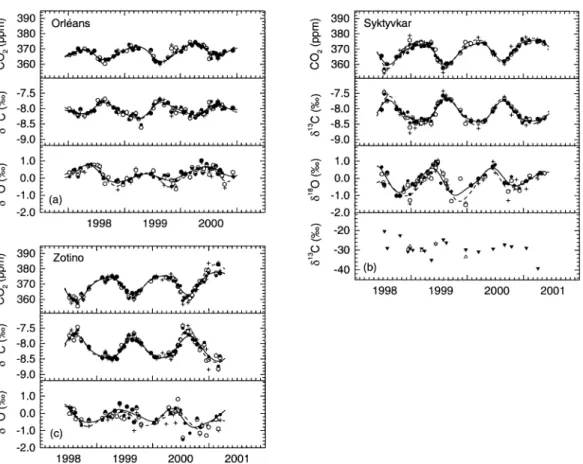
2 boundary layer which are not elevated in CO, and therefore postulated to be caused by soil emissions Figures 2a–2c show the three year-long records
of respiratory CO
2with source signatures ranging of CO
2 mixing ratio, d13C–CO2, and d18O–CO2 fromd13C=−26.8 to−28.9‰.
from the three aircraft sites Orle´ans, Syktyvkar,
Figure 3 shows the correlation of de-trended and Zotino. At all three sites, very regular seasonal
d13C and 1/[CO
2] at all four sites for free tropo- cycles are observed at all three height levels and
spheric air observed at the respective 3000 m in all three components. At the two Russian sites,
height level for all data. The apparent source the CO
2andd13C amplitudes decrease with height
signatures change from Orle´ans with from 2000 to 3000 m. As expected, the sign of CO
2 d13C(source)=−24.8±1.4‰ to Fyodorovskoye and d13C vertical gradients changes between
with d13C(source)=−26.0±1.0‰, Syktyvkar summer, with a net ground level sink of CO
2, and
with d13C(source)=−27.8±0.3‰, and Zotino winter, with a net source. For Syktyvkar, in a
with d13C(source)=−27.1±0.4‰. It is obvious number of profiles, the CO
2concentration gradi-
from Fig. 3 that the scatter in the Keeling plots ent between 2000, 2500 and 3000 m was larger
is larger at the two western sites Orle´ans and than 1 ppm, enough to derive with confidence the
Fyodorovskoye than at the more continental sta- d13C signature of the source CO
2 and/or the
tions. Except for occasional long-range transport discrimination of the sink responsible for this
of polluted air, the source distributions around gradient. From a two-component mixing approach
Syktyvkar and Zotino are probably more homo- according to Keeling (1961) we calculated this
geneous than further to the west, where sources source signature for individual profiles (Fig. 2b,
from sea-to-air fluxes, natural ecosystems, lowest panel ). The most depleted source signatures
are observed during winter, possibly containing agricultural land, and anthropogenic emissions all
Fig. 2. (a) CO
2mixing ratio, d13C–CO2and d18O–CO2 observed in aircraft samples over Orle´ans, France (1°E, 48°N) at three height levels, 2000 m (crosses), 2500 m (open circles) and 3000 m (closed circles). Dashed lines are harmonic fit curves through the 2000 m data, solid lines harmonic fit curves through the 3000 m data. ( b) Same as (a) but for the Russian site Syktyvkar (52°E, 61°N). The lowest panel shows apparent source signatures calculated from individual profiles where CO
2 gradients between 3000 m and 2000 m (closed symbols) and 2500 m (open symbols) were larger than 1 ppm. (c) Same as (a) but for the Siberian site Zotino (89°E, 61°N).
substantially contribute to the seasonality and 3.2. 18O/16O ratio in atmospheric CO variability. There is a slight gradient in the annual 2
The d18O–CO
2records at all three sites (Figs.
mean source signature along a transect from
2 and 4) also show a regular seasonality, however Orle´ans over Fyodorovskoye towards Syktyvkar
with a phase shift of about two months compared and Zotino. Possibly, the presence of considerable
tod13C, the d18O maximum occurring earlier in areas of introduced C4 agricultural species such
the year (May/June instead of July/August). Most as maize and sorghum in Western Europe
visible at Syktyvkar, this maximum coincides with (Orle´ans) contribute to this gradient by reducing
the maximum draw-down rate of CO
2 mixing the overall extent of 13C discrimination (Lloyd
ratio in the atmosphere, i.e. when the net uptake and Farquhar, 1994). The change of mean source
of CO
2by plant assimilation (NEP) reaches max- signature in the order of −1 to −2‰ observed
imum values (Arneth et al., 2002; Milyukova et al., between Fyodorovskoye and the two sites further
2002). Therefore, thisd18O–CO2maximum is most to the north-east (Syktyvkar and Zotino) is, how-
probably caused by strong photosynthetic activity ever, also consistent with the difference observed
and exchange of18O with leaf water in the plants, (and modelled) between temperate to cool and
cold forest ecosystems by Kaplan et al. (2002). which is generally enriched due to evapotranspir-
is always depleted with respect to the free tropo- sphere, irrespective of whether the overall CO profile indicated the underlying terrestrial surface2 to be a source or a sink of CO
2.
In autumn and early winter, most visible at Zotino in the second half of 2000, very depleted d18O values are observed at the Russian sites. If these measurements are not affected by sampling or measurement problems, then the most plaus- ible explanation is that they indicate strong18O equilibration processes (gross CO
2 exchange) at ground surfaces rather than net CO
2 emissions (i.e. from fossil fuels or net soil respiration).
3.3. Comparison of CO
2and stable isotopic results between sites for f ree tropospheric conditions Fig. 3. ‘‘Keeling Plot’’ from detrended data normalised
to 1999 of the inverse CO2mixing ratios andd13C–CO2 (3000 m a.s.l.) to derive the meand13C source signatures driving the
From examination of the continuous vertical respective seasonal cycles at the four aircraft sites
profiles of CO
2, relative humidity, and temper- at 3000 m a.s.l. (Orle´ans: dashed line, d13Csource=
−24.8±1.4‰; Fyodorovskoye: dotted-dashed line, ature, in most situations it is possible to determine d13Csource=−26.0±1.0‰; Syktyvkar: solid line, the height of the atmospheric boundary layer d13Csource=−27.8±0.3‰; Zotino: dashed–dot–dot
(ABL) during individual flights (Lloyd et al., 2002;
line,d13Csource=−27.1±0.4‰).
Ramonet et al., 2002a; Sidorov et al., 2002). Due to radiative/convective processes over the contin- ents, this ABL height changes from 300–500 m ation ind18O–H2O by about 10–20‰ if compared
to the source (ground) water supply (Bariac et al., during winter to 1500–2800 m in summer.
Measurements within the ABL, even during the 1994; Langendo¨rfer et al., 2002). The strong
decrease in the atmospheric d18O–CO
2 signal day, are still largely affected by regional short- term ground level processes while, as a first-order during the remaining summer and autumn season
can be interpreted as a dominating influence of approach, the 3000 m level represents the large- scale background situation of the lower tropo- soil respiration CO
2fluxes over assimilation fluxes
on the troposphericd18O–CO2. Measurements in sphere. Representative gradients over the EuroSiberian region can, therefore, be derived a Canadian boreal forest showed that CO
2origin-
ating from soil respiration is depleted in d18O primarily from the data at the 3000 m level. For CO2and its stable isotope ratios, Fig. 4 shows the compared to atmospheric CO
2 by about 5–20‰
(Flanagan et al., 1997), and, from aircraft sampling comparison of observations at all four sites. (Note that for Fyodorovskoye harmonic fit curves have in the nocturnal boundary layer in early morning
during the intensive campaign in Zotino, July not been calculated due to data gaps.) The ampli- tudes of the seasonal cycles in all three components 1998, a d18O–CO2 value for respired CO
2 of
−15‰ has been obtained (Styles et al., 2002). At increase from Orle´ans towards Syktyvkar and Zotino (Table 2). The annual mean values show a Syktyvkar and Zotino, throughout the year,d18O
seems to be slightly more depleted at the lower significant increase in the CO
2 mixing ratio and a corresponding decrease in d13C–CO2, from level (2000 m) than at 3000 m, supporting the
hypothesis of dominating influence from a gener- Syktyvkar towards Zotino in 1999, which indicates change of mean air mass origin and/or large net ally depleted CO
2source and sink at ground level.
This behaviour is less pronounced at Orle´ans than flux changes in the longitude band from Syktyvkar to Zotino, i.e. from about 50 to 90°E, where large at the two Russian sites. Support for this also
comes from the data presented by Lloyd et al. areas are covered by wetlands. The d13C source signature of this flux is calculated to have a value (2002). They observed that for the Zotino site,
d18O–CO2within the atmospheric boundary layer of−27.6‰, very similar to the source signature
et al., 1993; Ciais et al., 1997; Cuntz et al., 2002).
Our atmosphericd18O–CO
2observations, for the first time, manifest this gradient as being trans- ferred through surface vegetation interaction into the isotopic abundance of atmospheric CO
2in the respective area.
From the observed signal we can roughly estim- ate the respiration flux that must be involved in this proces. We assume a mean residence time of air masses reaching central Eurasia to about 5 d (see trajectories in Fig. 1), and a well mixed lower tropospheric air mass layer M of 3000 m thick- ness (our observation level ) which is influenced by the surface flux. The change in d18O–CO (Dd18Oair/Dt)between Orle´ans and central Eurasia2 is given by the mass balance equation:
MDd18O
Dt air=ADleaves+R(d18Osoil−d18Oair−esoil) (1) where A and R are the gross carbon fluxes of photosynthesis and ecosystem respiration, respect- Fig. 4. Comparison of CO2mixing ratio (upper panel ), ively,Dleavesis the leaf isotope discrimination and d13C–CO2(middle panel ) andd18O–CO2( lower panel ) d18O
soil and e
soil, respectively, the isotopic com- at the four aircraft sites for the 3000 m level. The lines
position of soil-respired CO
2 and the diffusive are harmonic fit curves through the respective data
soil–atmosphere fractionation [7.2‰ after Miller (Orle´ans: dashed line; Syktyvkar: solid line; Zotino:
et al. (1999)]. Assuming A to be zero in late dashed–dot–dot line).
autumn and early winter, and ad18Osoilof−12‰
from a global modelling study (Cuntz et al., 2002), we can estimate the respiration fluxRto 0.25 mol derived from the annual cycles at the two stations
CO2m−2d−1or 3mmol m−2s−1during this time (Fig. 3). However, a positive gradient between
of the year. This value is in reasonable agreement Zotino and Syktyvkar of 1–2 ppm does not sup-
with eddy flux measurements in the same region port the existence of strong ecosystem uptake, at
at that time of the year (Milyukova et al., 2002).
least in Western and Central Siberia, as calculated
However, this flux would, if the emitted CO by Bousquet et al. (1999). 2
remained in the mixing layer over 5 d (as was One interesting feature of our observations is
assumed ford18O in our simple approach) cause thed18O–CO2gradient between Orle´ans and the
a continental gradient in the order of 10 ppm. As two continental sites, Syktyvkar and Zotino, in
we only observe a CO
2increase of less than 4 ppm autumn and winter of the order of−0.5 to−1.0‰.
between Orle´ans and Zotino (associated with the A substantial gradient towards more continental
d18O gradient of−0.5‰) our mass balance equa- longitudes within Eurasia, at least during times
tion is probably too simple. Processes such as when the continents are a net source of CO
2, was
vertical mixing into the free troposphere (above certainly expected from the well known gradient
3000 m) which reduce the concentration increase ofd18O in precipitation water (IAEA, 1969–1998;
have to be considered; but also possible 18O Sonntag et al., 1983). As a consequence of depleted
equilibration of atmospheric CO
2with soil surface precipitation, surface ground water has been mod-
water by invasion into the topsoil (Tans, 1998) elled to show a decrease of the order of 10–20‰
may increase thed18O gradient without altering between the Atlantic coast and the continental
area around Syktyvkar and Zotino (Farquhar the CO
2gradient.
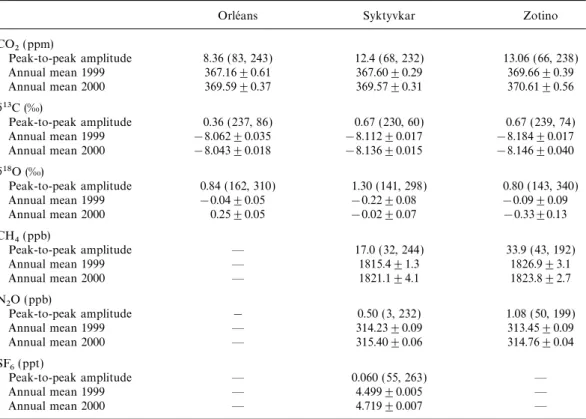
Table 2. Average peak-to-peak amplitudes (1998–2001) and annual mean values 1999 and 2000 of trace gas components measured at the EuroSiberian aircraft sitesa
Orle´ans Syktyvkar Zotino
CO2(ppm)
Peak-to-peak amplitude 8.36 (83, 243) 12.4 (68, 232) 13.06 (66, 238)
Annual mean 1999 367.16±0.61 367.60±0.29 369.66±0.39
Annual mean 2000 369.59±0.37 369.57±0.31 370.61±0.56
d13C (‰)
Peak-to-peak amplitude 0.36 (237, 86) 0.67 (230, 60) 0.67 (239, 74)
Annual mean 1999 −8.062±0.035 −8.112±0.017 −8.184±0.017
Annual mean 2000 −8.043±0.018 −8.136±0.015 −8.146±0.040
d18O (‰)
Peak-to-peak amplitude 0.84 (162, 310) 1.30 (141, 298) 0.80 (143, 340)
Annual mean 1999 −0.04±0.05 −0.22±0.08 −0.09±0.09
Annual mean 2000 0.25±0.05 −0.02±0.07 −0.33±0.13
CH4(ppb)
Peak-to-peak amplitude — 17.0 (32, 244) 33.9 (43, 192)
Annual mean 1999 — 1815.4±1.3 1826.9±3.1
Annual mean 2000 — 1821.1±4.1 1823.8±2.7
N2O (ppb)
Peak-to-peak amplitude − 0.50 (3, 232) 1.08 (50, 199)
Annual mean 1999 — 314.23±0.09 313.45±0.09
Annual mean 2000 — 315.40±0.06 314.76±0.04
SF6(ppt)
Peak-to-peak amplitude — 0.060 (55, 263) —
Annual mean 1999 — 4.499±0.005 —
Annual mean 2000 — 4.719±0.007 —
aThe numbers in parentheses are the respective Julian days of the seasonal cycle maximum and minimum.
3.4. Methane mixing ratio of 0.1 PgC yr−1by the biosphere in the same area (i.e. Bousquet et al., 1999). Moreover, with regard Our main objective when starting this aircraft
to the climatic impact of CH
4, when using a time program was to investigate the carbon balance
horizon of 100 yr, its global warming potential is over Russia. Concerning gross carbon fluxes
higher by a factor of 21 compared to CO 2(IPCC, between the biosphere and the atmosphere, this
1996). Thus, considering only the area of the West exchange (to more than 98%) is dominated by
Siberian Lowland, the warming effect of its net carbon dioxide. However, in the taiga and tundra
CH4emissions would still be about twice that of regions of the West Siberian Lowland with its
the potential ‘‘cooling’’ effect by the postulated extended wetland areas, net carbon fluxes associ-
CO2sink!
ated with anaerobic decomposition of organic
Most of the flasks collected during aircraft material and eventual emissions of methane
profiling have been analysed for CH
4mixing ratio, cannot be neglected. Estimated ranges of CH
4 with the results from the free tropospheric samples emissions from this area are between 10 and 30 Tg
at 3000 m being presented in Fig. 5 (upper panel ).
CH4per year (0.007–0.022 PgC yr−1), depending
As expected for mid-northern latitudes, the data on the study (Aselmann and Crutzen, 1989;
from the Russian sites show a seasonality, with Bartlett and Harriss, 1993; Christensen et al.,
maximum concentrations during autumn and 1996). This corresponds to a carbon source to the
winter and a minimum in summer. However, atmosphere in the order of 10% of the absolute
value of a postulated net CO
2uptake in the order particularly in 1998 the scatter of the data is rather
a CH4 gradient of 10 ppb, as observed in 1999 between the two sites, representing a well mixed air column up to 3000 m, requires a methane source to the atmosphere of about 7 mg CH m−2d−1. This flux may reflect emissions either4 from the widespread area of wetlands over the West Siberian Lowland or from large fields of natural gas exploited from the Northern Ob river basin. Our estimated emission is close to the mean summer season (June–October) methane flux den- sity estimated for the Hudson Bay Lowlands in Northern Canada, which ranges from about 2 mg CH4m−2d−1in October to a maximum of 13 mg CH4 m−2d−1 in August (Worthy et al., 2000).
Also remarkable is that CH
4mixing ratios meas- ured during individual flights in autumn 1999 are much less scattered than in autumn 1998, where occasionally very high mixing ratios up to 1890 ppb are observed at Zotino even at 3000 m.
This high scatter in 1998 is possibly due to higher regional wetland emissions in 1998 compared to 1999. Globally speaking, 1998 was the warmest year of the last century, and also in marine back- ground air an anomalous growth rate was Fig. 5. Concentration records of the greenhouse gases
CH4(upper panel ), N
2O (middle panel ) and SF
6( lowest observed, particularly in high northern latitudes panel ) derived from aircraft samples at Orle´ans, by Dlugokencky et al. (2001), which they partly Fyodorovskoye, Syktyvkar, and Zotino. The lines are attribute to anomalously high wetland emissions.
harmonic fit curves through the Syktyvkar (solid line)
Examination of long-term weather records for the and Zotino (dashed–dot–dot line) data. The N
2O shift
town of Surgut, located near the centre of the between Syktyvkar and Zotino is most probably due to
West Siberian Lowland, suggests that this may different calibration scales used in the two laboratories.
have also been the case in the extensive wetlands of that region. The mean temperature for July 1998 was 21.4°C, higher than any value recorded between 1885 and 1983 in the long-term database large. A large variability of CH
4 mixing ratios
has been observed earlier by Tohjima et al. for Surgut of Razuvayev et al. (1993). The highest July average temperature previously reported (1997) during transect flights over Siberia in July
1993. The seasonal peak-to-peak amplitudes at (excluding 1984 to 1993 for which we do not have data available) was 20.8°C in 1886. This compares Syktyvkar and Zotino are up to 40 ppb in
1998/1999. Due to occasionally high concentra- to an average July temperature in Surgut (calcu- lated using 1885–1983 data) of 17.1°C, and a July tions at Zotino, annual mean values are up to
10 ppb higher at Zotino than at Syktyvkar during 1999 temperature of 18.1°C.
that period. Orle´ans data from Western Europe seem to be lower again by about 20–30 ppb. There
3.5. Sulfur hexafluoride mixing ratio is obviously a significant CH
4accumulation over
Central Eurasia, most probably due to wetland Sulfur hexafluoride (SF
6) is a chemically very stable and purely anthropogenic greenhouse gas, emissions ( late summer and autumn); however,
influences from anthropogenic sources such as which is industrially used mainly in electrical insulation and switching, and for degassing and natural gas production and distribution cannot be
excluded [a source of 17 Tg CH
4yr−1after Hein purifying of molten reactive metals (Maiss and Brenninkmeijer, 1998). Destruction of SF
6occurs et al. (1997)]. Assuming a mean residence time of
air masses of 3 d between Syktyvkar and Zotino, only in the very high stratosphere and in the
mesosphere. Since the 1970s, atmospheric SF
6has of both gases. SF
6 has no seasonally varying sources, while for N
2O, natural and anthropogenic been increasing globally at a rate of more than
6% per year (Maiss et al., 1996; Geller et al., emissions from soils were observed to be highest during spring and summer (Flessa et al., 1995;
1997). SF
6mixing ratios have only been analysed
in the Syktyvkar flasks (Fig. 5, lowest panel ). As Schmidt et al., 2001). This should lead to max- imum concentrations in the free troposphere in observed globally, this greenhouse gas is still
strongly increasing at a recent rate of about 5% summer and autumn. By contrast, concentrations of N2O (and SF
6) tend to be more or less constant per year. SF
6shows a regular seasonality which is strikingly in parallel to N
2O (Fig. 5, middle panel ). or even decreasing during summer. Therefore, rather than being due to seasonally varying This seasonal cycle must be associated with atmo-
spheric transport patterns, as the purely anthropo- sources, the observed seasonality of both gases is more likely due to atmospheric mixing processes.
genic sources of SF
6 have no seasonality (see
discussion in Section 3.6). One process possibly contributing to the seasonal cycles of both greenhouse gases is a seasonally varying stratosphere–troposphere exchange. N
2O 3.6. Nitrous oxide mixing ratio
is destroyed by photolysis at wavelengths between 180 and 230 nm in the stratosphere, it has no Nitrous oxide (N
2O) is a greenhouse gas with
natural and anthropogenic sources (Ehhalt et al., known sinks in the troposphere (Ehhalt et al., 2001). Due to the photolytical sink process, a 2001). Major emissions are from natural tropical
soils as well as from the ocean. Fertilised soils are steep vertical gradient of N
2O is observed in the stratosphere with mixing ratios decreasing to only a large anthropogenic source in mid-northern
latitudes as well as a number of industrial pro- 10% of the tropospheric value above 25 km.
Similarly, SF
6mixing ratios decrease with height cesses. N
2O mixing ratios were determined in
all flasks from Syktyvkar and Zotino. Figure 5 by almost 50% (Harnisch et al., 1998; Strunk et al., 2000). If the seasonal cycles of N
2O and (middle panel ) shows the results at both sites for
the highest flight level. Both aircraft records show SF
6were both due to a springtime input of strato- spheric air intrusions into the troposphere, a pronounced seasonality with a peak-to-peak
amplitude between 0.5 and 1.1 ppb. The mean the ratio between the driving stratosphere–
troposphere gradients and the amplitudes in the growth rate is 1.2–1.3 ppb yr−1. The mean N
2O
level at Syktyvkar is higher than at Zotino by troposphere of both gases should be similar.
The troposphere minus lower stratosphere 0.7 ppb. This difference has the same magnitude
as the preliminarily determined scale difference (250–100 hPa) difference for N2O in high northern latitudes is about 40 ppb, while the respective between CAR/MPI-BGC and UHEI-IUP of
0.5–0.7 ppb [Section 2.4 and Levin et al. (2002)]. gradient for SF
6 is about 0.6 ppt (Strunk et al., 2000). The observed peak-to-peak amplitudes of Therefore, although still preliminary, we conclude
that there is no significant N
2O difference in the the seasonal cycles at Syktyvkar are 0.5±0.3 ppb for N
2O and 0.060±0.035 ppt for SF
6. From this free troposphere between Syktyvkar and Zotino.
The N
2O results from the 2000 and 2500 m levels we derive ratios between gradient and seasonal amplitude differing by a factor of about 6–7 [not shown here but presented by Lloyd et al.
(2002) and Sidorov et al. (2002)] do not differ between N
2O and SF
6. In fact, the seasonal ampli- tude of SF
6 in the southern hemisphere, which from the free troposphere values which, in com-
bination with the missing gradient between was largely attributed by Levin and Hesshaimer (1996) to stratosphere–troposphere exchange, is Syktyvkar and Zotino suggests that, contrary to
fertilised soils and soils exposed to nitrogen depos- only about 0.02 ppt, one third of that observed at Syktyvkar. Consequently, other processes must ition (Bouwman et al., 1995), natural soils in
boreal regions are probably not a large source contribute to the seasonal cycle of SF
6. One of these may be the seasonal change of the circulation of N2O.
As mentioned earlier, the phasing of the seasonal pattern, but this process can only contribute to the seasonal cycle of a trace gas in mid-to-high cycle of N
2O is very similar to that of SF 6. This
suggests that similar processes may be the driving latitudes if that gas also has a significant latitudinal gradient. This is only the case for SF
6, which modulating force for the observed seasonal cycles
shows an increase of about 0.2 ppt from 70°N to validate transport patterns of models (Denning et al., 1999), SF
6measurements along the west–e- 50°N (Maiss et al., 1996). All in all, this suggests
that the origin of the tropospheric seasonal cycle ast transect Orle´ans–Syktyvkar–Zotino would be highly desirable.
of N2O is still not readily explicable, but that
stratosphere–troposphere exchange which shows The observed small atmospheric signals make high demands on measurement accuracy, and, as the correct phasing (Appenzeller et al., 1996) may
make a significant contribution to the observed in our case of a concerted program with several participating laboratories, on inter-laboratory seasonal pattern observed over Western Siberia.
comparability. In fact, the latter may be the limit- ing component of a cooperative network, if these data are to be used successfully in model inversion 4. Conclusions
estimates to derive net Eurasian trace gas fluxes.
On the other hand, the interannual variability of The EuroSiberian aircraft program, started in
1998, has provided a unique set of trace gas horizontal gradients is considerable and our 3-yr observations can only provide a snapshot of the observations over the Eurasian continent which
will serve as an invaluable source of information long-term climatology over this extended contin- ental area. Much longer observational records are to investigate quantitatively the associated bio-
geochemical cycles with these entities. From the definitely necessary to provide reliable answers to the urgent questions of the role of the great land first results presented here we can conclude that
the observed gradients in CO
2and stable isotopic masses of the Eurasian continent in global budgets of atmospheric greenhouse gases.
ratios in the vertical and across the Eurasian continent are small. As expected, the seasonal amplitudes of CO
2concentration and stable iso- tope ratios in CO
2increase towards more contin- 5. Acknowledgements ental sites due to large seasonal CO
2 exchange
fluxes with the continental biosphere. However, We thank all colleagues from the EuroSiberian CarbonFlux project who helped to make this the largest changes in amplitude are observed
between Orle´ans (Western Europe) and Syktyvkar, exercise a successful one. In particular, we thank the pilots of the AN2 aircraft and from Meteo while the further increase in amplitude between
Syktyvkar and Zotino is not significant. Also, the France, and also the personnel at ground level who helped with all the logistics, as well as the mean CO
2concentration and isotope ratios gradi-
ents within the Eurasian continent, i.e. between technical and scientific staff in the analysing laboratories. We are also grateful to Takakiyo Syktyvkar and Zotino, are very small. The same
is true for CH
4. Here, probably due to net emis- Nakazawa for providing his fit routines. Besides being always open for discussions on our 18O sions from wetlands and natural gas production,
we observe the largest gradient between Western results, Uwe Langendo¨rfer spent numerous hours in conditioning about 1000 glass flasks for trace Europe and Russia. Although still preliminary, no
horizontal N
2O gradient is observed between gas sampling. Colin Allison, Armin Jordan and Willi Brand are kindly acknowledged for their Syktyvkar and Zotino. From this and from vertical
profiles of N
2O which show no gradient between esteemed input to the manuscript. Also we thank Pieter Tans who reviewed the manuscript for 2000 and 3000 m, we infer that the natural boreal
forest areas are probably neither a significant T ellus,for his constructive comments and sugges- tions for improvements. This project has been source nor a sink of N
2O to the atmosphere. N 2O and SF
6 show small seasonal cycles over partly funded by the European commission under ENV4-CT-97-0491 and by the Max-Planck- Eurosiberia which must be associated to the trans-
port pattern in the sub-polar atmosphere. To Gesellschaft, Mu¨nchen, Germany.
REFERENCES
Appenzeller, C., Holton, J. R. and Rosenlof, K. H. 1996. the continental effect of oxygen isotopes over Eurasia.
T ellus54B, this issue.
Seasonal variation of mass transport across the tropo-
Denning, A. S., Randall, D. A., Collatz, G. J. and Sellers, pause. J. Geophys. Res.101, D10, 15,071–15,078.
P. J. 1996. Simulations of terrestrial carbon metabol- Arneth, A., Kurbatova, J., Lloyd, J., Kolle, O., Shibis-
ism and atmospheric CO
2 in a general circulation tova, O., Vygodskaya, N. N. and Schulze, E.-D. 2002.
model. Part 2: Simulated CO2concentrations.T ellus Comparative ecosystem–atmosphere exchange of
48B, 543–567.
energy and mass in a European and a central Siberian
Denning, A. S., Holzer, M., Gurney, K. R., Heimann, M., bog II. Interseasonal and interannual variability of
Law, R. M., Rayner, P. J., Fung, I. Y., Fan, S.-M., CO2fluxes.T ellus54B, this issue.
Taguchi, S., Friedlingstein, P., Balkanski, Y., Maiss, M.
Aselmann, I. and Crutzen, P. J. 1989. Global distribution
and Levin, I. 1999. Three-dimensional transport and of natural freshwater wetlands and rice paddies, their
concentration of SF
6: a model intercomparison study net primary productivity, seasonality and possible
(TransCom 2).T ellus51B, 266–297.
methane emissions.J. Atmos. Chem.8, 307–358.
Dlugokencky, E. J., Walter, B. P., Masarie, K. A., Lang, Bakwin, P., Tans, P. P., Zhao, C., Ussler, W. and
P. M. and Kasischke, E. S. 2001. Measurements of an Quesnell, E. 1995. Measurements of carbon dioxide
anomalous global methane increase during 1998.
on a very tall tower.T ellus47B, 535–549.
Geophys. Res. L ett.28, No. 3, 499–502.
Bakwin, P., Tans, P. P., White, J. W. C. and Andres, R. J.
Draxler, R. R. and Hess, G. D. 1997. Description of the 1998. Determination of the isotopic (13C/12C) discrim-
HYSPLIT4 modeling system. NOAA T ech. Mem., ination by terrestrial biology from a global network
ERL ARL -224.
of observations. Global Biogeochem. Cycles 12,
Ehhalt, D., Prather, M., Dentener, F., Derwent, R., 555–562.
Dlugokencky, E., Holland, E., Isaksen, I., Katima, J., Bariac, T., Gonzales-Dunia, J., Katerji, N., Be´thenod, O.,
Kirchhoff, V., Matson, P., Midgley, P. and Wang, M.
Bertolini, J. M. and Mariotti, A. 1994. Variabilite´ spat-
2001. Atmospheric chemistry and greenhouse gases.
ialle de la composition isotopique de l’eau (18O,2H)
In: Climate change 2001: the scientific basis (eds.
dans le continuum sol-plante-atmosphe`re: 2. Approche
Houghton, J. T. et al.). Cambridge University Press, en conditions naturelles. Chem. Geol. (Isotope Geo-
Cambridge, UK.
science Section)115, 317–333.
Fan, S.-M., Gloor, M., Mahlman, J., Pacala, S., Sarmi- Bartlett, K. B. and Harriss, R. C. 1993. Review and
ento, J. L., Takahashi, T. and Tans, P. P. 1998. A large assessment of methane emissions from wetlands.
terrestrial sink in North Amercia implied by atmo- Chemosphere26, 261–320. spheric and oceanic carbon dioxide data and models.
Bourg, C. and Ciais, P. 1998.Mesure haute pre´cision par Science282, 442–446.
spectrome´trie de masse des rapports isotopiquesd13C et Farquhar, G. D., Lloyd, J., Taylor, J. A., Flanagan, d18O du dioxide de carbone.DSM-LSCE, CEA Saclay, L. B., Syvertsen, J. B., Hubick, K. T., Wong, S. and Report number CEA-R-5796. Ehleringer, J. R. 1993. Vegetation effects on the isotope Bourg, C. and Ciais, P. 1999.Mesure automatise´e de la composition of oxygen in atmospheric CO
2.Nature concentration en CO
2d’air atmosphe´rique pre´leve´ dans 363, 439–443.
des flacons.DSM-LSCE, CEA Saclay, Report number Flanagan, L. B., Brooks, J. R., Varney, G. T. and
CEA-R-5873. Ehleringer, F. R. 1997. Discrimination against
Bousquet P., Ciais, P., Peylin, P., Ramonet, M. and C18O16O during photosynthesis and the oxygen iso- Monfray, P. 1999. Inverse modelling of annual CO
2 tope ratio of respired CO2in boreal forest ecosystems.
sources and sinks 1. Methods and control inversion. Global Biogeochem. Cycles11, 83–98.
J. Geophys. Res.104, 26,161–26,178. Flessa, H., Do¨rsch, P. and Beese, F. 1995. Seasonal vari- Bouwman, A. F., v.d. Hoek, K. W. and Olivier, J. G. J. ation of N
2O and CH
4fluxes in differently managed 1995. Uncertainties in the global distribution of arable soils in southern Germany.J. Geophys. Res.
nitrous oxide.J. Geophys. Res.100, 2785–2800. 100, 23,115–23,124.
Ciais, P., Denning, A. S., Tans, P. P., Berry, J. A., Randall, Francey, R. J., Steele, L. P., Langenfelds, R. L., Lucarelli, D. A., Collatz, G. J., Sellers, P. J., White, J. W. C., M. P., Allison, C. E., Beardsmore, D. J., Coram, S. A., Trolier, M., Meijer, H. A. J., Francey, R. J., Monfray, Derek, N., de Silva, F., Etheridge, D. M., Fraser, P. J., P. and Heimann, M. 1997. A three-dimensional syn- Henry, R., Turner, B. and Welch, E. D. 1996. Global thesis study ofd18O in atmospheric CO2: 1. Surface Atmospheric Sampling Laboratory (GASLAB): sup- fluxes.J. Geophys. Res.102, 5857–5872. porting and extending the Cape Grim trace gas pro- Christensen, T. R., Prentice, I. C., Kaplan, J., Haxel- grams. InBaseline atmospheric program (Australia) tine, A. and Sitch, S. 1996. Methane flux from northern 1993(eds. R. J. Francey, A. L. Dick and N. Derek).
wetlands and tundra,T ellus48B, 652–661. Bureau of Meteorology and CSIRO Division of Atmospheric Research, Melbourne, Australia, 8–29.
Cuntz, M., Ciais, P. and Hoffmann, G. 2002. Modelling