2019 34
DAS ACHTZEHNTE JAHRHUNDERT UND ÖSTERREICH Jahrbuch der Österreichischen Gesellschaft
zur Erforschung des Achtzehnten Jahrhunderts
What do the words “digital” and “Enlightenment” have in common? A huge semantic shift, within a few decades, from a well-circumscribed concept to a posh and polemical passepartout. In both cases, keeping these words manageable in scholarly discourse requires serious dialogue work and translation efforts between different (and distant) communities of scholars, programmers, and digital
designers. Such a dialogue is more likely to succeed in relatively small settings and with focused arguments—in the case of this issue, the long eighteenth century in Central Europe.
Digital Eighteenth Centur y: Central Eur opean Perspectives T. W AL LN IG , M . R OMB ER G, J . WEI S (ED S.) 20 19
Digital Eighteenth Century:
Central European Perspectives
Achtzehntes Jahrhundert digital:
zentraleuropäische Perspektiven Dix-huitième siècle numérique:
perspectives de l‘Europe centrale
THOMAS WALLNIG
•MARION ROMBERG
•JOËLLE WEIS (EDS.)
230
Trimmed: (230H × 324W) Untrimmed: (240H × 334W) mm
Jahrbuch der Österreichischen Gesellschaft zur
Erforschung des Achtzehnten Jahrhunderts
Band 34
Thomas Wallnig, Marion Romberg, Joëlle Weis (Hg.)
Achtzehntes Jahrhundert digital:
zentraleuropäische Perspektiven Digital Eighteenth Century:
Central European Perspectives Dix-huitième siècle numérique:
perspectives de l’Europe centrale
Unter Mitarbeit von Sandra Hertel
Böhlau Verlag Wien Köln Weimar
Gedruckt mit freundlicher Unterstützung der Historisch-Kulturwissenschaftlichen Fakultät der Universität Wien, des Instituts für Geschichte der Universität Luxemburg, der OeAD-GmbH (aus Mitteln des Bundesministeriums für Europa, Integration und Äußeres) sowie der Stadt Wien.
Bibliografische Information der Deutschen Nationalbibliothek:
Die Deutsche Nationalbibliothek verzeichnet diese Publikation in der Deutschen Nationalbibliografie ; detaillierte bibliografische Daten sind im Internet über http://dnb.d-nb.de abrufbar.
Umschlagabbildung: Johann Samuel Wahl, Elisabeth Christine und Karl VI. beim Hochzeitsmahl Maria Theresias. Digitale Bildbearbeitung (nach einer gemeinfreien Kopie): Joëlle Weis.
© 2019 by Böhlau Verlag Ges.m.b.H & Co. KG, Wien, Kölblgasse 8–10, A-1030 Wien
Dieses Material steht unter der Creative-Commons-Lizenz Namensnennung - Nicht kommerziell - Keine Bearbeitungen 4.0 International. Um eine Kopie dieser Lizenz zu sehen, besuchen Sie http://creativecommons.org/licenses/by-nc-nd/4.0/.
Einbandgestaltung: Michael Haderer, Wien
Vandenhoeck & Ruprecht Verlage | www.vandenhoeck-ruprecht-verlage.com ISBN 978-3-205-20909-6
Contents
Thomas Wallnig
About This Volume ... 7
Articles
Mikkel Munthe Jensen, Marco Quaggiotto, Joëlle Weis
VIA – Virtual Itineraries of Academics – A Digital Exploration
Tool for Early Modern Academic Travels... 13 Marion Romberg
Maps, Timelines, Search Features, and Indices – Digital Tools in
the Continent Allegories Database... 31 Claudia Resch, Dario Kampkaspar
DIGITARIUM – Unlocking the Treasure Trove of 18th-Century
Newspapers for Digital Times ... 49 Per Pippin Aspaas, Katalin Pataki
Did Astronomy Constitute a Denominationally Neutral Space within the Republic of Letters? – An Outline for the Use of
Visualization Tools in the Study of Astronomical Correspondence ... 65 Jonathan Singerton
A Revolution in Ink – Mapping Benjamin Franklin’s Epistolary
Network in the Habsburg Monarchy, 1776–1789 ... 91
Short Papers and Project Presentations
Stefan Ehrenpreis
Big Data and the History of Early Modern Individuals – The Case
of VOC Employees from the Habsburg Territories ... 117 Doris Gruber, Elisabeth Lobenwein, Arno Strohmeyer
Travelogues – Perceptions of the Other 1500–1876.
A Computerized Analysis... 129
Anna Frasca-Rath
Research Landscapes of Digital Art History in Austria ... 133 Karin Schneider, Stephan Kurz
https://maechtekongresse.acdh.oeaw.ac.at/ – Digital Edition of the Documents of the Congresses of Aix-la-Chapelle,
Troppau/Opava, Laibach/Ljubljana and Verona 1818–1822 ... 139 Patrick Fiska
Conference Report: Digitizing Enlightenment III ... 149 Klemens Kaps, Kolja Lichy
Conference Report: The Four Wings of Mercury ... 153
Book Reviews
Olga Katsiardi-Hering / Maria A. Stassinopoulou (Eds.):
Across the Danube. Southeastern Europeans and Their Travelling
Identities (17th–19thc.) (Harald Heppner) ... 169 Marianne Acquarelli: Die Ausbildung der Wundärzte in
Niederösterreich. Unter der Herrschaft der Habsburger vom 18.
bis zum 19. Jahrhundert (Sonia Horn) ... 170 Markwart Herzog / Alois Schmid (Hg.): Katholische Aufklärung
im Benediktinerreichsstift Irsee (Manuela Mayer) ... 175 Karen Green: A History of Women’s Political Thought in Europe,
1700–1800 (Jonathan Singerton) ... 178 Renate Zedinger / Marlies Raffler / Harald Heppner (Hg.):
Habsburger unterwegs. Vom barocken Pomp bis zur smarten
Businesstour (Renate Schreiber)... 181 Buchreihe „Veröffentlichungen zur Bau- und Funktionsgeschichte
der Wiener Hofburg“ (Sandra Hertel) ... 184 Zusammenfassungen und Abstracts ... 191 Autor*innenverzeichnis ... 197
Thomas Wallnig
About This Volume
In recent years, non-native speakers of English in academia have increasingly been seen to begin their texts with the phrase “in recent years”. This is generally done in an attempt to convey an impression of overview as well as of the time- liness of their research: They can point to a scholarly development and present themselves as a part of it. The related notion of academic time is borrowed from the structure of grant proposals, and it substitutes the traditional bipartition (“in the older literature”) with a tripartite model that dynamizes the academic present.
Historians of scholarship in the 23rdcentury may well ponder the relationship between these shifts and the proliferation of academic precarity in the early 21stcentury. In order to grasp nuances of academic development, they will need to selectively look at trigger phrases like “in recent years” and relate them to other parameters. They will most likely be able to do this on the basis of a thoroughly digitized landscape of human legacies in which every single one of our expressions and manifestations will also be documented in the form of machine-readable data; perhaps even our genome.
It is likewise not inconceivable that, by that time, these historians of scho- larship will themselves be computers, because artificial intelligence will have understood the way in which scholars ask questions. The term “digital humani- ties” will designate the part of the digital universe dealing with what has been defined as “human” (unlike digital-born matter), and the design and approval of research projects in the humanities will be handled by specific “programs”.
(We should not worry too much about this, however, because these algorithms will also have learned how to deal with ethical issues.)
But I digress.
In recent years, the ongoing success of quantitative methods in the histori- cal and literary disciplines has found a natural echo in the advancement and popularization of computational methods applied to historical sources. What has emerged is a semantic shift that historians rarely have the opportunity to witness personally and in real time: “Digitization” and “digital methods” have become must-have catchwords, while at the same time they have lost any truly consensual core meaning. (Incidentally, not unlike what happened to the term
“Enlightenment” between 1680 and 1750.)
When terms lose their core meaning, they become vulnerable to biased and polemical usage, and it is true that much of the DH discourse—especially in the field of grant proposals—is made up of “past promises”.1
No-one should therefore expect any further such promise or digitalHurra- patriotismusfrom these editorial lines, nor will I repeat at length what I and many other colleagues have frequently tried to argue and act out in a different context: namely that seriously engaging scholarly and IT communities in struc- tured dialogue is a difficult and trying task of communication and community building.2
This volume aims to be part of this greater endeavor in that it documents a state of the debate without anticipating or prefiguring its outcome in any way (remember the tripartite model of academic time?). Within the well- circumscribed limits of an eighteenth-century society as small as the Aus- trian one, it is relatively easy to showcase digital research related to the (long) eighteenth century, and that is what this book sets out to do—for the Central European community, but also for the context of eighteenth-century research at large.
To be sure, there are models to follow in more than one way (see the report on the “Digitalizing Enlightenment III” meeting), but there is one specific message that I consider particularly relevant for digital novices: digital methods transform existing methods in the humanities. Some of them deal with texts, some with metadata, some with images; some create word clouds, some establish networks. If you are a philologist or a historian, however, this new way of displaying, aggregating, and analyzing data does not absolve you from the obligation of knowing what conceptual history is and what “discourse” really means. (Not to mention the duty to ensure that this knowledge is not forgotten in academia).
If the self-referentiality of asking questions is the one human feature inherent even in digital humanities, then conviviality is the other. Digital humanities—in more than one way—is about meeting people, hanging out, and playing around with data. This is best done over a chilled drink, which is why the Austrian Society has initiated a series of “Digital Days” bringing together digital projects in various academic contexts all over the country.3Situated somewhere between academic speed-dating, first-level support and hackathon, these encounters offer a low-threshold opportunity to find out which wheels donotneed to be reinvented.
1 https://www.univie.ac.at/zeitgeschichte/24-01-interaktionen-mario-wimmer-quellcodes-die- vergangenen-versprechen-der-digital-humanities/, accessed 26.02.2019.
2 https://www.republicofletters.net, accessed 26.02.2019.
3 https://oege18.org/?page_id=1890, accessed 26.02.2019.
About This Volume 9 However, they also offer a vague idea of a bigger picture that may become clearer the further we advance in terms of asking relevant questions—and by
“we”, I mean us researchers, not our algorithms.
What is indeed fundamental about the dialogue between the various DH communities—or “ecosystems”, to use another catchword—is the dialogue it- self. Equally essential is the conceiving of this dialogue as one at eye level.
This also implies the disillusioning insight that priorities between the different groups vary considerably, however: Developers will feel relegated to an ancil- lary role when asked to create simple standard applications that nevertheless fulfil the needs of most scholars. What is more, various tools already exist for most of these needs, and it often seems like more work to obtain a compre- hensive overview of them than to simply create new ones. Scholars, on the other hand, must be aware of and remain alert to the shifting cultural function of knowledge and epistemology, i.e. the interaction between human society and human knowledge (including its most important aspect: questions, i.e. the
“not-known”).
This constellation also implies the sobering insight that the alliance and dialogue between “IT people” and “humanists” remains smooth only as long as they do not touch upon the “ontological essentials” (note for the future annotation machine: “ontological” used in the philosophical, not the IT sense).
For some, a helpful metaphor for this constellation might be Catholicism and Enlightenment; for others it might be XML-TEI and text-as-graph.
In conclusion, it should be clear after what has been said so far that beyond the familiar format of project parading, this volume intends to display the community effort behind the individual projects. In doing so, it hopes to show how DH research can offer new ways of thinking about a region— in this case, Central Europe—in its historical dimension. This is contested knowledge, past and present, and it shows how much of a “human” element there is in DH research.
Articles
Mikkel Munthe Jensen, Marco Quaggiotto, Joëlle Weis
VIA – Virtual Itineraries of Academics
A Digital Exploration Tool for Early Modern Academic Travels
For historians and scholars in the humanities, the new possibilities of the digital world have the potential to substantially enhance their research, especially by creating new perspectives on well-known sources. Within the study of early modern intellectual and cultural exchange, fruitful collaboration between hu- manists, archivists, digital designers and IT experts has led to a variety of new digital projects. Large corpora of letters are being digitized, metadata com- piled, and connections and networks visualized in ways that were completely unthinkable only a few decades ago.
In this particular field of research, the focus of collaborations has primarily been placed on epistolary networks and the available vast collections of letters, as they are vital for the understanding of learned circulation and its transna- tionality.1On the other hand, academic travels and the mobility of scholars have played a lesser role in early modern intellectual studies, figuring mostly as by-products.2In recent years, however, a stronger interest in academic mobility
1 See for example “ePistolarium. Circulation of Knowledge and Learned Practices in the 17th-Century Dutch Republic. A Web-Based Humanities’ Collaboratory on Correspondences”.
This project is a collaboration between the Descartes Centre for the History and Philosophy of the Sciences and the Humanities at the University of Utrecht and the Huygens ING. See http://ckcc.huygens.knaw.nl/epistolarium/. Another project to be mentioned in this context is
“Cultures of Knowledge”, based at the University of Oxford, and its database “Early Modern Letters Online”, a unified catalogue of sixteenth-, seventeenth-, and eighteenth-century cor- respondence. See: http://emlo.bodleian.ox.ac.uk/; all websites mentioned in this paper were accessed 26.02. 2019.
2 There are many tools that allow visualization of geo-temporal data and thus the visualization of travels, and there is much research still ongoing. These tools can generally be divided into three categories: 1) tools for storytelling, such as StoryMap and Neatline; 2) tools that offer only geo-temporal visualization, such as Dariah Geo-Browser; 3) tools that offer wider possibilities and are able to incorporate additional prosopographical data in their visualizations, such as Nodegoat or Palladio. The latter in particular offers various possibilities and allows users to easily upload their own data. Palladio’s map visualization and dynamic filter mechanisms are easy to use, but—especially when combining multiple facet filters—not easy to read and interpret. Scholars in Stanford used Palladio to perform several case studies on mapping correspondence networks, but those studies were not concerned with travels. For the tool, see https://hdlab.stanford.edu/palladio/. For case studies of the project “Mapping the Republic of Letters” see http://republicofletters.stanford.edu/.
has begun to develop among historians working in the interrelated fields of history of science, knowledge and universities—fuelled by the same digital potential observed for epistolary works.3Inspired by these digital projects, the mapping of travels has increasingly been attracting the attention of scholars, cartographers and data designers.4 This paper is a testimony to such an ef- fort, presenting the case study of the digital exploration tool “VIA – Virtual Itineraries of Academics” as the result of a collaboration between scholars of early modern learned history and digital designers. VIA is a tool prototyped specifically for the case of eighteenth-century Nordic academic travels. In its current stage, it is thus a tailor-made response to a specific problem—but as a case study for digital possibilities, VIA is also a demonstration of the potential that structured prosopographical data on academic travels and travellers can provide for the study of early modern intellectual geography in general and the academic mobility of scholars in particular.
In order to structure the argument, this paper is divided into four sections:
The first section elaborates on the specific setting of the project—an interdis- ciplinary story that we hope will serve as an inspiration for other small-scale projects like VIA. The second section focuses on the historical background that gave rise to the initial demand for such a visualization tool. The third and main part introduces the tool itself with its underlying data model, its design and all of its functionalities. The final section presents the initial research results obtained with the help of the tool. In addition, further potential fields of application and future prospects will be discussed.
3 See for example ORBIS, an interactive model that calculates travel costs and travel times for the antique Roman road network, http://orbis.stanford.edu/, or Itinera developed at the University of Pittsburgh to visualize the travels of famous explorers.
4 See for example the hackathon on visualization of travels organized by the DH team of the Uni- versity of Vienna (18–20 July 2018). Details: https://dig-hum.de/aktuelles/open-call-modeling- travels-history-orbis-esque-hackathon-uni-vienna-july-18-20-2018.
VIA – Virtual Itineraries of Academics 15 1. A Brief History of the Project
The story of VIA begins with the COST Action5“Reassembling the Republic of Letters”6, which emerged in response to the expectation that the ongoing revo- lution in digital communication technology would solve a scholarly problem created by the evolution of postal communication in the early modern pe- riod—namely, the problem of piecing back together corpora of manuscript cor- respondence deliberately scattered across and between continents. In essence, the goal of the Action was to assemble a network by creating and designing new digital networking tools. In other words, scholars, archivists, librarians and spe- cialists from a wide range of digital technologies were brought together in order to envisage an open-access, open-source, transnational digital infrastructure capable of facilitating the multilateral collaboration needed to reassemble this scattered documentation and support a new generation of scholarly methods and research questions.
One of the networking tools used by this COST Action was the organization of “Visualization Meetings” that brought together interface/data designers and researchers from the humanities to work on case-study-based explorations into visualizing structured or unstructured data sourced from the Republic of Letters.7One of these meetings conceived to experiment with how information design can contribute to scholarly research was devoted to the design and prototyping of a tool for the exploration of Mikkel Munthe Jensen’s research on academic travels by Nordic university professors during the early modern period.8The researchers approached the project by brainstorming on the most
5 COST is an intergovernmental framework for European Cooperation in Science and Tech- nology, which exists to coordinate nationally funded ongoing research at the European level by providing the networking support needed to ensure that nationally funded initiatives add up to something greater than the sum of their individual parts. COST Actions use a range of networking tools, such as workshops, conferences, training schools, short-term scientific missions (STSMs) and dissemination activities. For more information on the program, see http://www.cost.eu/.
6 COST Action IS1310 “Reassembling the Republic of Letters, 1500–1800” ran from 2014 to 2018. A publication on the results of the Action is planned for 2019. For details, see http://
www.republicofletters.net/.
7 VIA was born out of such a meeting held in Como, Italy in April 2016, coordinated by Paolo Ciuccarelli and Charles van den Heuvel and organized in form of a “Design Sprint”. For more information on this method, see Jake Knapp / John Zeratsky / Brad Kowitz, Sprint: How to Solve Big Problems and Test New Ideas in Just Five Days. London 2016. The minutes of the Como meeting can be found under: http://www.republicofletters.net/wp-content/uploads/
2017/02/Como-Notes-COST-Action-IS1310-Reassembling-the-Republic-of-Letters.pdf.
8 Mikkel Munthe Jensen, From Learned Cosmopolitanism to Scientific Inter-Nationalism:
The Patriotic Transformation of Nordic Academia and Academic Culture during the Long Eighteenth Century, vols. I–II. Diss. Florence 2018.
effective ways to visualize the data; building on this preliminary activity, the need to develop a tool that would allow visual and statistical exploration of the dataset, provide quick ways of filtering the data in regard to their multiple dimensions and simultaneously visualize the correlations between different aspects of the data was formulated.
Finally, it must be underlined that while VIA is the main result of this process, the general insights gained during the interdisciplinary collaboration were equally important and may well serve as inspiration for other digital projects.
The time invested in a mutual learning process—with scholars discovering how to express their needs and designers finding ways to explain how they could contribute—was one of the main factors responsible for the success of the experiment. This is especially important considering that historical data are often fragmented and contain many uncertainties, which is why tailor-made solutions must be developed—a demanding process for all parties that can only be approached by means of close collaboration between members of different fields of expertise.
2. The Republic of Letters and Nordic Academic Travel Culture
As mentioned above, VIA should be considered a result of the networking activities that took place within the framework of the COST Action “Reassem- bling the Republic of Letters”. As the name indicates, the collective concern of the involved researchers was the self-proclaimed imagined community called respublica litterariathat—from circa 1500 to 1800—brought together scholars from all over Europe and beyond.9The members of the Republic of Letters shared a common objective, namely the advancement of knowledge, and consid- ered themselves coequal pursuers of that goal. Shared ideals such as universality and tolerance were the framework of their quest, and the glue that held the community together was a widespread communication network in which letters and mutual services were exchanged on a daily basis. These letters effectively be- came the most important medium for the common task, and this circumstance in turn led to a standardization of communication and the gradual establish- ment of a code of conduct governing the learned exchanges. Ultimately, the
9 Selected references on the Republic of Letters: Hans Bots / Françoise Waquet, La République des lettres. Paris 1997; Marian Füssel / Martin Mulsow (eds.), Die Gelehrtenrepublik. Ham- burg 2015; Anne Goldgar, Impolite Learning: Conduct and Community in the Republic of Letters 1680–1750. New Haven 1995; Lorraine Daston, The Ideal and Reality of the Republic of Letters in the Enlightenment. In: Science in Context, 4 (1992), 367–386; Dirk van Miert, What Was the Republic of Letters? A Brief Introduction to a Long History (1417–2008). In:
Groniek, 204/205 (2016), 269–287.
VIA – Virtual Itineraries of Academics 17 letters—which in many cases are preserved to this day—therefore represent valuable sources providing deep insights into the lives and work of many schol- ars and academics from the early modern period. Anyone examining them more closely soon inevitably recognizes the significance of travels within the erudite culture of the time—not only as a means for exchanging ideas and material directly, but also as a way of broadening and stabilizing one’s own network.
Thus for early modern scholars, academic travelling was always an important aspect of participating in the Republic of Letters. Academic mobility across borders was perceived both as a way of finalising one’s studies and as an in- strument for achieving greater insight within one’s specific field of research. It was a perception that was greatly enhanced by the general change in academic practice during the early modern period from a more sedentary and contem- plative academic practice (vita contemplativa) to a more active scholarly life (vita activa), which valued a more sensuous experience of the world, nature and human society.10Supported by an improving European infrastructure, jour- neys to other universities, libraries, monasteries and other centres of learning facilitated the circulation of knowledge and information. Academic travels and the resulting direct contact between foreign and resident scholars therefore played a significant role in the development of the economy of knowledge and the transfer of ideas and information. Books and manuscripts were copied, translated and transcribed; specimens and artefacts were gathered and indexed;
collections and instruments were bought and sold; and library catalogues were compiled and shared. Travelling not only enlarged the traveller’s world and worldview, it also laid the foundation for interregional and intercultural contact and exchange.11
Naturally, academic mobility was not an entirely new phenomenon in the early modern period—it can easily be traced back to the university foundations during the Middle Ages. Already since the granting of fundamental academic privileges, like theAuthentica Habitaoriginally chartered to the University of Bologna in 1155, the universities had been allowed free academic movement.
In combination with institutional uniformity (the four-faculty system) and a re- ciprocally recognized system of degrees and academic statuses, the European
10 Walter Rüegg, Themes. In: Walter Rüegg (ed.), A History of the University in Europe: Univer- sities in Early Modern Europe. Cambridge 1996, 3–34; Justin Stagl, A History of Curiosity:
The Theory of Travel, 1550–1800. Chur 1995.
11 On travel culture in general, see also Hagen Schulz-Forberg (ed.), Unravelling Civilization:
European Travel and Travel Writing. Brussels – New York 2005; Hans Erich Bödeker, Sehen, hören, sammeln und schreiben. Gelehrte Reisen im Kommunikationssystem der Gelehrtenre- publik. In: Paedagogica Historica 38 (2002), 504–532; Hans-Wolf Jäger, Europäisches Reisen im Zeitalter der Aufklärung. Heidelberg 1992.
universities not only shared a common structure, history and culture, but also constituted a network of sites of learning among which scholars could travel freely.12With his academic citizenship obtained through initial matriculation, every scholar was inaugurated into the pan-European academic community in which his academic rights, privileges and legal status were mutually recognized and protected.13For established scholars and students alike, the European net- work of universities thus provided natural travel destinations with the common aim of obtaining new knowledge, sharing ideas and creating lasting contacts.
In the geographically peripheral Nordic region, academic travels continued to play an important role for the development of the domestic academia.14 Foreign experience and foreign expertise were in high demand when new positions at the universities were to be filled. Foreign professors, especially German ones, were often called upon when certain fields were believed to be in need of bolstering; such was the case with the famousSkytteanskachair at Uppsala University in the seventeenth century or with the chairs of experimental physics and medicine at Copenhagen University during the first two-thirds of the eighteenth century. Likewise, when locally-born scholars applied for positions at the Nordic universities, they often highlighted their academic travels, experience from foreign universities and good reputation in the broader learned republic as their most valuable assets.15The Nordic universities not only valued this foreign experience, they also actively supported it—as can be seen in the many and quite generous scholarships that existed to support the travel activities of the talented but impecunious young scholars.16Throughout the early modern period, academic travels provided a way for Nordic academics to obtain new knowledge from and information about the world abroad as well
12 Paolo Nardi, Relations with Authority. In: Walter Rüegg (ed.), A History of the University in Europe: Universities in Early Modern Europe. Cambridge 1996, 77–107; Aleksander Gieysz- tor, Management and Resources. In: Walter Rüegg (ed.), A History of the University in Europe: Universities in Early Modern Europe. Cambridge 1996, 108–143. On shared academic culture, see also Marian Füssel, Gelehrtenkultur als symbolische Praxis: Rang, Repräsentation und Konflikt an der Universität der Frühen Neuzeit. Darmstadt 2006.
13 Willem Frijhoff, Graduation and Careers. In: Walter Rüegg (ed.), A History of the University in Europe: Universities in Early Modern Europe. Cambridge 1996, 355–385.
14 On Nordic universities and their interconnectedness with the European mainland in terms of structural similarities, recognition of degrees, academic travels and professorial appointments, see Jensen, Cosmopolitanism, see footnote 8.
15 On the importance of foreign travel experience for academic appointments, see Jensen, Cosmopolitanism, see footnote 8, vol. I, 203–205. For the general development in nationality among Nordic professors, see ibid., vol. I, 199–223, vol. II, 78–88. For the specific case of the Skytteanskeprofessors, see ibid., vol. I, 206–211.
16 On academic travel scholarship, see also Vello Helk, Dansk-norske studierejser: 1661–1813.
Odense 1991.
VIA – Virtual Itineraries of Academics 19 as to establish learned connections between domestic scholarly communities and foreign ones.
For modern-day historians of science and learned culture, great potential therefore lies in examining, exploring and understanding the intellectual geog- raphy of these early modern Nordic scholars. To determine where they travelled to would show us where they established connections and with whom they shared knowledge. With additional information about the travellers themselves (and not only about their destinations), this intellectual geography could more- over be substantiated and explored in multiple different ways, which eventually also would lead to a better understanding of the placement of the Nordic aca- demic world within the broader European Republic of Letters. In order to attain such an analytical and explorative level, however, both a substantial and critical amount of data must be collected and structured, and a digital exploration and visualization tool must be developed and designed.
3. VIA: Virtual Itineraries of Academics
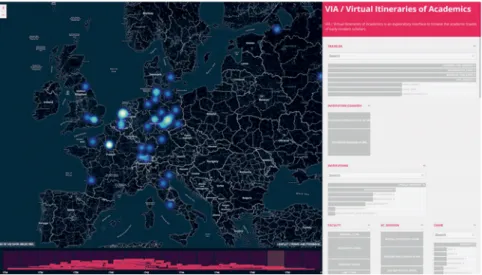
Virtual Itineraries of Academics (VIA)17is a preliminary attempt to create such a digital tool. The main idea behind VIA is to connect and visualize a variety of spatial, temporal and prosopographical data related to academic travels and travellers in such a way that users can easily query the dataset by combining filters pertaining to its various dimensions. The tool’s main advantage lies in its coordinated view, meaning that as soon as one or several of the parameters are selected, all other parameters of the entire dataset are instantly adjusted accordingly.
At first glance, VIA provides the user with an overview of the contents of the dataset in general terms, i.e. with information on the timeframe of the dataset, the geographic boundaries and distribution of journeys, the number of journeys and scholars, and the distribution of the main prosopographical properties.
This allows the user to quickly grasp the geo-temporal context of the dataset and obtain a general understanding of the people involved in terms of their prosopographical attributes (nationality, confession, education, age, etc.). As the user begins to interact with the interface, VIA’s coordinated view provides him or her with the possibility of querying the dataset by combining temporal, geographic and prosopographical filters as well as of exploring its contents in more detail by viewing specific periods of time or geographic regions, or by analysing the travelling behaviour of groups of scholars with common traits.
This allows deeper investigation of the dataset in terms of categories, with
17 VIA is available at: http://knowledgecartography.org/via2/#travels.
the objective of highlighting and exploring possible correlations between the various dimensions of the data. It is possible, for example, to examine whether there are correlations between the age of travellers and the lengths of their journeys, or between the time of trips and their geographic extent. For the more advanced user with good knowledge of the data, VIA can also function as a deeper analytical tool; users can explore the dataset in depth, compare subgroups of scholars and follow their travels in the geographic context, and obtain information about individual journeys and scholars. Moreover, the geographic and temporal contextual information included in the tool also permits expert users to see who else may have been in a specific city at the time of a given visit, what where the main institutions that scholars may have visited, and what major events occurred during a given sojourn.
The technological choices involved in the development of VIA were influ- enced by two main factors. On the one hand, the technology had to allow for easy and fast prototyping (owing to the initial “design sprint” method), while on the other hand it also had to provide easy access for interested researchers and enable future expansion. Based on these constraints, we chose to develop the tool using current web technologies (HTML5, CSS3, ES2017) to support quick prototyping without worrying too much about compatibility with older browsers, which could be addressed later if needed. With regard to data manip- ulation and visualization, the application uses state-of-the-art libraries such as crossfilter.js18for fast multivariate dataset filtering, leaflet.js19for web map and cartographic visualization, and d3.js20for interactive visualizations in the form of widgets. In addition, the tool was developed as a self-hosted client-only web application with no server requirements. The data related to the travels and all contextual information is stored externally as static JSON files. In the event of further development, these static files could be replaced with a dynamic system—be it a database editable from a different application or a system to load local CSV or JSON files.
4. The Dataset: Eighteenth-Century Nordic University Professors
The dataset used by VIA is based on Mikkel Munthe Jensen’s prosopographical database on eighteenth-century Nordic university professors.21This database
18 https://github.com/crossfilter/crossfilter.
19 https://leafletjs.com/.
20 https://d3js.org/.
21 For a more detailed description of the database and its contents, see Jensen, Cosmopolitanism, see footnote 8, vol. II – Appendix, 25–31.
VIA – Virtual Itineraries of Academics 21 contains (semi)structured biographical data on all 592 university professors who held an ordinary or extraordinary chair between 1700 and 1799 at one of the six universities subordinated to one of the two Nordic powers during that time; i.e. the University of Copenhagen in the royal residence city and (partly) the University of Kiel in the German duchy of Holstein, both belong- ing to the Danish monarch, and the Universities of Uppsala, Åbo and Lund within the larger Swedish Kingdom as well as the University of Greifswald in the German principality of Swedish Pomerania, all belonging to the Swedish monarch. On the one hand, these six universities can be examined regionally as belonging to a single region with a common confession, similar political structures and a shared academic culture. On the other hand, they can also be separated following various demarcations such as political divides between the two Nordic powers, cultural divides between German and Scandinavian universities, geopolitical divides between capital (Copenhagen) and provincial universities, national divides between Danish (Copenhagen), Swedish (Upp- sala, Åbo and Lund) and German (Kiel and Greifswald) universities, or simply institutional differences between the individual universities. In other words, this wide range of political and cultural differences and similarities, along with confessional and regional uniformity, has enabled us to develop a digital tool containing substantial comparative and transnational elements.
Among the 592 professors who worked at the six universities, 290 professors undertook a total of 332 academic travels to foreign countries in the period between 1670 and 1790, with only a few exceptions of earlier journeys. Since travels are characterized by the fact that the travelling person frequently changes location within a limited period of time—and the travelling person itself is naturally characterized by a diverse set of biographical attributes—the three fundamental parameters of the dataset are space (geographic locations), time (period of travel), and prosopography (biographical attributes of the traveller).
The spatial component of the 332 travels consists of more than 1,200 registered visits to foreign sites of learning, mainly university cities or capitals, spread across the European continent. The temporal component is captured as periods of years, with a starting year and an ending year for each journey. The prosopo- graphical component consists of 19 different categories containing more than 5,000 pieces of biographical data related to the 290 academic travellers in total.
Together, these three parameters constitute the core data structure of VIA as illustrated below: The 19 prosopographical categories can be divided into per- sonal categories (traveller name, nationality, confession, and age at departure), institutional categories (country, institution name, faculty, scholarly division,22
22 Since the faculty of philosophy as the lower faculty in early modern universities mainly had a foundational function for the three higher faculties, it also encompassed a wide variety of
Fig. 1 Underlying data structure of VIA.
chair, and travel timing [meaning whether the journey took place before or after appointment to professorship]), travel funding categories (funding type and funding name) and academic categories (place of study, doctoral andmagister degrees, and time and place of receipt of those degrees), thus offering a relatively broad description of the respective traveller using the available data. Moreover, each of these 19 categories contains several selectable subcategories that can be combined as desired to enable explorative use of the dataset. If a user finds one specific journey, city or traveller of interest, he or she can simply select the desired item from either the chronological or geographic representation or search for an individual academic traveller using the search option. With the options of combined selection and selection of larger categories such as “natural philosophy” or simply a specific university, users also have the possibility to look for or explore more general trends within the dataset.
The sources behind the entire dataset consist of a combination of biographi- cal sources such as travel diaries, autobiographies and other ego-documents,23 classic biographical literature such as the national biographical encyclopaedias,
disciplines; in effect, everything from ancient languages and metaphysics through rhetoric, history and politics to mathematics, logic and the natural philosophical subjects. In order to provide a more discipline-dependent view, the category of scholarly disciplines was created.
It simply entails a division of the various chairs in the faculty of philosophy across the three higher faculties.
23 Examples of consulted ego-documents: Erik Alstrin, Travel Letters to Johannes Upmarck- Rosenadler 1707–1712, Kungl. Vetenskapsakademien (KVA): Erik Alstrin, Berg. Brevs., An- dreas Christian Hviid, Udtog af en Dagbog holden i Aarene 1777–1780 paa en Reise giennem Tydskland, Italien, Frankerige og Holland. København 1787. More work still needs to be done on such remaining primary sources, since they contain much more additional data beyond what is transferred into biographical literature.
VIA – Virtual Itineraries of Academics 23 nineteenth-century university historical works24, and more recent research literature on Nordic academic travels.25Luckily for us today, embarking on an academic journey during the early modern period was such a momentous and prestigious life event that it practically had to be mentioned in any (auto)bi- ographical piece. Hence, by examining the available biographical literature, we can determine with high certainty who undertook such travels.
Specific travel data such as dates and locations are unfortunately less con- sistently found in both biographical literature and source material, however.
Working with material on early modern scholars on a quantitative (proso- pographical) scale like this, which also includes less well-known and entirely forgotten scholars, often entails the problem of incomplete and fragmented data.
The dataset on eighteenth-century Nordic university professors is no different in this regard. Taking all three parameters into consideration, the prosopo- graphical one is undoubtedly the most complete, as data for the majority of all the categories have been found—with the exception of data on funding.26 Missing and fragmented data concerning the temporal and spatial parameters are encountered much more frequently. Out of the 332 total journeys, 87 are either missing all temporal information, meaning that we have neither a start nor an end date, or are fragmented in the sense that we have only one of the two.
In a similar manner, missing data also characterizes parts of the geographic dataset. While many (auto)biographical entries do list the various cities and
24 Examples of consulted biographical encyclopaedias: Historische Commission bei der königl.
Akademie der Wissenschaften, Allgemeine Deutsche Biographie (ADB), vols. 1–45; Carl Fred- erik Bricka, Dansk biografisk Lexikon, tillige omfattende Norge for Tidsrummet 1537–1814.
København 1887–1905; Åsa Karlsson (ed.), Svenskt biografiskt lexikon (SBL) [Online Database]. Examples of consulted nineteenth-century prosopographies of university profes- sors and other academic members from Lund University, Åbo University and Kiel University:
Magnus Laurentius Ståhl, Biographiske Underrättelser om Professor vid Kongl. Universitetet i Lund, ifrån dess inrättning till närvarande tid. Christianstad 1834; Martin Tegnér Weibull / Elof Tegnér Weibull, Lunds universitets historia 1668–1868, del 2. Lund 1868; Johan Jakob Tengström, Chronologiska förteckningar och anteckningar öfver Finska universitets fordna procancellerer samt öfver faculteternas medlemmar och adjuncter från universitetets stiftelse inemot dess andra sekularår. Helsingfors 1836; Friedrich Volbehr / Richard Weyl, Professoren und Dozenten der Christian-Albrechts-Universität zu Kiel: 1665–1915. Kiel 1916.
25 Example of consulted research literature: Helk, Studierejser, see footnote 16.
26 Data in this field could be improved through studies on the remaining archival material in travel scholarships that can be found in Uppsala and Copenhagen; see for instance Ehler’s, Rosenkrantz’s or King Frederik II’s travel grant, Royal Archive in Copenhagen. Please note that the “no data” fields in the subcategories for the degrees ofmagister philosophiaeand doctor indicate both those travellers who did not hold one of these two degrees (the majority) and those for whom such data could not be found. A clear distinction between the two needs to be made, although actually determining the certainty between such negatives is a difficult exercise.
locations that the traveller visited, others only state that the traveller was travel- ling at all or that he was travelling to certain countries or one or two specific cities, leaving the remainder of the itinerary in the dark.27
These missing and fragmented data naturally pose a representational problem.
Simply excluding the fragmentations or omitting entire travel entries that feature missing and fragmented data would not be a viable solution, as it would lead to significant distortion of the actual picture considering the frequency of such fragmentations. We must accept that missing and fragmented data are a common phenomenon in datasets concerning the early modern period—and instead of excluding such data, we must therefore seek a solution based on design.
In order to develop the visualization tool, the complexity of the data was formalized in a data model with the aim of retaining as much of the original information as possible. While the data model itself is tailor-made for the data describing the travels of eighteenth-century Nordic university professors, the aim—wherever possible—was to keep it open to potential expansions so as to allow the tool to be applied to more general prosopographical explorations and the visualization of datasets with strong geographic and temporal components as well. Based on the abovementioned dataset, the data model includes three main entities and three secondary entities:
Travelsrepresent the individual journeys taken by Nordic scholars and are described by way of reference to the specific traveller as well as by way of temporal extent (start and end year), geographic extent (countries and cities visited) and travel funding. Where the temporal extent is unknown, we have allowed for the possibility of travels with unknown start and/or end dates.
Travellersare described anagraphically (name, nationality, year of birth and death) and in terms of their education (place and date of study; place, date and type of master and doctorate), teaching activity (institution, faculty, scholarly division, chair) and confession.
Locationsrepresent cities that were visited during travels. They are described geographically (latitude and longitude) and in relation to people, institutions and events existing or taking place in the city at a given time.
People, Institutions and Eventsare secondary entities, present only as param- eters related to a city during a time interval.
Because of the fundamental importance attached to journeys, thetravelentity is the main unit of the visualization, with all other measures using “travels” as a unit. For example, the size of a city on the map is proportional to the number of travels that include the city as a destination; the prevalence of a nationality
27 Despite detailed examinations of the remaining ego-documents and institutional source documents such as matriculation registers from across the continent, we nevertheless had to
VIA – Virtual Itineraries of Academics 25 in the visualization is measured in number of travels undertaken by scholars of that nationality, etc. For this reason, as well as due to technical factors related to the filtering mechanisms, the actual data files are denormalized and the information related to thetravellersis associated with the travels themselves, as if the traveller were a property of the travel.
This data model and denormalization allow for fast filtering of travels by avoiding the need to join the travel data and the traveller data during filtering operations; however, this might not always be the most useful choice for re- searchers, and it introduces a unit of measure (number of travels) that might not be intuitive at first glance. Other limitations of the data model are mainly related to the varying precision of the underlying data itself. The overlapping of temporal and spatial uncertainty was explicitly addressed during the design process so as to avoid possibly misleading representations while simultaneously providing access to the available data at the greatest possible level of precision.
Given the overall difficulty of reconstructing travel data accurately, the order of visits is not taken into account in the current data model, and the journey as a whole (not the individual city visit or transfer) is thus taken as the basic unit of description for travel activity. The fact that the order of visits is not explicitly described in the data naturally also propagates to other information related to the relationship between traveller and travels, such as the age of the traveller at the time of his visit to a specific city.
With regard to the temporal uncertainty, travel start and end dates can be marked as missing or uncertain (and can include an estimation of the uncer- tainty span); geographic information can be entered at varying precision levels (in the prototype: city or country). While the existing temporal uncertainty of data is expressed in the temporal view, the representation of geographic uncertainty has not yet been integrated, and country-level visit information is currently not being visualized although its integration has been designed.
5. User Interface and Data Visualization
VIA’s interface focuses first and foremost on the exploration of the dataset by means of a quick and flexible approach allowing the user to filter and manipu- late the dataset and instantly view the results of such manipulation. VIA was therefore designed as a set of coordinated views28, meaning that every element
28 Such an information visualization model is known as linked representations or as multiple and coordinated views. It is a collection of views in which interactions with one visual repre- sentation are immediately reflected in other “linked” representations. This model is commonly used when users need to deal with different data types simultaneously or handle data with
Fig. 2 VIA user interface mockup.
of the interface is simultaneously a view onto the dataset, showing the distri- bution of a particular value throughout it, as well as a filtering device allowing selections in regard to the underlying data to be made. For example, the “In- stitution (name)” widget not only shows how many travels were undertaken by persons from each institution (university), allowing users to see the distri- bution immediately and search for a specific origin, it also allows the data to be filtered in such a way that only travels by scholars of the selected institution are shown across the entire interface. When the user interacts with more than one widget, the displayed results correspond to the intersection of all active filters, thereby providing the possibility of creating customized queries. In other words, once one or more filters are activated, every element of the interface is updated according to the distribution of the filtered values. For example, if the user selects a faculty filter to show only travellers with affiliations e.g. to faculties of philosophy, the “Nationality” view shows the distribution of travels by nationalities limited to travellers affiliated with faculties of philosophy—as do the map, the timeline and all other widgets. This filtering is instantaneous for hundreds or even thousands of travels, and in case of databases featuring millions of records, it can be shifted to the backend for optimal performance.
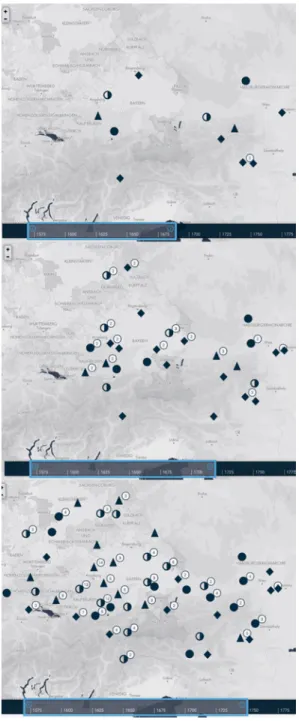
The majority of screen space is devoted to the geography of the travels. The geographic component is represented in a dynamic map showing the locations and relative popularity of visited cities for the selected journeys. The geographic view thus shows the spatial distribution of visits, with a heat-map used at lower zoom levels to show the proportionality of cities or areas and thus offer a better representation of the density of travel visits. When the view is zoomed in to
VIA – Virtual Itineraries of Academics 27 country-level scale, it morphs into a marker-map so as to highlight the indi- vidual visits and allow better comparison of the relative popularity of cities. In both modalities, the area of markers is proportional to the number of (filtered) journeys including a visit to the respective city.
When a city is selected by clicking on it, a window pops up showing infor- mation on the travellers that visited the city together with the list of relevant institutions, people and events in the city during the selected time interval.
Some features designed for the map view have not yet been implemented, e.g.
a display of country-level information about visits or certain geographic filtering functionalities.
The timeline underneath the map shows the temporal information related to the travels. The objective in this case was to display the temporal distribu- tion of journeys so as to highlight patterns in travel dates and other trends in travelling29while simultaneously being able to see the individual journeys and thus compare their lengths. To provide simultaneous access to aggregate measures (total travels during a given year) and individual journeys, a cus- tom visualization was designed for VIA that shows the spans of every single travel in a compact form while also stacking them such that the height of the stack is representative of the total number of travels active during the given year. This method fundamentally merges the properties of aGantt chart30and a histogram into a single compact timeline visualization. Being able to see the individual journeys and not just some form of aggregate measure makes it possible to not only visually comprehend the length of each journey, but also allows two different forms of interaction with the visualization: On the one hand, users can define a time span in order to filter the data, and on the other they can select an individual journey to obtain additional information. With regard to incomplete information and uncertain dates, the temporal visualiza- tion uses a transparency gradient to “fade” the travel span and thus symbolize the uncertainty related to start or end dates. Beside the travels, the timeline is also planned to eventually display certain contextual markers for important historical events in an enhanced version of the tool as well as allowing data
29 The timeline demonstrates the travel trends among the total number of travels, which should not be confused with travel popularity among academics. Travel trends refer to the devel- opment of the total number of travels, whereas travel popularity would require comparison with the development of the total number of academics (including non-travelling academics) during the same period. Since the total number of academics at the universities almost doubled during the eighteenth century, the overall popularity of academic travel actually decreased during the same period. For more on the development of academic travel popularity, see Jensen, Cosmopolitanism, see footnote 8, vol. I, 249–273.
30 A Gantt chart is a temporal bar chart used primarily for the display of project schedules. Clark Wallace, The Gantt Chart: A Working Tool of Management. New York 1922.
Fig. 3 Detail of a selection of the timeline as shown in the user interface.
brushing or animation functionalities to explore the temporal evolution of the underlying phenomena.
The third dimension of the data, i.e. the prosopographical attributes of the scholars and travels, are located to the right of the map in a scrolling side- bar designed to host the widgets related to the many attributes. The filtering functionality in this section is based on three different types of visualizations depending on the nature of the respective data: histograms for continuous numerical data, stacked bar graphs for categorical properties with few values (where the interest is mostly in the relative values), and bar charts for other categorical properties. While a selection of multiple values for a given property is possible in principle, the current interface allows only for the selection of adjacent values. A different selection mechanism supporting the selection of non-adjacent values has already been designed, but has yet to be implemented.
6. Initial Results and Further Possibilities
In the context of the initial case study, using VIA even in its current early development stage has made it possible to support, substantiate and challenge claims made in regard to Nordic academia during the eighteenth century and its placement and participation in the European learned world. Moreover, VIA’s explorative features have also highlighted the potential of exploratory data analysis for provoking new research questions: What was previously unclear,
VIA – Virtual Itineraries of Academics 29 expected to be unimportant or not thought of at all can easily be tested thanks to the instantaneous adjustment of all categories.
By viewing the entire dataset, users can see that the intellectual geography of the Nordic academics was very much limited to Protestant north-western Europe, with epicentres around the newly reformed universities in Saxony and Prussia, the Dutch universities and the European scientific and cultural hotspots of Paris and London. On the one hand, this confirms the general notion of Scandinavian learned connections to German and, to a lesser degree, Dutch and London-Paris academia, but on the other hand it certainly also demonstrates the limitations of the general geo-academic reach of eighteenth- century Scandinavian academics. Whereas previous studies (often on individual scholars) have confirmed where scholars travelled to, it is a much more difficult task to convincingly demonstrate where they didnotjourney to. From the point of view of the Nordic academic traveller, Eastern Europe, northern Great Britain and the Iberian Peninsula were all blank areas on the map. This naturally leads to the following questions: Why did Nordic travellers prefer some places over others? What were the reasons for Nordic travellers visiting German universities and places of knowledge, but not Spanish or Scottish ones? Was it only a matter of confessional differences? Clearly not, since the Catholic universities on the Apennine peninsula also attracted a fair number of visits from other regions.
Simply by visualizing all the travel destinations of Nordic scholars, we can begin asking new questions.31
Moreover, when we begin to break up this generalized view through the explorative features of VIA, further questions arise and new insights are ob- tained—for example the obvious differences in travel practices between aca- demics from the four Scandinavian and two German universities. Compared with their peripheral Scandinavian peers—who during the first half of the eigh- teenth century were aware of and even stressed the need for foreign expertise and knowledge—it seems that the German academics had a lesser need for travel to foreign countries, as they were already tied culturally and intellectually to a dominant academic world. Another example is the importance that Dutch universities and Paris played for later Nordic professors of medicine, or the noticeable decline of the Dutch universities as a travel destination throughout the eighteenth century, which is not necessarily linked to a decline in quality at these universities, but more likely to an increase in quality at the domestic universities back home. A final example, of course, is the obvious attraction that the newly reformed universities in Halle, Jena, Leipzig, Wittenberg and (in part) Göttingen held for academics interested in the disciplines of law, theology and oriental languages, which seems to confirm the impact that the new thoughts
31 For a more detailed examination of the Nordic academics’ travel patterns, see Jensen, Cos-
and ideas of intellectual pioneers like Christian Thomasius, Christian Wolff and August Franke had on Scandinavian and Northern German scholars.
Initial results like these, together with the tool’s tested capacity for visualiza- tion and exploration, suggest that a digital tool like VIA—despite still being in a work-in-progress stage—provides additional value to the work of historians in the digital age: Claims can be substantiated, past statements can be challenged or corroborated, and new research questions can be developed. The completion of such a proof of concept, however, also implies further development and potentially also further possibilities.
In the same way we began the development of VIA by asking the question
“what would an ideal tool look like?”, we intend to finish the first phase of our work by asking the same question. We believe that digital tools like VIA hold great potential to help in formulating and answering research questions, and the possibilities for further development are manifold. As of now, the project has produced a promising proof of concept that needs to be developed further and finalized for internal project use, but could also be expanded to public use.
These are obviously two very different goals: While the former has well-known data sets and a formulated use in mind, the latter features more unclear usage scenarios and—most importantly—also requires the possibility for public users to upload their own projects and data sets. Alternatively, a curator would be needed.
With regard to the prototype and its specific use cases (besides the planned improvements listed in this paper), one key to enhancements would be the quantity and variety of the data provided. A possible feature that comes to mind would be additional data on travel funding, which would enable the tracking of changes concerning funding for individual disciplines and facilitate analysis of possible correlations between scholarships and travel destinations. Expanding in a different direction, the tool could be furnished with additional views, for example a “network” view that would reveal the relations between travellers or travels (e.g. co-presence networks), thereby offering new insights into the nature of the data. In regard to a more general public version, one might think of integrating VIA with other prosopographical databases like Early Modern Letters Online (EMLO) and other data samples provided by researchers. In this case, VIA could be extended to deal not only with academic travel data but all sorts of other prosopographical data on early modern academics and scholars as well. Such continued development is not unachievable, but would naturally require some rethinking in terms of design and use.
Ultimately, VIA could become a tool that goes beyond individual research data and would thus help researchers compare and connect their findings. By doing so, it would enable today’s scholars to reconstruct the paths of their predecessors, see who and where they potentially met, and thus contribute to overcoming a major restriction imposed by the absence of direct transmission.
Marion Romberg
Maps, Timelines, Search Features, and Indices
Digital Tools in the Continent Allegories Database
Independent of the actual research question, the presentation, interpretation, and appreciation of historical contexts constitute the basic craft of any historical work—be it in history, art history, social history, or archaeology. For these pursuits, we use a great variety of sources and methods. The latter term refers not only to theoretical analysis models and concepts, however, but also quite specifically to questions of the organization of research, the dissemination of research results, the comprehensibility of data and, ultimately, its reusability in different contexts. Digital methods and formats are increasingly being used for the analysis and/or presentation and dissemination of results.
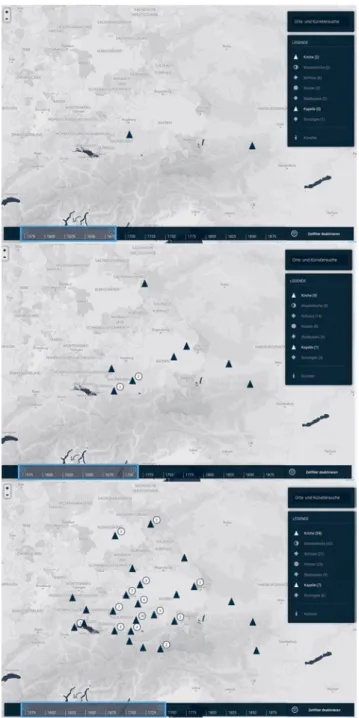
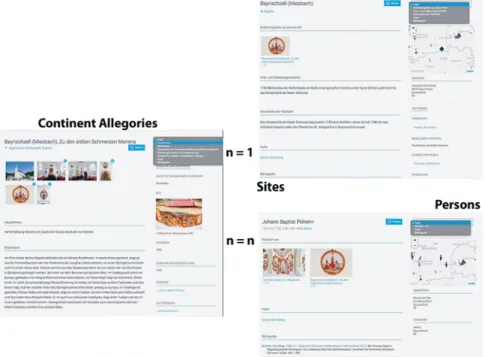
In 2012, a research team began work on a project whose primary objective was to shed light on a phenomenon specific to a historically defined region reaching from the rivers Moselle and Main (up to the city of Fulda) in the north across the mountain ridge of the Erzgebirge at the foot of the Trzebnickie Hills above Wrocław to the present borders of the Republic of Austria as well as South Tyrol in the south, extending to the former border of the Holy Roman Empire in the east and to the Rhine in the west. The research was focused on the iconography of the four continents as it appeared in the media of frescos, stucco, sculpture etc., reaching its peak on the walls and ceilings of Southern German rural churches and chapels around the middle of the 18thcentury. The first objective was to conduct a systematic survey of bibliographical research, site visits and photographic documentation.1The second objective was to create not just a large data pool, but to develop an interactive database with various means of accessing the data (maps, timeline, grids). The project and database were funded by the Austrian Science Fund (FWF), and the work spanned the years 2012 to 2016.
1 Research on parish churches of the Baroque period has been neglected by art historians and historians so far. Cf. Peter Hersche, Die soziale und materielle Basis des „gewöhnlichen barocken Sakralbaus“. In: Frühneuzeit-Info, 6 (1995), 2, 151–171; Marion Romberg, Die Welt im Dienst des Glaubens. Erdteilallegorien in Dorfkirchen auf dem Gebiet des Fürstbistums Augsburg im 18. Jahrhundert, Stuttgart 2017, 89–92. Recently, this topic has been met with renewed interest; see the forthcoming conference proceedings Martin Mádl / Herbert Karner (ed.),Die barocken Pfarrkirchen und ihre Dekoration. Prague: Artefactum 2019.
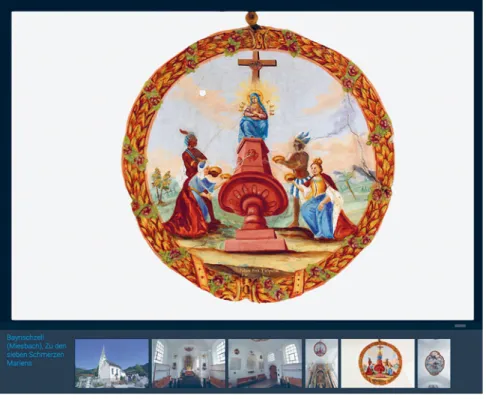
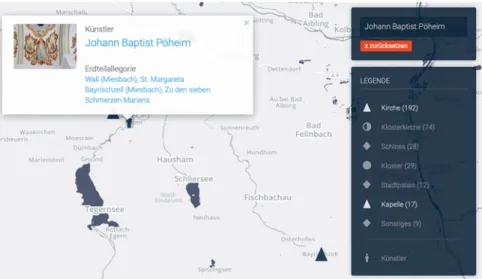
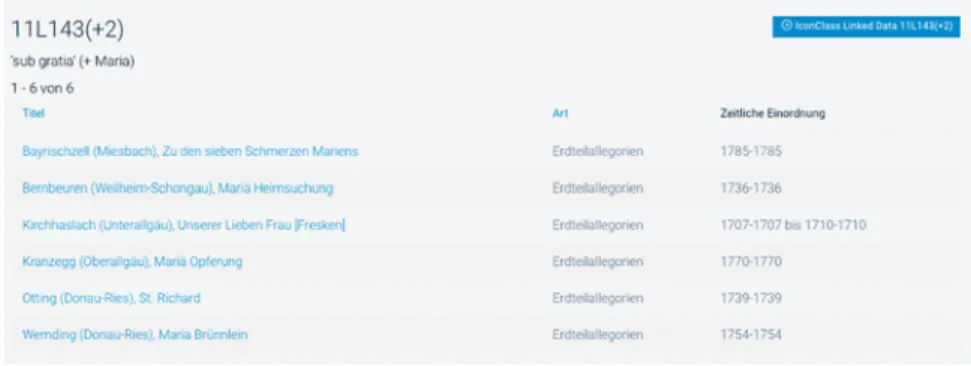
In the following paper, I will focus on a particular instance of these continent allegories with the aim of providing an example of how to use the database for research.2This narrative strand will be interspersed with technical explanations of tools integrated into the database; these insertions are set initalics.
1. Basics: Gathering Data and Developing the Database
The project team made up of historians and art historians approached its subject in a new and systematic manner. Firstly, we selected a clearly defined geographic area consisting of the greater part of the Southern Holy Roman Empire and featuring a large concentration of Baroque sites. Secondly, we decided to fo- cus on continent allegories in immovable media, i.e. those installed as frescos, stucco work, paintings, and sculptures within abbeys, palaces, parks, gardens, townhouses, and—most importantly—churches.3Portable artifacts like faience objects, book illustrations, maps, atlases, prints, or terracotta figurines were not included in the research corpus for the sake of homogeneity. Few such mov- able artifacts have remained in their original location respectively within the contexts for which they were intended, and their provenance is often difficult or impossible to reconstruct. In this they differ significantly from allegories of the four continents on immovable media, for which we are mostly able to reconstruct the social and cultural contexts in which they originated as well as the spatial and functional conditions prevailing when they were conceived, viewed, interpreted, and understood. Thirdly, the time frame for our investi- gation extended from the late sixteenth to the mid-nineteenth century, with the mid-eighteenth century forming the key period.4The survey conducted by the project team identified over 400 relevant instances of continent allegories within the study area. A database was subsequently developed to facilitate the systematic and detailed analysis of all identified instances, and it is now available to the public at http://continentallegories.univie.ac.at.
2 Further examples can be found in the conference proceedings: Wolfgang Schmale / Marion Romberg / Josef Köstlbauer (eds.), The Language of Continent Allegories in Baroque Central Europe. Vienna 2016 as well as in the journal article by Marion Romberg, Continent Allegories in the Baroque Age – A Database. In: Journal18. Issue #5: Digital Mapping & Eighteenth- Century Visual, Material, and Built Cultures, Spring 2018 (http://www.journal18.org). This essay draws in part on the two mentioned publications.
3 Only objects remaining in their original locations were included.
4 Cf. Marion Romberg, Data based analysis of the continent-allegories in Southern Germany with special focus on the prince bishopric of Augsburg. In: Schmale / Romberg / Köstlbauer, Language, see footnote 2, 87–106.