For every child
Health, Education, Equality, Protection ADVANCE HUMANITY
An overview of child well-being in rich countries
A comprehensive assessment of the lives and well-being of children and adolescents in the economically advanced nations
Report Card 7
Child poverty in perspective:
Cards, designed to monitor and compare the performance of the OECD countries in securing the rights of their children.
Any part of the Innocenti Report Card may be freely reproduced using the following reference:
UNICEF, Child poverty in perspective:
An overview of child well-being in rich countries, Innocenti Report Card 7, 2007
UNICEF Innocenti Research Centre, Florence.
© The United Nations Children’s Fund, 2007
Full text and supporting documentation can be downloaded from the UNICEF Innocenti Research Centre website.
The support of the German Committee for UNICEF in the development of Report Card 7 is gratefully acknowledged.
Additional support was provided by the Swiss Committee for UNICEF.
The UNICEF Innocenti Research Centre in Florence, Italy, was established in 1988 to strengthen the research capability of the United Nations Children’s Fund (UNICEF) and to support its advocacy for children worldwide.
The Centre (formally known as the International Child Development Centre) generates research into current and future areas of UNICEF’s work. Its prime objectives are to improve international understanding of issues relating to children’s rights and to help facilitate the full implementation of the United Nations Convention on the Rights of the Child in both industrialized and developing countries.
The Centre’s publications are contributions to a global debate on child rights issues and include a wide range of opinions.
For that reason, the Centre may produce publications that do not necessarily reflect UNICEF policies or approaches on some topics.
The views expressed are those of the authors and do not necessarily reflect the policy or views of UNICEF.
UNICEF Innocenti Research Centre Piazza SS. Annunziata, 12
50122 Florence, Italy
Tel: (+39) 055 20 330
Fax: (+39) 055 2033 220
florence@unicef.org
www.unicef.org/irc
UNICEF
Innocenti Research Centre
The true measure of a nation’s standing is how well it attends to its children – their health and safety, their material security, their education and socialization, and
their sense of being loved, valued, and included in the families and societies into which they are born.
Report Card 7
The chart below presents the findings of this Report Card in summary form. Countries are listed in order of their average rank for the six dimensions of child well-being that have been assessed.
1A light blue background indicates a place in the top third of the table; mid-blue denotes the middle third and dark blue the bottom third.
Dimension 1 Dimension 2 Dimension 3 Dimension 4 Dimension 5 Dimension 6
Dimensions of
child well-being Average ranking position (for all 6 dimensions)
Material
well-being Health and
safety Educational
well-being Family and peer relationships
Behaviours
and risks Subjective well-being
Netherlands 4.2 10 2 6 3 3 1
Sweden 5.0 1 1 5 15 1 7
Denmark 7.2 4 4 8 9 6 12
Finland 7.5 3 3 4 17 7 11
Spain 8.0 12 6 15 8 5 2
Switzerland 8.3 5 9 14 4 12 6
Norway 8.7 2 8 11 10 13 8
Italy 10.0 14 5 20 1 10 10
Ireland 10.2 19 19 7 7 4 5
Belgium 10.7 7 16 1 5 19 16
Germany 11.2 13 11 10 13 11 9
Canada 11.8 6 13 2 18 17 15
Greece 11.8 15 18 16 11 8 3
Poland 12.3 21 15 3 14 2 19
Czech Republic 12.5 11 10 9 19 9 17
France 13.0 9 7 18 12 14 18
Portugal 13.7 16 14 21 2 15 14
Austria 13.8 8 20 19 16 16 4
Hungary 14.5 20 17 13 6 18 13
United States 18.0 17 21 12 20 20 –
United Kingdom 18.2 18 12 17 21 21 20
This Report Card provides a comprehensive assessment of the lives and well-being of children and young people in 21 nations of the industrialized world. Its purpose is to encourage monitoring, to permit comparison, and to stimulate the discussion and development of policies to improve children’s lives.
The report represents a significant advance on previous titles in this series which have used income poverty as a proxy measure for overall child well-being in the OECD countries. Specifically, it attempts to measure and compare
child well-being under six different headings or dimensions:
material well-being, health and safety, education, peer and family relationships, behaviours and risks, and young people’s own subjective sense of well-being. In all, it draws upon 40 separate indicators relevant to children’s lives and children’s rights (see pages 42 to 45).
Although heavily dependent on the available data, this assessment is also guided by a concept of child well-being that is in turn guided by the United Nations Convention on the Rights of the Child (See box page 40). The implied
C H I l D w E l l - B E I N G I N R I C H C o U N T R I E S : A S U M M A R y T A B l E
oECD countries with insufficient data to be included in the overview: Australia, Iceland, Japan, luxembourg, Mexico, New Zealand,
the Slovak Republic, South Korea, Turkey.
definition of child well-being that permeates the report is one that will also correspond to the views and the experience of a wide public.
Each chapter of the report begins by setting out as transparently as possible the methods by which these dimensions have been assessed.
Main findings
The Netherlands heads the table of overall child well- being, ranking in the top 10 for all six dimensions of child well-being covered by this report.
European countries dominate the top half of the overall league table, with Northern European countries claiming the top four places.
All countries have weaknesses that need to be addressed and no country features in the top third of the rankings for all six dimensions of child well-being (though the Netherlands and Sweden come close to doing so).
The United Kingdom and the United States find themselves in the bottom third of the rankings for five of the six dimensions reviewed.
No single dimension of well-being stands as a reliable proxy for child well-being as a whole and several OECD countries find themselves with widely differing rankings for different dimensions of child well-being.
There is no obvious relationship between levels of child well-being and GDP per capita. The Czech Republic, for example, achieves a higher overall rank for child well-being than several much wealthier countries including France, Austria, the United States and the United Kingdom.
Measurement and policy
What is to be gained by measuring and comparing child well-being in different countries?
The answer lies in the maxim ‘to improve something, first measure it’.Even the decision to measure helps set directions and priorities by demanding a degree of consensus on what is to be measured – i.e. on what constitutes progress. Over the long-term, measurement
serves as the handrail of policy, keeping efforts on track towards goals, encouraging sustained attention, giving early warning of failure or success, fuelling advocacy, sharpening accountability, and helping to allocate resources more effectively.
Internationally, measurement and comparison gives an indication of each country’s strengths and weaknesses. It shows what is achievable in practice and provides both government and civil society with the information to argue for and work towards the fulfilment of children’s rights and the improvement of their lives. Above all, such comparisons demonstrate that given levels of child well-being are not inevitable but policy-susceptible; the wide differences in child well-being seen throughout this Report Card can therefore be interpreted as a broad and realistic guide to the potential for improvement in all OECD countries.
Given the potential value of this exercise, every attempt has been made to overcome data limitations. Nonetheless, it is acknowledged throughout that the available data may be less than ideal and that there are prominent gaps. Children’s exposure to violence in the home both as victims and as witnesses,
2for example, could not be included because of problems of cross-national definition and measurement.
Children’s mental health and emotional well-being may also be under-represented, though attempts have been made to reflect these difficult-to-measure dimensions (see, for example, the results of surveys into children’s own
perceptions of their own lives on pages 34 and 38). Age and gender differences are also insufficiently attended to, again reflecting a lack of disaggregated data and the fact that the majority of the available statistics relate to the lives of older children. A particularly important omission is the level of participation by three and four year-olds in early childhood education (for which, again, no internationally comparable data are available).
Acknowledging these limitations, Report Card 7 nonetheless invites debate and breaks new ground by bringing together the best of currently available data and represents a significant step towards a multi-dimensional overview of the state of childhood in a majority of the economically advanced nations of the world.
C H I l D w E l l - B E I N G I N R I C H C o U N T R I E S :
A S U M M A R y T A B l E
M A T E R I A l w E l l - B E I N G
Dimension 1
Figure 1.0 The material well-being of children, an OECD overview
Three components were selected to represent children's material well-being (see box below).
Figure 1.0 averages each country’s score over the three components and is scaled to show each country’s distance above or below the average (set at 100) for the 21 countries featured.
80 85 90 95 100 105 110 115 120
Poland Hungary Ireland United Kingdom United States Portugal Japan Greece New Zealand Italy Germany Australia Spain Czech Republic Netherlands France Austria Belgium Canada Switzerland Denmark Finland Norway Sweden
CoMPoNENTS INDICAToRS relative income
poverty
– percentage of children living in homes with equivalent incomes below 50% of the national median
households without jobs
– percentage of children in families without an employed adult
reported deprivation
– percentage of children reporting low family affluence
– percentage of children reporting few educational resources – percentage of children reporting
fewer than 10 books in the home
Assessing material well-being
The table on the right shows how the index of children’s material well-being has been constructed.
The choice of individual indicators reflects the availability of internationally comparable data.
For each indicator, countries have been given a score which reveals how far that country stands above or below the OECD average. Where more than one indicator has been used, scores have been averaged.
In the same way, the three component scores have been averaged to arrive at each country’s overall rating for children’s material well-being (see box on
page 5). Material well-being
Note: Each country has been placed on a scale determined by the average score for the group as a whole. The unit used is the standard deviation (the average deviation from the average). To ease interpretation, the results are presented on a scale with a mean of 100 and a standard deviation of 10.
This overview of child well-being looks first at material well-being.
Three different components have been considered – relative income poverty, children in households without an employed adult, and direct measures of deprivation. Figure 1.0 (opposite) brings these three components into one overall ranking table of child material well-being.
Main findings
The lowest rates of relative income poverty (under 5%) have been achieved in the four Nordic countries.
A total of nine countries – all in northern Europe – have brought child poverty rates below 10%.
Child poverty remains above the 15% mark in the three Southern European countries (Portugal, Spain, Italy) and in three anglophone countries (the United States, the United Kingdom, and Ireland).
The Czech Republic ranks above several of the world’s wealthiest countries including Germany, Italy, Japan, the United States and the United Kingdom.
Ireland, despite the strong economic growth of the 1990s and sustained anti-poverty efforts, is placed 22nd out of the 25 countries.
Income Poverty
Two previous issues of the Report Card have been devoted to child income poverty in the OECD countries (see Box 7).
The evidence from many countries persistently shows that children who grow up in poverty are more vulnerable: specifically, they are more likely to be in poor health, to have learning and behavioural difficulties, to underachieve at school, to become pregnant at too early an age, to have lower skills and aspirations, to be low paid, unemployed, and welfare dependent. Such a catalogue of poverty’s ills runs the risk of failing to respect the fact that many children of low-income families do not fall into any of these categories. But it does not alter the fact that, on average, children who grow up in poverty are likely to be at a decided and demonstrable disadvantage.
Ideally child poverty would be assessed by bringing together data under a variety of poverty headings including relative poverty, absolute deprivation, and depth of poverty (revealing not only how many fall below poverty lines but also by how far and for how long). Nonetheless, the ‘poverty measure’ used here represents a more comprehensive view of child poverty than has previously been available.
Relative income poverty
Child poverty can be measured in an absolute sense – the lack of some fixed minimum package of goods and services. Or it can be measured in a relative sense – falling behind, by
Children’s material well-being
Dimension 1 Material well-being
Throughout this Report Card, a country’s overall score for each dimension of child well-being has been calculated by averaging its score for the three components chosen to represent that dimension.
If more than one indicator has been used to assess a component, indicator scores have been averaged. This gives an equal weighting to the components that make up each dimension, and to the indicators that make up each component. Equal weighting is the standard approach used in the absence of any compelling reason to apply different weightings and is not intended to imply that all elements used are considered of equal significance.
In all cases, scores have been calculated by the ‘z scores’ method – i.e. by using a common scale whose upper and lower limits are defined by all the countries in the group. The advantage of this method is that it reveals how far a country falls above or below the average for the group as a whole. The unit of measurement used on this scale is the standard deviation (the average deviation from the average). In other words a score of +1.5 means that a country’s score is 1.5 times the average deviation from the average. To ease interpretation, the scores for each dimension are presented on a scale with a mean of 100 and a standard deviation of 10.
A common scale
more than a certain degree, from the average standard of living of the society in which one lives.
The European Union offered its definition of poverty in 1984: “the poor are those whose resources (material, cultural, and social) are so limited as to exclude them from the minimum acceptable way of life in the Member States in which they live”. For practical and statistical purposes, this has usually meant drawing national poverty lines at a certain percentage of national median income.
Figure 1.1 shows the percentage of children growing up in relative poverty – defined as living in a household where the equivalent income is less than 50% of the national median – for 24 OECD countries.
3Critics have argued that relative poverty is not ‘real’ poverty, pointing out that many of those who fall below relative poverty lines enjoy a standard of living higher than at any time in the past or than most of the world’s children in the present. But this fails to acknowledge that in today’s OECD nations the cutting edge of poverty is the contrast, daily perceived, between the lives of the poor and the lives of those around them.
Nonetheless an international comparison based on a poverty line drawn at 50% of the median national income presents only a partial picture in that it makes no allowance for differences in national wealth. It shows, for example, that the child poverty rate in the United States is higher than in Hungary, but fails to show that 50% of median income (for a couple with two children) is approximately $7,000 in Hungary and
$24,000 in the United States. The fact that a smaller percentage of children are growing up poor in the Czech Figure 1.1 Relative income poverty: Percentage of children (0-17 years) in
households with equivalent income less than 50% of the median.
0 5 10 15 20 25
Date: 2000,1999 (Australia, Austria and Greece), 2001 (Germany, New Zealand and Switzerland).
United States United Kingdom Italy Ireland Spain Portugal New Zealand Poland Japan Canada Austria Hungary Greece Australia Germany Netherlands France Czech Republic Switzerland Belgium Sweden Norway Finland Denmark OECD Nations
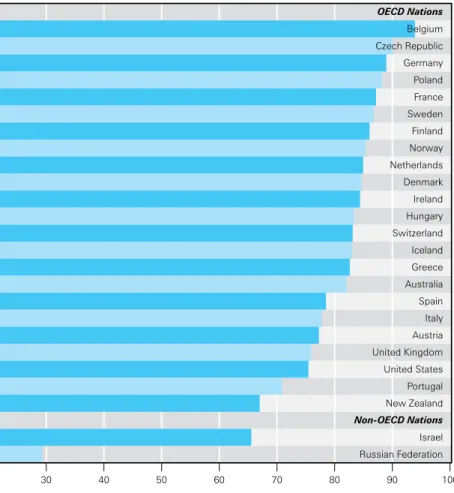
Figure 1.2 Percentage of working-age households with children without an employed parent
Date: 2000, 1999 (Japan and Canada), 1998 (Switzerland), 2001 (Spain, the Netherlands, and Germany), 2002 (Austria, Norway and Poland).
Non-OECD, 2004 (Israel).
0 2 4 6 8 10 12
Israel Hungary Australia Poland Germany United Kingdom Czech Republic New Zealand Ireland France Netherlands Norway Spain Denmark Belgium Italy Finland Canada Sweden Greece United States Austria Switzerland Portugal Japan OECD Nations
Non-OECD Nations
Dimension 1 Material well-being
Republic than in France, or in Poland than in Italy, does not mean that Czech or Polish children are more affluent but that their countries have a more equal distribution of income. In other words Figure 1.1 tells us much about inequality and exclusion but little about absolute material deprivation.
Even within individual countries, relative income poverty does not reveal how far families fall below poverty lines, or for how long.
Furthermore all such measurements of child poverty are based on household income and assume a well-
functioning family in which available resources are allocated with reasonable fairness – with necessities taking priority over luxuries. A child suffering acute material deprivation caused by a parent's alcohol or drug habit, for example, is not counted as poor if the family income is greater than 50% of the national median.
Relative poverty is therefore a necessary but not sufficient indicator of children’s material well-being, and needs to be complemented by some measure of deprivation.
Unemployment
Various studies have found that growing up in a household without an employed adult is closely associated with deprivation, particularly if the unemployment is persistent. The proportion of children who are growing up in households with no employed adult has therefore been chosen as the second component for building a more rounded picture of children’s material poverty.
Figure 1.2 is clearly measuring a different aspect of poverty. The United States, for example, has risen from the bottom of Figure 1.1 to fifth place in Figure 1.2, while Norway has fallen
Report Card 1 (2000) and Report Card 6 (2005) addressed the issue of child income poverty in the OECD countries. Some of the main findings:
In recent years, child poverty has risen in 17 out of 2 OECD countries for which data are available.
Norway is the only OECD country where child poverty can be described as very low and continuing to fall.
Higher government spending on family and social benefits is
associated with lower child poverty rates. No OECD country devoting 10% or more of GDP to social transfers has a child poverty rate higher than 10%. No country devoting less than 5% of GDP to social transfers has a child poverty rate of less than 15%.
Variation in government policy appears to account for most of the variation in child poverty levels between OECD countries.
There appears to be little relationship between levels of employment and levels of child poverty. It is the distribution of employment among different kinds of household, the proportion of those in work who are on low-pay, and the level of state benefits for the unemployed and the low-paid, that contribute most to differences in child poverty rates between countries.
Variations between countries in the proportion of children growing up in lone-parent families do not explain national poverty rates. Sweden, for example, has a higher proportion of its children living in lone- parent families than the United States or the United Kingdom but a much lower child poverty rate than either.
There is considerable variation in child poverty rates even in countries with broadly similar levels of government spending.
A realistic target for all OECD countries would be to bring relative child poverty rates below 10%. For the countries that have already achieved this, the next aim might be to emulate the four Nordic countries in bringing child poverty rates below 5%.
In many OECD countries there is a pronounced trend towards lower relative earnings for the lowest paid.
There is a trend for any increase in social spending in OECD countries to be allocated principally to pensions and health care, leaving little for further investment in children.
From previous Report Cards
from third to fourteenth place. Such changes could reflect low pay for employed adults in some countries and generous benefits for unemployed adults in others. Either way, it adds to the picture of child poverty. But what is lacking is some more direct measure of children’s material deprivation.
Deprivation
Unfortunately, there are no
internationally comparable measures of material deprivation or agreed definitions of what ‘the right to an adequate standard of living’ means. It is therefore not possible to compare the proportion of children in each country who are materially deprived in the sense that they lack such basics as adequate nutrition, clothing, and housing. Again, individual governments may have indicators reflecting this kind of deprivation at national level but, in the absence of cross-national definitions and data, three indicators have been selected which, taken together, may offer a reasonable guide (Figures 1.3a, 1.3b, and 1.3c).
Date: 2001/02
0 10 20 30 40 50 60 70
Russian Federation Latvia Lithuania Croatia Malta Estonia Israel Slovenia Poland Czech Republic Hungary Portugal Greece Spain Ireland Finland Belgium Austria Germany France United Kingdom Denmark United States Switzerland Canada Sweden Netherlands Norway OECD Nations
Non-OECD Nations
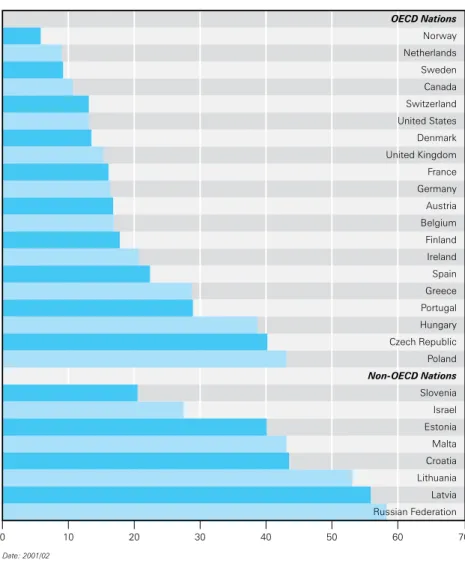
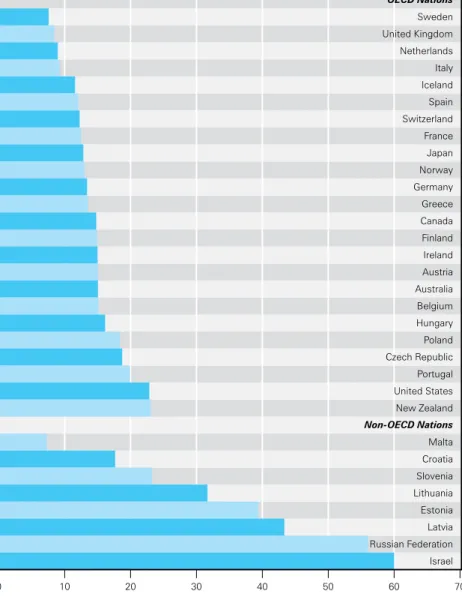
Figure 1.3a Percentage of children age 11, 13 and 15 reporting low family affluence
In recent years, relative child poverty has become a key indicator for the governments of many OECD countries. The European Union’s efforts to monitor its Social Inclusion Programme, for example, include relative child poverty and the percentage of children in workless families as the only indicators specifically related to children (drawing the poverty line as the proportion of children in each country living in households with an equivalent income of less than 0% of the median for that country).
Almost always, it is the national median that is used as the basis for the measurement of relative poverty. But from the point of view of the child it could be argued that the basis of comparison should be a different entity – the province, state, city, or neighbourhood.
Would the picture of child poverty change radically if the question ‘poverty relative to what?’ were to be answered in these different ways?
Little data are available to answer this question, but Report Card 1 drew upon the evidence available in the year 2000 to suggest some answers. It pointed out, for example, that the child poverty rate in America’s richest state, New Jersey, would have jumped from 1% to 22% if the basis of comparison had been the median income for New Jersey rather than for the United States as a whole. On the same basis, the child poverty rate in Arkansas would have fallen from 2% to 1%. Similar changes would undoubtedly be revealed in other countries where the mean state income differs significantly from the mean national income. Spain’s poorest province,
Extremadura, for example would have seen its child poverty rate almost halved if the poverty line had been re-drawn in this way. In countries such as Australia and Canada, where variations in average income between regions are smaller, the changes would be less dramatic.
Relative Poverty
Date: 2003. Non-OECD 2003, 2000 (Israel)
0 10 20 30 40 50 60 70 80
Russian Federation Latvia Israel Greece Non-OECD Nations Japan Hungary Poland Portugal Ireland Czech Republic Denmark Italy France Spain United States Switzerland New Zealand Canada Belgium Finland United Kingdom Netherlands Sweden Germany Austria Australia Norway OECD Nations
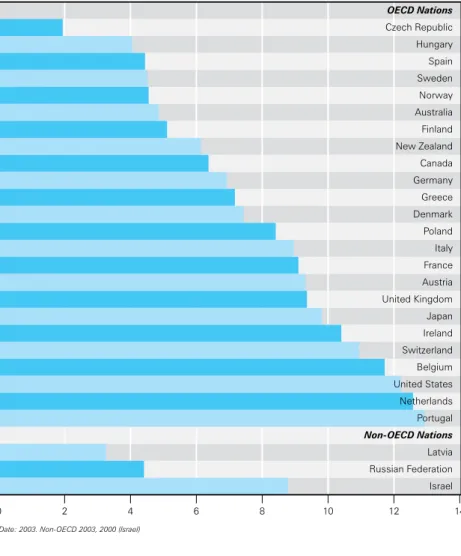
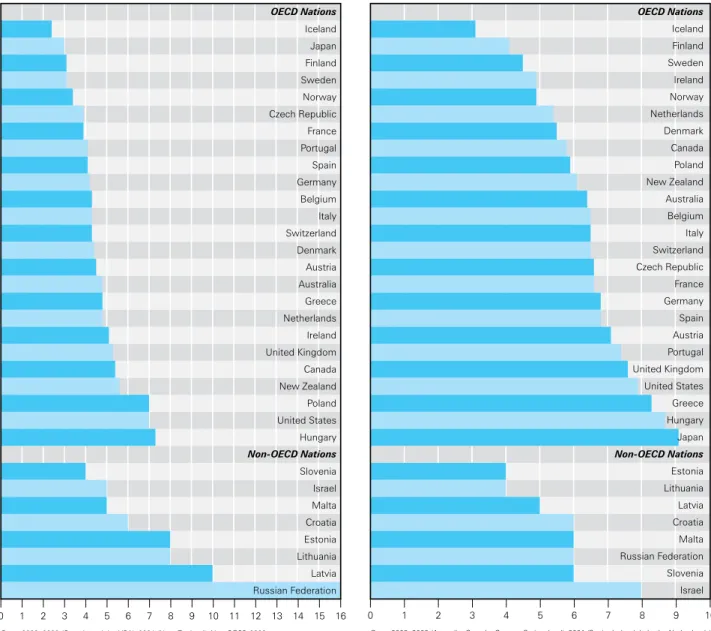
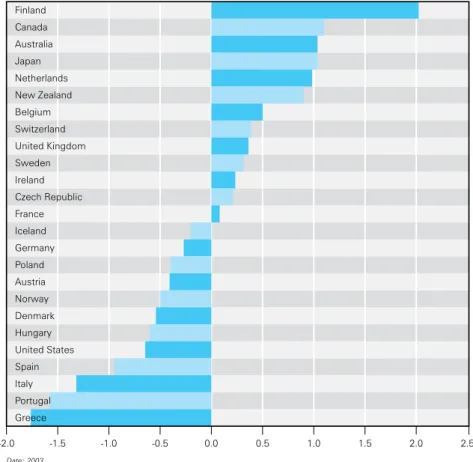
Figure 1.3b Percentage of children age 15 reporting less than six educational possessions
Figure 1.3a uses the Family Affluence Scale, deployed as part of WHO’s survey of Health Behaviour in School- age Children (see box on page 17). The survey put four questions to
representative samples of children aged 11, 13 and 15 in each of 35 countries.
The questions were:
Does your family own a car, van or truck?
Do you have your own bedroom for yourself?
During the past 12 months, how many times did you travel away on holiday with your family?
How many computers does your family own?
The results were scored and scaled to give a maximum affluence score of 8 with ‘low family affluence’ being defined as a score of 0-3. Figure 1.3a shows the percentage of children in each country reporting ‘low family affluence’ so defined.
Among the world’s wealthiest countries, it is in Italy that the change in the basis of comparison produces the most dramatic results. In 2000, nationally-based poverty lines revealed a child poverty rate that was four times higher in the mid-South than in Lombardy, whereas state-based poverty lines showed almost no difference between the two. In other words, it was possible for a family living in Sicily or Calabria to fall below the national poverty line whilst being no worse off than most of their fellow Sicilians and Calabrians (the relative child poverty rate for Sicily and Calabria fell by more than half, from 5% to 19%, when the state rather than the national median was used).
The child’s own context of comparison needs to be taken into account and it would be helpful to have more data on differences in child well-being within nations as well as between nations. But it is at the national level that policy is made and for most practical
purposes it makes sense for poverty lines to be drawn in relation to national medians. As Report Card 1 concluded: “In a world where national and international media are enlarging the society that people feel themselves to be living in – unifying expectations and homogenizing the concept of ‘the minimum acceptable way of life’ – it is probable that the nation will remain the most widely used basis of comparison. Children in Arkansas or Sicily or
Extremadura watch the same television programmes as their contemporaries in New Hampshire or Emilia Romagna or Madrid. Which brings us to the
uncomfortable thought that the same programmes and the same commercials are today also watched by children in Lagos and Delhi and Mexico City. In theory, there is as strong a case for enlarging the basic unit of comparison as for shrinking it.”
Dimension 1 Material well-being
There are weak spots in the Family Affluence Scale. Variations in the number of vehicles owned by the family, for example, may indicate levels of urbanization, or the quality of public transport systems. The number of holidays taken may reflect traditions such as regular holidays taken with relatives. Not sharing a bedroom may also reflect different cultural traditions, average family size, or rural/urban differences.
Perhaps the greater problem with Figure 1.3a, for present purposes, is that it tells us little about the more severe kinds of deprivation.
Nonetheless the Family Affluence Scale has the advantage of being based on tangible definitions that correspond to widely held notions of material well- being.
For present purposes, Figure 1.3a also provides a snapshot that is clearly different from the picture of relative poverty depicted in Figure 1.1. It can immediately be seen, for example, that Hungary, the Czech Republic and Poland, all ranked mid-table when measured by relative income poverty, drop to the bottom of the league when ranked by the Family Affluence Scale.
Conversely the United States and the United Kingdom move from the bottom of the table into the top ten.
Cultural and educational resources
Another important way of looking at children's material well-being is to ask whether, in the words of the
Convention on the Rights of the Child, the child’s circumstances are such as to allow ‘the development of the child's personality, talents and mental and physical abilities to their fullest potential’.
In this respect, many commentators have argued that the lack of educational and cultural resources should rank alongside lack of income, and that the educational resources of
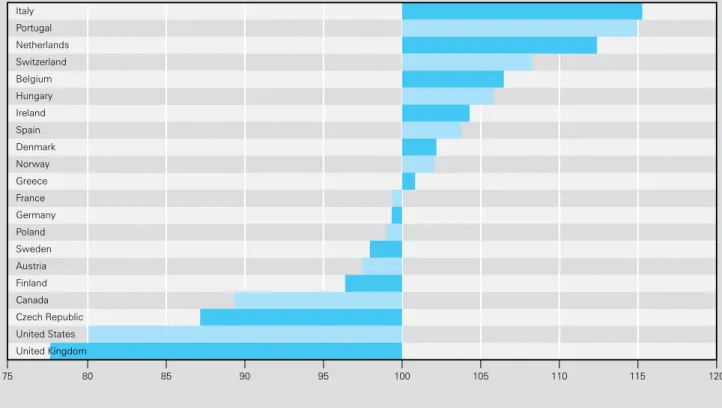
-1.5 -1.0 -0.5 0.0 0.5 1.0 1.5
Japan Poland Greece Portugal Hungary Ireland United States Belgium Italy Czech Republic Switzerland France Netherlands United Kingdom Austria Denmark Spain Germany New Zealand Finland Canada Australia Sweden Norway
Figure 1.3 Composite table of child material deprivation (combining Figures 1.3a, 1.3b and 1.3c)
Date: 2003. Non-OECD 2003, 2000 (Israel)
0 2 4 6 8 10 12 14
Israel Russian Federation Latvia Portugal Non-OECD Nations Netherlands United States Belgium Switzerland Ireland Japan United Kingdom Austria France Italy Poland Denmark Greece Germany Canada New Zealand Finland Australia Norway Sweden Spain Hungary Czech Republic OECD Nations
Figure 1.3c Percentage of children age 15 reporting less than 10 books in the home
Comparable survey findings from a wide variety of sources, covering as many OECD countries as possible, have been brought together and analysed for this report. A full description of the data sources and methodologies (including sensitivity analyses) is available in the background paper referred to on page 13.
All of the raw data used in this report are set out on pages 2 to 5.
In all cases, the data sets used are the latest available and in general apply to the period 2000-2003 (see pages to 7 for dates to which individual data sets refer).
Comparable data on several OECD countries such as Turkey and Mexico are unfortunately not available.
Some non-OECD countries have been included as a separate list in some of the tables used in this Report Card. These have been selected on the basis of data availability (and in the hope that they will demonstrate the potential usefulness of this approach to many middle-income countries not currently members of the OECD).
Data
the home, in particular, play a critical role in children's educational achievement.
The difficulties of measuring ‘cultural and educational deprivation’ are evident, but some insight into this aspect of child poverty is offered by tables 1.3b and 1.3c. Both draw on data from the Programme of International Student Assessment (see box on page 17) which, among many other questions, asked representative groups of 15 year-olds in 41 countries whether they had the following eight educational items at home:
a desk for study
a quiet place to work
a computer for schoolwork
educational software
an internet connection
a calculator
a dictionary
school textbooks.
Dimension 1 Material well-being
Figure 1.3b shows the percentage who report having fewer than six of these resources.
Drawing on the same source, Figure 1.3c shows the percentage of children reporting fewer than 10 books in the home – a suggested indicator of the deprivation of cultural resources.
Combined as in Figure 1.3, these three indicators show that children appear to be most deprived of educational and cultural resources in some of the world’s most
economically developed countries.
Conclusion
The available data fall short of capturing all the complexities of child poverty, being unable, for example, to address important issues such as the depth and duration of child poverty, or the extent of more extreme forms
of deprivation. Clearly, there is a need for more understanding of the links between income poverty and material deprivation. In particular, there is a need to know more about the links between income poverty, deprivation, and the kind of social exclusion which inhibits the development of potential and increases the risk of perpetuating poverty from one generation to the next.
Despite these necessary reservations, it
is argued that the indicators deployed
and combined in the summary table
for this chapter (Figure 1.0) represent
a significant improvement on income
poverty measures alone, and that they
offer the best currently available
comparative overview of children’s
material well-being in the world’s
developed economies.
H E A l T H A N D S A F E T y
Dimension 2
80 85 90 95 100 105 110 115 120 125
United States New Zealand Austria Ireland Greece Hungary Belgium Poland Portugal Canada United Kingdom Australia Japan Germany Czech Republic Switzerland Norway France Spain Italy Denmark Finland Netherlands Iceland Sweden
CoMPoNENTS INDICAToRS
health at age 0-1 – number of infants dying before age 1 per 1,000 births
– percentage of infants born with low birth weight (<2500g.)
preventative health services
– percentage of children age 12 to 23 months immunized against measles, DPT, and polio
safety – deaths from accidents and injuries per 100,000 aged 0 – 19
Assessing child health and safety
The table on the right shows how the index of children’s health and safety has been constructed. The choice of individual indicators reflects the availability of internationally comparable data.
For each indicator, countries have been given a score which reveals how far that country stands above or below the average for the OECD countries under review.
Where more than one indicator has been used, scores have been averaged. In the same way, the three component scores have been averaged to arrive at each country’s overall rating for children’s health and safety (see box on page 5). Health and Safety Figure 2.0 The health and safety of children, an OECD overview
The league table of children’s health and safety shows each country’s performance in relation to the average for the oECD countries under review.
Each country's overall score is the average of its scores for the three components chosen to represent children's health and safety – infant health, preventative health services, and child safety (see box below).
The table is scaled to show each country’s distance above or below the oECD average of 100.
Dimension 2 Health and safety
By almost any available measure, the great majority of children born into today’s developed societies enjoy unprecedented levels of health and safety. Almost within living memory, one child in every five in the cities of Europe could be expected to die before his or her fifth birthday; today that risk is less than one in a hundred.
Loss of life among older children is even more uncommon; fewer than one in every 10,000 young people die before the age of 19 as a result of accident, murder, suicide or violence.
This, too, represents an historically unheard of level of safety.
Nonetheless, health and safety remain a basic concern of all families and a basic dimension of child well-being. It can also be argued that the levels of health and safety achieved in a particular country are an indicator of the society's overall level of
commitment to its children.
Health and safety are assessed here by three components for which internationally comparable data are available: child health at birth, child immunization rates for children aged 12 to 23 months, and deaths from accidents and injuries among young people aged 0 to 19 years.
The chart opposite (Figure 2.0) brings these components together into an overview table of child health and safety in 25 OECD countries.
European countries occupy the top half of the table, with the top five places claimed by the four Nordic countries and the Netherlands. The Czech Republic ranks ahead of
wealthier countries such as Germany, Japan, the United Kingdom, Canada and the United States.
Infant survival and health
The first component of the index, child health at birth, has been assessed by two separate indicators: the infant mortality rate (the number of deaths before the age of one per thousand live births) and the prevalence of low birth weight (the percentage of babies born weighing less than 2500g.).
The infant mortality rate (IMR) is a standard indicator of child health
5and reflects a basic provision of the Convention on the Rights of the Child which calls on all countries ‘to ensure the child’s enjoyment of the highest attainable standard of health, including by diminishing infant and child mortality’. In the developing world, in particular, the IMR reflects the extent to which children’s rights are met in such fundamental areas as adequate nutrition, clean water, safe sanitation, and the availability and take-up of basic preventative health services. In the OECD countries it could be argued that infant deaths have now been reduced to such low levels that the IMR is no longer a revealing indicator. But as Figure 2.1b shows, substantial differences still exist among OECD countries – with IMR ranging from under 3 per 1,000 births in Iceland and Japan to over 6 per 1,000 in Hungary, Poland and the United States.
Significant in itself, the infant mortality rate can also be interpreted as a measure of how well each
country lives up to the ideal of protecting every pregnancy, including pregnancies in its marginalized populations, and taking all necessary precautionary and preventative measures – from regular antenatal check-ups to the ready availability of emergency obstetric care – by which infant mortality rates have been so dramatically reduced over the last 80 years. A society that manages this so effectively as to reduce infant deaths below 5 per 1,000 live births is clearly a society that has the capacity and the commitment to deliver other critical components of child health.
Children’s health and safety
Background to Report Card 7
This Report Card is supported by a background paper – Comparing Child Well-Being in OECD Countries: Concepts and Methods, Innocenti Working Paper No. 200-03, Jonathan Bradshaw, Petra Hoelscher and Dominic Richardson, UNICEF Innocenti Research Centre, Florence, 200.
The paper, setting out in more
detail the methods and
sources used in this overview,
is available on the Innocenti
web-site (www.unicef.org/irc).
The second of the two indicators chosen to represent health in the earliest stage of life is the prevalence of low birth weight (Figure 2.1a). This is a well-established measure of increased risk to life and health in the early days and weeks of life, but has also been associated with a greater risk to cognitive and physical development throughout childhood.
It may also speak to wider issues in that low birth weight is known to be associated with the mother’s health and socio- economic status. Mothers whose own diets have been poor in their teenage years and in pregnancy, or who smoke or drink alcohol in pregnancy, are significantly more likely to have low
birth weight babies. This indicator therefore also reflects the well-being of mothers – a critical factor for virtually all aspects of child well-being.
Immunization
The second component selected for the assessment of child health is the national immunization rate, reflecting not only the level of protection against vaccine preventable diseases but also the comprehensiveness of preventative health services for children.
7Immunization levels also serve as a measure of national commitment to primary health care for all children (Article 24 of the Convention on the Rights of the Child).
Figure 2.2 ranks 25 OECD countries by the percentage of children aged between 12 and 23 months who have received immunization against measles, polio, and diphtheria, pertussis and tetanus (DPT3). Overall, it shows high levels of coverage with no country falling below an average rate of 80%. But in the case of immunization the standard must surely be set at a very high level indeed. Vaccination is cheap, effective, safe, and offers protection against several of the most common and serious diseases of childhood (and failure to reach high levels of immunization can mean that ‘herd immunity’ for certain diseases will not Figure 2.1b low birth weight rate
(% births less than 2500g)
Israel Slovenia Russian Federation Malta Croatia Latvia Lithuania Estonia Japan Non-OECD Nations Hungary Greece United States United Kingdom Portugal Austria Spain Germany France Czech Republic Switzerland Italy Belgium Australia New Zealand Poland Canada Denmark Netherlands Norway Ireland Sweden Finland Iceland OECD Nations
Date: 2003, 2002 (Australia, Canada, Greece, Switzerland), 2001 (Spain, Ireland, Italy, the Netherlands), 1995 (Belgium). Non-OECD 2001, 2000 (Croatia).
0 1 2 3 4 5 6 7 8 9 10
Figure 2.1a Infant mortality rate
(deaths before the age of 12 months per 1000 live births)
Russian Federation Latvia Lithuania Estonia Croatia Malta Israel Slovenia Hungary Non-OECD Nations United States Poland New Zealand Canada United Kingdom Ireland Netherlands Greece Australia Austria Denmark Switzerland Italy Belgium Germany Spain Portugal France Czech Republic Norway Sweden Finland Japan Iceland OECD Nations
Date: 2003, 2002 (Canada and the USA), 2001 (New Zealand). Non-OECD 2003
0 1 2 3 4 5 6 7 8 9 10 11 12 13 14 15 16
be achieved and that many more children will fall victim to disease).
Furthermore, immunization rates may have broader significance in as much as the small differences in levels may be indicative of the effort made by each nation to 'reach the unreached’
and provide every child, and particularly the children of marginalized groups, with basic preventative health services.
Had adequate data been available, the percentage of infants who are breast- fed up to six months of age would also have been included in this picture of child health in the first year of life.
Apart from its unrivalled nutritional and immunological advantages in the earliest months, breast milk has also been associated with long-term advantages from improved cognitive development to reduced risk of heart disease. The percentage of infants being breast-fed in each country might also be interpreted as an indicator of the extent to which the results of today’s health research are put at the disposal of, and adopted by, the public at large. Unfortunately definitional problems and a lack of data for the majority of OECD countries led to the exclusion of this indicator (though it is worth noting in passing that available data on ‘at least
partial breast-feeding at the age of six months’ show unusually wide variations across the OECD – from a high of 80% in Norway to a low of just over 10% in Belgium).
Safety
The third and final component used to assess child health and safety is the rate of deaths among children and young people caused by accidents, murder, suicide, and violence.
Although this bundles together risks of very different kinds, it nonetheless serves as an approximate guide to overall levels of safety for a nation’s young people.
Drawing on the World Health Organization’s mortality database, Figure 2.3 ranks 25 OECD countries according to the annual number of deaths from such causes for every 100,000 people in the 0-19 age group.
As deaths at this age are thankfully rare, random year-on-year variations have been smoothed by averaging the statistics over the latest three years for which data are available.
Four countries – Sweden, United Kingdom, the Netherlands, and Italy – can be seen to have reduced the incidence of deaths from accidents and injuries to the remarkably low level of fewer than 10 per 100,000. Of the other OECD countries, all but two are recording rates of fewer than 20 per 100,000.
These figures represent rapid and remarkable progress; over the last 30 years, child deaths by injury in OECD countries have fallen by about 50%.
8Nonetheless, some countries have clearly achieved higher standards of child safety than others and the differences are significant. If all OECD countries had the same child injury death rate as Sweden, for example, then approximately 12,000 child deaths a year could be prevented. As is
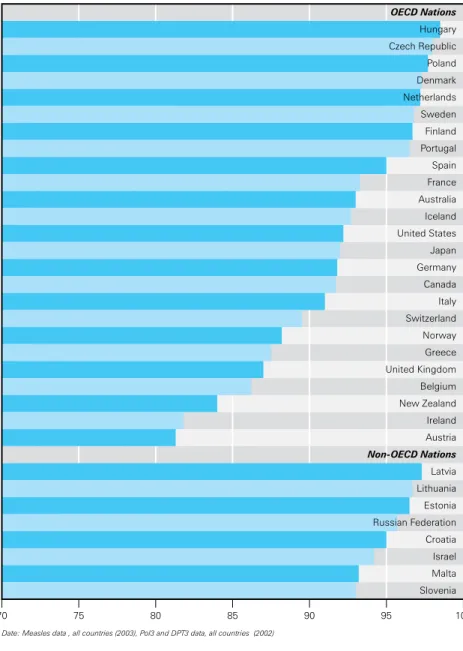
Date: Measles data , all countries (2003), Pol3 and DPT3 data, all countries (2002)
70 75 80 85 90 95 100
Slovenia Malta Israel Croatia Russian Federation Estonia Lithuania Latvia Austria Non-OECD Nations Ireland New Zealand Belgium United Kingdom Greece Norway Switzerland Italy Canada Germany Japan United States Iceland Australia France Spain Portugal Finland Sweden Netherlands Denmark Poland Czech Republic Hungary OECD Nations
Figure 2.2 Percentage of children age 12-23 months immunized against the major vaccine-preventable diseases
Dimension 2 Health and safety
so often the case, the likelihood of a child being injured or killed is associated with poverty, single- parenthood, low maternal education, low maternal age at birth, poor housing, weak family ties, and parental drug or alcohol abuse.
9Omissions
There are important omissions in this picture of child health and safety. In particular, some direct indicator of children’s mental and emotional health would have been a valuable addition.
National suicide rates among adolescents were considered, but the research suggests that suicide is more
to be seen as a rare event related to particular circumstance than as an indicator of overall mental health among a nation’s young people.
The overview would also have benefited from some indicator of the level of child abuse and neglect in each nation. The lack of common definitions and research
methodologies, plus inconsistencies between countries in the current classification and reporting of child abuse, have for the moment ruled out this possibility. Report Card 5 (September 2003) reported that a small group of OECD countries –
Date: 1993-1995 (Finland, Hungary, Iceland, the Netherlands, Norway), 1994-1996 (Poland, Sweden), 1995-1997 (Australia, Belgium, Germany), 1996-1998 (Spain, US), 1997-1999 (Canada, France, New Zealand, UK), 1999-2001 (Austria, Ireland, Italy, Portugal), 2000-2002 (Switzerland, Greece). Non-OECD: Israel (2003), Russian Federation (2000-2002) Lithuania (1995-97), Estonia, Slovenia (1994-96), Latvia (1993-95), Malta, Croatia (1992-94).
0 10 20 30 40 50 60 70
Israel Russian Federation Latvia Estonia Lithuania Slovenia Croatia Malta New Zealand Non-OECD Nations United States Portugal Czech Republic Poland Hungary Belgium Australia Austria Ireland Finland Canada Greece Germany Norway Japan France Switzerland Spain Iceland Italy Netherlands United Kingdom Sweden OECD Nations
Figure 2.3 Deaths from accidents and injuries per 100,000 under 19 years (average of latest three years available)
Spain, Greece, Italy, Ireland and Norway – have the lowest rates of child death from maltreatment. Once again, the risk factors most closely and consistently associated with child abuse and neglect are poverty, stress, and parental drug and alcohol abuse.
In total, approximately 3,500 children (under the age of 15) die every year in the OECD countries from
maltreatment, physical abuse, and neglect. Traffic accidents, drownings, falls, fires and poisoning carry this total to more than 20,000 child deaths each year.
10These may not be large figures in relation to the total populations of young people in the OECD countries. But as Report Card 2 argued in 2001, such figures need to be read in the light of the
unimaginable anguish and grief of the
families concerned, and of the fact
that the number of deaths is but the
tip of an iceberg of trauma and
disability.
Dimension 2 Health and safety
Two of the sources drawn upon extensively in this Report Card are the OECD Programme for International Student Assessment (PISA) and the World Health Organization’s survey of Health Behaviour in School-age Children (HBSC) 2001.
HBSC 2001
For more than 20 years, the World Health Organization survey Health Behaviour in School-age Children (HBSC) has informed and influenced health policy and health promotion by collecting information on such topics as family resources and structure, peer interaction, risk behaviours, subjective health, sexual health, physical activity, and eating and self-care habits. The latest HBSC survey was conducted in 2001 and included 21 OECD countries in its total of 35 nations (Australia, New Zealand, Japan and Iceland did not take part).
In each participating country, HBSC uses cluster survey techniques to select 1,500 young people at each of three ages – 11, 13, and 15 years. Consistent
procedures are followed to ensure the comparability of survey methods and data processing techniques.
Trained administrators are present in the classroom for the administration of all questionnaires.
HBSC data have contributed to various dimensions of this overview, including children’s material well-being, children’s relationships, behaviours, and subjective well-being.
*Results from the 200 PISA were not available in time to be included in this overview.
Sources:
Adams, R. & Wu, M., (eds.) (2002) PISA 2000 Technical Report.
Paris, OECD.
Currie, C., et al (eds.) (200) Young People’s Health in Context.
Health Behaviour in School-age Children Study (HBSC):
International Report from the 2001/2002 Study. WHO Regional Office for Europe.
HBSC (2005) Health Behaviour in School-aged Children Website (http://www.hbsc.org/index.html), November 2005.
OECD (200) Learning for Tomorrow’s World: First Results from PISA 2003. Paris, OECD.
PISA and HBSC
PISA
Beginning in 2000, the PISA is conducted every three years with the objective of assessing young people’s knowledge and life-skills in economically developed countries.* The four main areas of assessment are:
reading, mathematics and science literacy
study and learning practices
family resources and structure (including pupils’
own perspectives of their school-life and peers)
the organization of schools and school environments.
Year 2000 data were collected for 3 countries, including all of the countries featured in this study. In its second wave (2003), PISA collected data for 1 countries. PISA 2003 also included a new assessment of problem solving skills.
Data are collected from nationally representative samples of the school population at around the age of 15 (the end of compulsory schooling in most
countries). Schools are sampled on the basis of size with a random sample of 35 pupils for each school chosen. Total sample sizes are usually between ,000 and 10,000 pupils per country .
To ensure comparability, data collection systems employ standardized translation and assessment procedures and a collection window is set to ensure that data are collected at comparable times in the school year. Where response rates are low, PISA administrators work with schools and national project managers to organize follow-up sessions. During each PISA round, international monitors review both the national centres and visit at least 25% of the selected schools in each country to ensure quality and consistency of data collection procedures.
PISA data have contributed to various dimensions of this overview, including material well-being,
educational well-being, subjective well-being, and
children’s relationships.
E D U C A T I o N A l w E l l - B E I N G
Dimension 3
80 85 90 95 100 105 110 115 120
Portugal Italy Austria France United Kingdom Greece Spain New Zealand Switzerland Hungary United States Iceland Norway Germany Czech Republic Denmark Ireland Australia Netherlands Sweden Finland Poland Canada Belgium
CoMPoNENTS INDICAToRS school
achievement at age 15
– average achievement in reading literacy
– average achievement in mathematical literacy
– average achievement in science literacy
beyond basics – percentage aged 15-19 remaining in education
the transition to employment
– percentage aged 15-19 not in education, training or employment
– percentage of 15 year-olds expecting to find low-skilled work
Assessing educational well-being
The table on the right shows how children’s educational well-being has been assessed. The choice of individual indicators reflects the availability of internationally comparable data.
For each indicator, countries have been given a score showing how far that country stands above or below the average for the countries under review. Where more than one indicator has been used, scores have been averaged. In the same way, the three
component scores have been averaged to arrive at each country’s overall rating for children’s
educational well-being (see box on page 5). Educational well-being
Figure 3.0 The educational well-being of children, an OECD overview
The league table below attempts to show each country’s performance in ‘children’s educational well-being’ in relation to the average for the oECD countries under review. Scores given are averages of the scores for the three components selected to represent children's educational well-being (see box below).
This overview table is scaled to show each country’s distance above or below the oECD average of 100.
Dimension 3 Educational well-being
Children’s educational well-being
A measure of overall child well-being must include a consideration of how well children are served by the education systems in which so large a proportion of their childhood is spent and on which so much of their future well-being is likely to depend. Ideally such a measure would reflect the extent to which each country is living up to its commitment to Article 29 of the Convention on the Rights of the Child which calls for ‘the development of the child’s personality, talents and mental and physical abilities to their fullest potential’.
Figure 3.0 brings together the three different components chosen to represent educational well-being into an OECD overview. Belgium and Canada head the table. The United Kingdom, France and Austria join the four Southern European countries at the foot of the rankings. But perhaps the most remarkable result is recorded by Poland which takes third place in the table despite being, by some margin, the poorest country out of the 24 countries listed (with a per capita GDP
11of less than half that of the only two countries ranking higher in the table).
Achievement
The first component chosen to represent educational well-being is young people's educational achievements in reading, maths and science. This is made possible by the OECD’s Programme of International Student Assessment (PISA) which sets out to measure, every three years, “the extent to which education systems in participating countries are preparing their
students to become lifelong learners and to play constructive roles as citizens in society.”
12To complete this survey approximately 250,000 students in 41 countries are given a two-hour examination designed to measure their abilities in reading, maths and science.
The examination is set by an international expert group, including both employers and educationalists, and is based on the ability to apply basic literacy, numeracy, and scientific skills to the management of everyday life.
Figure 3.1 combines the results into an overall league table of school
achievement.
Some salient features:
Finland, Canada, Australia, and Japan head the table.
Four southern European countries – Greece, Italy, Spain and Portugal – occupy the bottom four places.
Norway and Denmark, usually outstanding performers in league tables of social indicators, are to be found in 18th and 19th places respectively.
The Czech Republic ranks comfortably above the majority of OECD countries, including many of its larger and wealthier European neighbours.
Date: 2003
-2.0 -1.5 -1.0 -0.5 0.0 0.5 1.0 1.5 2.0 2.5
Greece Portugal Italy Spain United States Hungary Denmark Norway Austria Poland Germany Iceland France Czech Republic Ireland Sweden United Kingdom Switzerland Belgium New Zealand Netherlands Japan Australia Canada Finland
Figure 3.1 Educational achievement of 15 year-olds, an overview of reading,
mathematical and scientific literacy.
Ideally, an overview of educational well-being would also have included some measure of the extent to which different OECD countries prevent low-achieving pupils from falling too far behind the average level of achievement. This was the issue addressed in Report Card 4 (2002) which found wide variations in educational disadvantage within the OECD countries. The same study also found that high absolute standards of educational achievement are not incompatible with low levels of relative disadvantage – i.e. the best education systems allow high- achieving pupils to fulfil their potential whilst not allowing others to fall too far behind.
Beyond basic skills
Those growing up in the OECD countries today face a world in which managing the ordinary business of life
– work and careers, families and homes, finance and banking, leisure and citizenship – is becoming ever more complex. The corollary of this is that those with low skills and few
qualifications face a steepening incline of disadvantage. The basic literacy, maths and science skills measured in Figure 3.1 are the foundation for coping with these demands. But more advanced skills are increasingly necessary if young people are to cope well with the changing demands of labour markets. A measure of ‘beyond basic’ skills is presented in Figure 3.2 which shows the percentage of children who continue in education beyond the compulsory stages. Once again, the top half of the table is captured by Northern European countries.
Transition to employment
How well young people manage the transition from education to
employment is the third component selected to represent educational well-being.
Clearly the transition to paid work is dependent not only on skills and qualifications acquired in school but also on the training and employment opportunities available thereafter.
Nonetheless, the transition to earning a living is one of the important outcomes of education and is a critical stage in the life of almost every young person.
Two complementary indicators have been chosen to represent that transition.
The first is the percentage of young people aged 15 to 19 in each country who are not in education, employment, or training (Figure 3.3a). The second is the percentage of young people in each country who, when asked ‘what kind of job do you expect to have when you are about 30 years old?’, replied by listing a job requiring low skills (Figure 3.3b). Work requiring low skills is defined using an internationally standardized index and implies ‘not requiring further training or qualifications’.
School leavers who are neither in training nor employment are clearly at greater risk of exclusion or
marginalization. Figure 3.3a is therefore worrying for those countries at the foot of the table – including France and Italy. High percentages of 15 year- olds expecting to be in low-skilled work would also appear to be a cause for concern in labour markets where many low-skill jobs are under threat from either outsourcing or
technological innovation or both. In countries like France, Germany, and the United Kingdom, the proportion of young people not looking beyond low- skilled work is more than 30%. In the United States, it is less than 15%.
Date: 2003. Non-OECD 2003, 2002 (Russian Federation).
20 30 40 50 60 70 80 90 100
Russian Federation Israel New Zealand Non-OECD Nations Portugal United States United Kingdom Austria Italy Spain Australia Greece Iceland Switzerland Hungary Ireland Denmark Netherlands Norway Finland Sweden France Poland Germany Czech Republic Belgium OECD Nations
Figure 3.2 Percentage of 15-19 year-olds in full time or part time education
Date: 2003, 2002 (Iceland, Italy, the Netherlands, and the United States). Non-OECD: 2003, 2002 (Israel).
0 5 10 15 20 25 30
Israel France Non-OECD Nations Italy Austria Finland United Kingdom Greece Portugal Switzerland Spain Belgium United States Hungary Australia Canada Czech Republic Ireland Germany Netherlands Iceland Sweden Poland Denmark OECD Nations Norway
Figure 3.3a Percentage of 15-19 year-olds not in education, training or employment
Date: 2000
0 10 20 30 40 50 60
Israel Russian Federation Latvia Japan Non-OECD Nations France Switzerland Czech Republic United Kingdom Germany Netherlands Austria Iceland Hungary Norway Sweden Finland Spain Italy Australia New Zealand Ireland Canada Denmark Belgium Portugal Greece Poland United States OECD Nations
Figure 3.3b Percentage of pupils age 15 expecting to find work requiring low skills
Early childhood
There is a glaring omission from this attempt to build an overview picture of children’s educational well-being in the OECD countries.
For several decades, educational research has consistently pointed to the fact that the foundations for learning are constructed in the earliest months and years of life and that the effort to give every child the best possible start needs to begin well before the years of formal education.
This growing realization, combined with other changes such as the rapidly increasing participation of women in the workforce and the steep rise in the number of single-parent families, has made child care into one of the biggest issues facing both families and governments in the OECD countries
today. By the same token, it must also be regarded as a major factor in children’s educational well-being.
Unfortunately, adequate and comparable data are not available to permit the quality and availability of child care in different countries to be included in this overview.
International statistics are available showing the percentage of children aged 0 to 2 years who are in registered child care, but these data speak more to the availability of women for paid work and have nothing to say about the quality of the child care provided; nor do they address the current and considerable controversy about the benefits of day care for children under the age of two.
Ideally, data would have been included
on day care or pre-school provision for 3-to-6 year-olds, and this represents an obvious area for future improvements in this overview.
On the question of how ‘quality child care’ should be defined there is broad but vague agreement. The OECD’s own review of child care services has described the essence of quality care as “a stimulating close, warm and supportive interaction with children”. A similar review in the United States has concluded that “warm, sensitive and responsive interaction between caregiver and child is considered the cornerstone of quality” – a characteristic that is as difficult to define and measure as it is to deliver.
Dimension 3 Educational well-being
R E l A T I o N S H I P S
Dimension 4
75 80 85 90 95 100 105 110 115 120
United Kingdom United States Czech Republic Canada Finland Austria Sweden Poland Germany France Greece Norway Denmark Spain Ireland Hungary Belgium Switzerland Netherlands Italy Portugal