Comparing Public Administrations
An assessment of the quality and efficiency of public administration in Ireland compared with selected European and OECD countries
Richard Boyle
CPMR Research Report 7
First published in 2007 by the
Institute of Public Administration 57-61 Lansdowne Road Dublin 4
Ireland
in association with
The Committee for Public Management Research
www.ipa.ie
© 2007 with the Institute of Public Administration
All rights reserved. No part of this publication may be reproduced or transmitted in any form or by any means, electronic or mechanical, including photocopying, recording or any information storage and retrieval system, without permission in writing from the publisher.
British Library Cataloguing in Publication Data
A catalogue record for this book is available from the British Library.
ISBN-13: 978-1-904541-54-7 ISSN: 1393-9424
Cover design by Slick Fish Design, Dublin Typeset by Computertype Ltd, Dublin Printed in Ireland by Future Print, Dublin
Executive Summary
I
n recent years, there have been a number of attempts to compare the efficiency and performance of the public sector across countries.International ranking has become a popular activity. This paper looks at existing data from a number of international sources on the quality of public administration provision. In terms of tentative findings arising from the analysis, a number of general points emerge:
● Ireland tends to come out of the analysis of the quality and efficiency of public administration relatively well, particularly when using the most recent data available. Ireland is in with a cluster of countries – Austria, Denmark, Finland, Luxembourg, the Netherlands and Sweden in the EU, Australia, Canada, New Zealand, Norway and Switzerland of other OECD countries – that tend to consistently score well across the range of indicators examined here.
● Ireland ranks particularly well against the indicators examining regulatory quality and efficiency.
● Denmark and Finland tend to consistently be ranked particularly highly across the range of indicators examined. Of the newer EU member states, Estonia consistently scores well.
However, significant limitations with regard to data reliability and validity hamper the drawing of meaningful conclusions from the analysis. The ‘state of the art’ of measuring public administration performance is not at a stage where clear judgements can be made.
With these limitations in mind, the paper outlines some steps that can be taken to improve the international comparative database.
Background
In recent years there have been a number of efforts to compare public sector efficiency and perform- ance internationally. As noted in Boyle (2006), the European Central Bank (ECB) has conducted an international comparison of public sector efficiency (Afonso, Schuknecht and Tanzi, 2003), the Social and Cultural Planning Office in the Netherlands has reviewed public sector performance (Social and Cultural Planning Office, 2004) and the World Bank has developed a bi-annual survey of governance indicators (Kaufmann, Kraay and Mastruzzi, 2005).
Ireland has tended to come well out of these international comparisons.
The focus of these studies has been on public sector performance overall. The quality of public administration has been only one element, with other factors such as economic performance and outcomes in education and health being more influential in the overall scoring. The Social and Cultural Planning Office (SCP) study did explicitly include a separate section on the quality of public administration. On this criterion, Ireland ranked seventh out of the EU15 countries based on 2003 data.
The intention of this paper is threefold. First, to update the international comparative information on Ireland’s administrative performance.1The focus here is specifically on administrative performance rather than general public sector performance.
Second, to look at additional indicators on admin- istrative performance that are available to see if they enhance our understanding of the comparative performance of Ireland’s public administration.
And third, to critique the indicator base and make suggestions as to ways forward for the development of comparative indicators of administrative performance.
A warning about data limitations
The SCP, ECB and World Bank studies all caution about the need to interpret their findings with great care. This study is no different. First, there is the issue of whether the indicators used to represent public administration service provision and quality really captures what public administration is about.
Indicators, by their nature, only give a partial picture. Second, much of the data in this paper comes from an executive opinion survey undertaken by the IMD (Institute for Management Development) World Competitiveness Center as part of its research for the annual IMD World
Competitiveness Yearbook (IMD, 2006). This survey data comprises small-scale samples of opinion from managers and experts in the business community.2 The survey data is thus limited both in terms of its overall reliability and the fact that it represents the views of one section of the community (business) only. Third, the point scores arrived at (on a scale from 1-10 for the IMD data and between –2.5 and +2.5 for the World Bank governance indicators) should not be interpreted too strictly, as there are margins of error associated with these estimates.3 Fourth, changes over time should be viewed cautiously. Many of the indicators assessed represent ‘snapshots’ at one particular point in time. Small shifts in annual ranking are not particularly meaningful.
In all, when interpreting the findings set out in this paper, these limitations should be borne in mind. In particular, small variations in scores, either between countries or over time, should be interpreted cautiously. These may be no more than random variations to be expected given the data being used. What is of interest is to identify broad patterns emerging from the data. Data limitations of individual data sets are discussed further in subsequent sections of the paper.
Updating the SCP subjective quality of government aggregate indicator
‘Public administration includes policy making, legislating policy and management of the public sector’ (SCP, 2004, p.243). The SCP (2004, p.256) notes that the services produced by public admin- istration are social goods, where consumption is non-rival and no one can be excluded from consumption. In such circumstances, the SCP argues, the functioning of public administration can only be measured by subjective indicators. In attempting to measure the quality of public administration, the SCP uses survey data from the IMD executive opinion survey. Four indicators of government quality were selected, based on the principles of well functioning administrative systems:
● Level of bureaucracy: the extent to which bureaucracy hinders business activity.
● Level of transparency: the extent to which trans- parency of government policy is satisfactory.
● Level of effectiveness: the extent to which government decisions are effectively imple- mented.
● Level of corruption: the extent to which bribing and corruption exist in the economy.4
The SCP combined these four indicators to produce what they called a subjective quality of government aggregate index (SCP, 2004, p.267). As mentioned above, on the basis of this aggregate indicator, Ireland ranked seventh out of the EU15.5
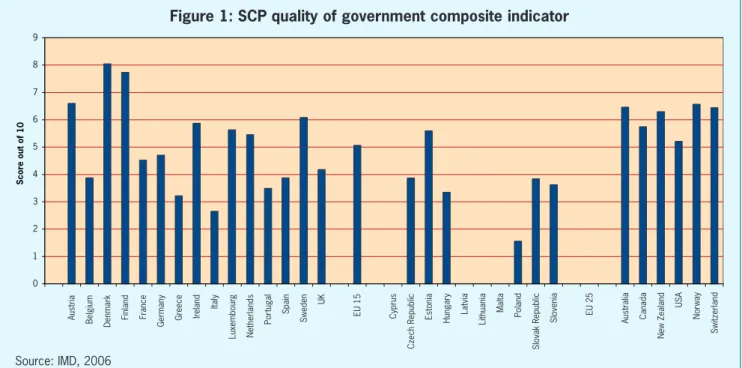
An updated score for the SCP aggregate quality of government indicator is given in Figure 1. The data on which this figure is based are from the IMD World Competitiveness Yearbook 2006. The infor- mation is presented for the EU15 countries, as many of the EU25 countries that have data available, and a selection of other OECD countries. On the basis of this updated information, it can be seen that Ireland ranks fifth of the EU15 in 2006. Denmark and Finland are clear ‘leaders’. Of the other EU25 countries, Estonia ranks above the EU15 mean score. The other OECD countries included all tend to score well, all being above the EU15 mean score.
Details for the four individual indicators that make up the aggregate SCP indicator are given in Appendix 1. From these individual indicators, it can be seen that Ireland ranks around the EU15 average with regard to corruption and implementa- tion effectiveness from a business perspective, and significantly above average with regard to bureaucracy and transparency (that is, the bureaucracy is not seen as hindering business deci- sions and there is good transparency with regard to government policy).
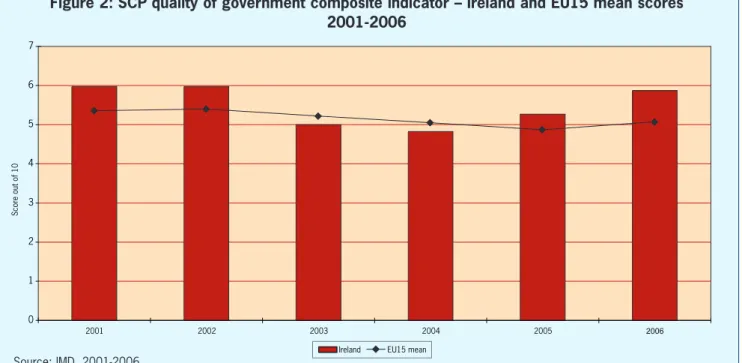
Figure 2 illustrates changes in Ireland’s score on the SCP quality of government aggregate indicator against changes in the EU15 mean score over time.
As mentioned in section 2, particular care should be taken in interpreting changes over time. The figure shows that Ireland scored below the EU15 mean score for 2003 and 2004, but above the mean for 2001, 2002, 2005 and 2006. However, the differences between the Irish score and the EU15 mean score in 2003, 2004 and 2005 in particular are small, and are likely to be within any margin of error associated with the sample.
This issue of margins of error is an important point to bear in mind. For example, while Ireland is shown as ranking fifth of the EU15 in 2006, given potential margins of error based on the sample size and assumptions used, Ireland could easily rank anywhere between third and ninth.
Developing an extended quality of public administration aggregate indicator
There are a number of other indicators from the IMD executive opinion survey that can be used in judging the quality of public administration.6 In this study, in addition to the four indicators used by the SCP, four other indicators are used to develop an extended aggregate indicator of public adminis- tration quality. The additional four indicators selected are:
0 1 2 3 4 5 6 7 8 9
Score out of 10 Austria Belgium Denmark Finland France Germany Greece Ireland Italy Luxembourg Netherlands Portugal Spain Sweden UK EU 15 Cyprus Czech Republic Estonia Hungary Latvia Lithuania Malta Poland Slovak Republic Slovenia EU 25 Australia Canada New Zealand USA Norway Switzerland
Source: IMD, 2006
Figure 1: SCP quality of government composite indicator
● Level of justice administrative fairness: the extent to which justice is fairly administered.7
● Level of independence: the extent to which the public service is independent from political interference.
● Legal and regulatory framework: the extent to which the legal and regulatory framework encourages the competitiveness of enterprises.
● Level of regulation intensity: the extent to which regulation intensity restrains the ability of companies to compete.
The logic for including these additional indicators is to give a more rounded picture of public administration quality. The administration of justice and the independence of the public service from political interference are basic aspects of public administration. The other two indicators reflect the growing importance in recent years of the regulatory role of public administration. There is an expectation that as part of a quality service, public administrators will help ensure a legal and regulatory framework that encourages competition;
and that they will scrutinise regulation intensity to ensure it does not become too great a burden on enterprises.
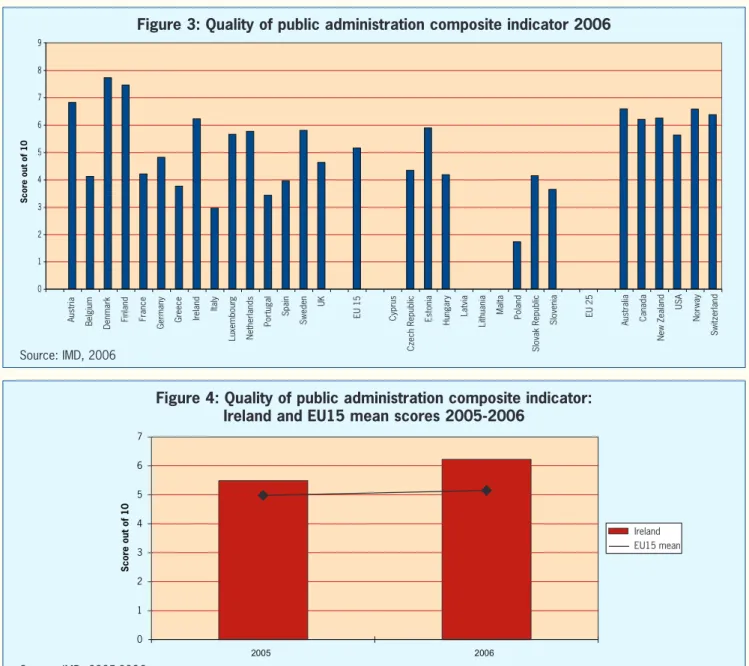
Figure 3 sets out the scores for the selected countries for this extended quality of public administration aggregate indicator (hereafter just called the quality of public administration aggregate indicator). It can be seen that broadly the scores and rankings are similar to those produced for the SCP ranking in Figure 1. Ireland swaps with
Sweden, and moves into fourth spot in the EU15.
Again, Denmark and Finland score notably above all other countries. The data for this aggregate indicator are only available from 2005; so Figure 4 shows changes in Ireland’s score against changes in the EU15 mean score between 2005 and 2006.
Ireland ranks comparatively higher in 2006.
Details for the four additional individual indicators that go towards making up the quality of public administration aggregate indicator are given in Appendix 2. From these individual indicators, it can be seen that Ireland scores particularly well in the indicators associated with regulation and above the EU15 mean score for all four indicators.
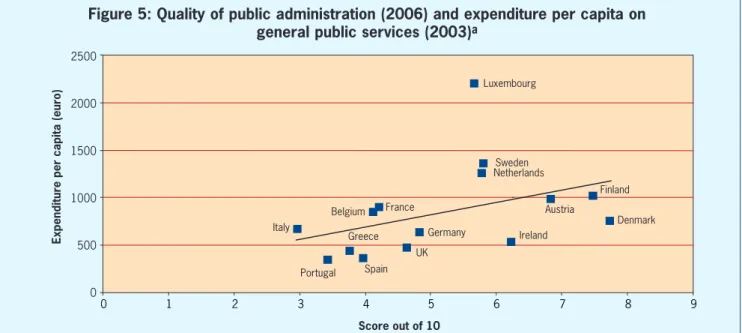
The SCP (2004, p.267) assessed the effectiveness of public administration by relating expenditure to subjective quality of government for the EU15 countries. The intention here was to see if it is possible to show if there is any correlation between administrative quality and government expenditure on public services. Can it be said that spending more, for example, is likely to lead to a better quality service? This exercise is replicated in Figure 5, using the quality of public administration aggregate indicator and contrasting this with expenditure per capita on general public services (this was the expenditure indicator used by the SCP). As with the SCP experience, a weak relationship between expenditure and business perception of quality of public administration is shown. Ireland comes relatively well out of this picture, achieving a relatively high score for quality
0 1 2 3 4 5 6 7
2001
Score out of 10
2002 2003 2004 2005 2006
Ireland EU15 mean
Figure 2: SCP quality of government composite indicator – Ireland and EU15 mean scores 2001-2006
Source: IMD, 2001-2006
of public administration with a relatively low level of expenditure.
An alternative way of examining the relationship between quality of public administration and expenditure is to use overall government spending as the expenditure indicator. Figure 6 contrasts the quality of public administration aggregate indicator with general government outlays as a percentage of Gross Domestic Product (GDP). As with Figure 5, overall a weak relationship between spending and business perception of quality of public administration is shown. Ireland seems to score particularly well, achieving a high quality score for a very low comparative level of government spending. However, this indicator is somewhat misleading as Irish GDP figures are significantly affected by the importance of foreign direct
investment to the Irish economy. While for most countries GDP and GNI are almost identical, in Ireland Gross National Income (GNI) is approximately 85 per cent of GDP.8 General government outlays are just over 40 per cent of GNI for Ireland, which brings the Irish score more in line with other countries, though still at the lower end of expenditure. Ireland still receives a significantly higher quality score than many other EU15 countries with higher expenditure levels.
Both Figures 5 and 6 are subject to limitations of interpretation as are the other data in this paper.
While suggesting that there is no straightforward correlation between government expenditure on public services and administrative quality, it is not possible to delve deeper as to why this is so, and what the implications may be.
Austria Belgium Denmark Finland France Germany Greece Ireland Italy Luxembourg Netherlands Portugal Spain Sweden UK EU 15 Cyprus Czech Republic Estonia Hungary Latvia Lithuania Malta Poland Slovak Republic Slovenia EU 25 Australia Canada New Zealand USA Norway Switzerland
0 1 2 3 4 5 6 7 8 9
Score out of 10
Source: IMD, 2006
Figure 3: Quality of public administration composite indicator 2006
0 1 2 3 4 5 6 7
2005 2006
Score out of 10
Ireland EU15 mean
Source: IMD, 2005-2006
Figure 4: Quality of public administration composite indicator:
Ireland and EU15 mean scores 2005-2006
World Bank governance indicators
Since 1996, the World Bank has been developing governance indicators as part of its work in promoting good governance. Governance indicators are produced for just over 200 countries every two years. The indicators are based on several hundred individual variables measuring perceptions of governance, drawn from 37 separate data sources constructed by 31 different organisations.
Most relevant from the perspective of this study are the government effectiveness and regulatory quality indicators. The government effectiveness
indicator aims to measure the competence of the bureaucracy and the quality of public service delivery. A broad range of sources is used, includ- ing the Economist Intelligence Unit, World Economic Forum, Bertelsmann Foundation and IMD. The regulatory quality indicator aims to measure the incidence of market friendly policy and practice. Again, a broad range of data sources is used.9 Point estimates of the dimensions are presented as well as margins of error for each country and period.
In interpreting findings from the World Bank governance indicators, as well as the cautions noted
0 1 2 3 4 5 6 7 8 9
France Greece Belgium Italy
Luxembourg
Score out of 10
Expenditure per capita (euro) Germany
UK Spain Portugal
Denmark Finland Austria
Ireland NetherlandsSweden 2500
2000
1500
1000
500
0
Figure 5: Quality of public administration (2006) and expenditure per capita on general public services (2003)a
aExcluding debt interest payments (classified as property income consolidated) and foreign transfers (classified as other current transfers consolidated).
Source: Eurostat and IMD, 2006
30 35 40 45 50 55 60
0 1 2 3 4 5 6 7 8 9
General government total outlays as a % of nominal GDP
Score out of 10
Sweden
Denmark Finland
Austria Netherlands
Luxembourg Germany
Greece UK
Spain
Ireland Belgium
France
Portugal Italy
Figure 6: Quality of public administration (2006) and general government outlays as % of GDP (2006)
Source: OECD and IMD, 2006
in section 2, there are two other issues of note. One is the combining of judgements on the performance of politicians and administrators. The wide range of data used by the World Bank for its governance indicators includes a number of items that assess the performance of politicians and government policy more than the performance of administrators (for example, government stability in the govern- ment effectiveness indicator, the existence of price controls in the regulatory quality indicator). Thus in judging the quality of public administration it is not possible to entirely separate out perceptions on government policy and political performance from administrative performance.10 A further and even more serious concern with regard to the World Bank governance indicators is that a recent OECD study has questioned their statistical legitimacy for
comparing country scores and highlights their lack of comparability over time (Arndt and Oman, 2006).
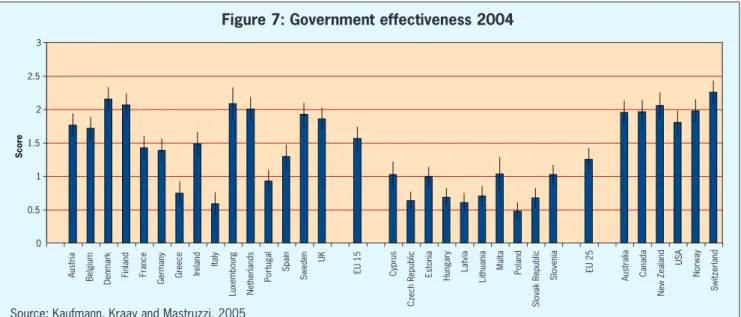
Given this note of significant caution with regard to interpretation, Figure 7 sets out results against the World Bank government effectiveness indicator for 2004, the last year for which data are available.
The bar at the top of each column shows the margin of error associated with each point estimate. Ireland ranks ninth of the EU15 on this criterion, which is slightly below the EU15 mean score and below all the other OECD countries included in the survey.
This is broadly in line with the SCP quality of public administration aggregate indicator for 2004, as shown in Figure 2, which was below the EU15 mean. Figure 8 shows changes in Ireland and the EU15 mean scores for the government effectiveness indicator from 1996 to 2006. Apart from 2000, when
Score
0 0.5 1 1.5 2 2.5 3
Austria Belgium Denmark Finland France Germany Greece Ireland Italy Luxembourg Netherlands Portugal Spain Sweden UK EU 15 Cyprus Czech Republic Estonia Hungary Latvia Lithuania Malta Poland Slovak Republic Slovenia EU 25 Australia Canada New Zealand USA Norway Switzerland
Figure 7: Government effectiveness 2004
Source: Kaufmann, Kraay and Mastruzzi, 2005
0 0.5 1 1.5 2
Score
2.5
1996 1998
Ireland EU15 mean
2000 2002 2004
Figure 8: Government effectiveness indicator: Ireland and EU mean scores 1996-2004
Source: Kaufmann, Kraay and Mastruzzi, 2005
Ireland was above the mean score, the Irish score has tended to be around that of the EU15 mean score.
Figure 9 sets out the results for the World Bank regulatory quality indicator in 2004. Ireland ranks fifth of the EU15 here. The relatively good performance of Estonia of the new countries of the EU25 is notable.
World Bank Doing Business indicators
As mentioned in Boyle (2006), a different approach to assessing the quality and efficiency of public administration provision is to take a bottom- up perspective. In this case, instead of broad sectoral indicators based on perceptual data, aspects of performance are assessed from a service user perspective. The World Bank has adopted this approach with regard to assessing some aspects of the effects of regulation, with the development of their Doing Business database (http://www.doingbusiness.org/). Three indicators from this Doing Business database are particularly relevant to the assessment of public administration quality and efficiency:
● PPaayyiinngg ttaaxxeess.. This topic addresses the taxes that a medium-sized company must pay or withhold in a given year, and the administrative burden associated with paying taxes. From the perspective of this study, the most pertinent measure is the time taken to prepare, file and pay (or withhold) the corporate income tax, the value
added tax and social security contributions, measured in hours per year.
● DDeeaalliinngg wwiitthh lliicceennsseess.. This topic records all procedures required for a business in the construction industry to build a standardised warehouse. These include obtaining all necessary licenses and permits, completing all required notifications and inspections and submitting the relevant documents to the authorities. Procedures for obtaining utility connections are also recorded. A survey divides the process of building a warehouse into distinct procedures and calculates the time and cost of completing each procedure under normal circumstances. From the perspective of this study, the time, in days, to build a warehouse is the most appropriate measure.11
● SSttaarrttiinngg aa bbuussiinneessss.. This topic identifies the steps an entrepreneur must take to incorporate and register a new firm. It examines the procedures, time and cost involved in launching a commercial or industrial firm with up to 50 employees and start-up capital of 10 times the economy’s per capita gross national income.
From the perspective of this study, the most relevant measure is the time, in days, needed to set up a new firm.
Figure 10 sets out the time taken to pay taxes for 2005. Ireland performs well against this indicator comparatively, ranking third of the EU15 countries that provided data, behind France and Spain, and fifth of all the countries included in the sample
Score
0 0.5 1 1.5 2 2.5
Austria Belgium Denmark Finland France Germany Greece Ireland Italy Luxembourg Netherlands Portugal Spain Sweden UK EU 15 Cyprus Czech Republic Estonia Hungary Latvia Lithuania Malta Poland Slovak Republic Slovenia EU 25 Australia Canada New Zealand USA Norway Switzerland
Source: Kaufmann, Kraay and Mastruzzi, 2005
Figure 9: Regulatory quality 2004
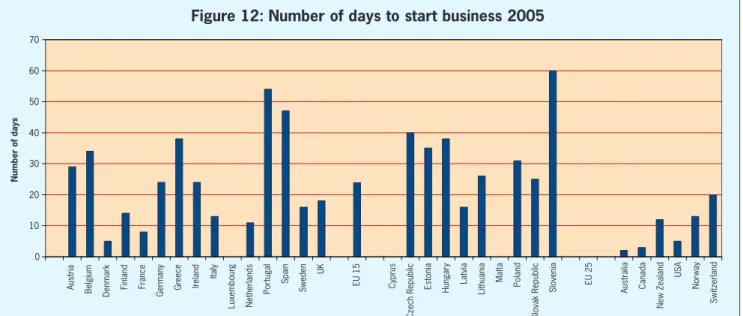
here. Figure 11 shows the number of days to deal with warehouse licensing for 2005. Here, Ireland scores around the average for the EU15, with Denmark and Finland taking significantly less time than other EU countries. Figure 12 shows the number of days needed to start a business for 2005.
Again, Ireland’s score is around the average for the EU15, with Denmark and France taking the least time to deal with the necessary procedures.
Australia, Canada and the USA all take particularly little time to process the setting up of a new business.12
Conclusions and discussion
Some tentative findings
In terms of findings arising from the analysis, a number of general points emerge.
Ireland tends to come out of the analysis of the quality and efficiency of public administration relatively well, particularly when using the most recent data available. Ireland is in with a cluster of countries – Austria, Sweden, the Netherlands and Luxembourg in the EU, Australia, Canada, New Zealand, Norway and Switzerland of other OECD
0 100 200 300 400 500 600 700 800 900 1000
Austria Belgium Denmark Finland France Germany Greece Ireland Italy Luxembourg Netherlands Portugal Spain Sweden UK EU 15 Cyprus Czech Republic Estonia Hungary Latvia Lithuania Malta Poland Slovak Republic Slovenia EU 25 Australia Canada New Zealand USA Norway Switzerland
Number of hours
Source: World Bank and the International Finance Corporation, 2006
Figure 10: Time taken to pay taxes 2005
0 50 100 150 200 250 300 350
Austria Belgium Denmark Finland France Germany Greece Ireland Italy Luxembourg Netherlands Portugal Spain Sweden UK EU 15 Cyprus Czech Republic Estonia Hungary Latvia Lithuania Malta Poland Slovak Republic Slovenia EU 25 Australia Canada New Zealand USA Norway Switzerland
Number of Days
Source: World Bank and the International Finance Corporation, 2006
Figure 11: Number of days to deal with warehouse licensing 2005
countries – that tend to consistently score well across the range of indicators examined here.
Ireland ranks particularly well against the indicators examining regulatory quality and efficiency.
Denmark and Finland tend to consistently be ranked particularly highly across the range of indicators examined. Of the newer EU member states, Estonia consistently scores well.
However, the cautions about data reliability and validity mentioned above should be borne in mind when drawing conclusions. The ‘state of the art’ of measuring public administration performance is not at a stage where precise judgements can be made.
How does Ireland’s ranking compare to national level information? Does the suggestion of a relatively good performance by Ireland equate with national opinions on the quality and efficiency of public administration? Some information is available for the civil service, based on surveys commissioned by the Department of the Taoiseach (Department of the Taoiseach, 2006a, 2006b). A survey of business opinion found that 69 per cent of those surveyed feel that the civil service is very or fairly efficient. This is the case whether or not they had had direct contact with the civil service in the previous twelve months. However, the proportion of respondents who consider the civil service to be very inefficient is much higher amongst those who had no contact (see Figure 13). In 2002, in a comparable survey, 46 per cent of respondents felt the civil service was very or fairly efficient. So there was a notable increase from 2002 to 2006.
0 10 20 30 40 50 60 70
Austria Belgium Denmark Finland France Germany Greece Ireland Italy Luxembourg Netherlands Portugal Spain Sweden UK EU 15 Cyprus Czech Republic Estonia Hungary Latvia Lithuania Malta Poland Slovak Republic Slovenia EU 25 Australia Canada New Zealand USA Norway Switzerland
Number of days
Source: World Bank and the International Finance Corporation, 2006
Figure 12: Number of days to start business 2005
Figure 13: National opinions on civil service efficiency
Civil Service Efficiency: experiences versus impressions Q: Thinking of the civil service in overall terms, I would like you to give me your impression of how efficient you feel it is…
((aa)) BBuussiinneessss ssuurrvveeyy
Base: All respondents (300)
Civil Service Efficiency: experiences versus impressions Q: Thinking of the civil service in overall terms, I would like you to give me your impression of how efficient you feel it is…
((bb)) CCuussttoommeerr ssaattiissffaaccttiioonn ssuurrvveeyy
16%
14%
54%
56%
11%
14%
5%
12%
14%
5%
Very efficient
ContactNo Contact
Fairly efficient No opinion either way Fairly inefficient Very inefficient
23%
10% 44%
49%
36%
10%
9%
13% 5%
2%
0% 20% 40% 60% 80% 100% 120%
1 2
ContactNo Contact
Very efficient Fairly efficient No opinion either way Fairly inefficient Very inefficient
Base 2006: All respondents (1,226)
Source: Department of the Taoiseach, 2006a and b, survey work undertaken by Ipsos MORI
The Department of the Taoiseach (2006b) also conducted an opinion survey of the general popula- tion, not just business opinion. It is interesting to compare the findings, to see if there are differences between the public perception of efficiency and business leaders perceptions. In 2006, 62 per cent of the public see the civil service as very or fairly efficient. This is a slight improvement on 2002, but identical to figures recorded in a 1997 survey.
Whether or not members of the public had contact with the civil service over the previous twelve months makes a big difference in how they see efficiency (see Figure 13). Of those who had contact, 72 percent consider the civil service to be very or fairly efficient. This contrasts with 54 per cent of respondents with no contact with the civil service.
In all, these broadly positive perceptions of the efficiency of the civil service would support the good ranking received by Ireland in the perception- based surveys noted above.
Data sources and data limitations:
conclusions and emerging lessons
A key lesson emerging from this study is that data limitations severely restrict the ability to reach meaningful conclusions about Ireland’s compara- tive administrative performance. In drawing conclusions about the indicators used in this study, a number of points merit highlighting:
● The World Bank governance indicators are subject to severe methodological limitations. The OECD (Arndt and Oman, 2006) critique suggests that there is little to be gained from analysis of the governance indicators in their current form.
Further use of the World Bank governance indicators as a source of information on comparative administrative performance should be contingent on the identified weaknesses being addressed.
● The IMD based indicators of quality of public administration are also the subject of methodo- logical concerns. The small sample size and restriction to the business community are significant limitations. Also, the indicators only partly capture issues around the quality and efficiency of public administration, and have a limited conceptual foundation in this regard. The combining of the information to produce an aggregate indicator of the quality of public administration, while attractive as a presentational device, has its own limitations,
suggesting a possibly deceptive degree of precision in comparative ranking. Despite such limitations, however, the IMD based indicators do provide one source of information on business perceptions on administrative performance on a consistent basis over time. The ability to separately examine the individual indicators that contribute to the aggregate indicator enables investigation of particular variables. The IMD based indicators could continue to be used, provided the limitations associated with them are made explicit, and they are part of a broader assessment framework.
● The World Bank Doing Businessindicators have limitations in terms of their coverage of aspects of administrative performance, dealing as they do with specific business related matters. They are also a mix of fact and perception based data developed on the basis of realistic but hypothetical situations with regard to service delivery. But these indicators are an interesting approach to developing a more bottom-up picture of aspects of administrative performance based on the views of service users. As such they attempt to address real life issues faced by public administration users. The further development and expansion of such indicators offers the potential to contribute to assessing comparative administrative performance.
Ways forward: is there a future for the assessment of comparative administrative performance?
A key question overall is what value the inter- national comparative information gathered here has? Pollitt (2005) is sceptical of the benefits of international rankings, referring to what he calls ‘a huge demand for duff data’ and questioning if any decisions can be informed and improved by this type of data. Given the data limitations, such concerns should be taken seriously. But notwith- standing the point made by Pollitt, it is possible to envisage some tentative uses for such information:
● The level of public debate about the quality and efficiency of the Irish public administrative system tends to be conducted in the absence of any form of data, limited or not. Opponents of public service provision as it currently operates tend to come out with statements such as ‘Ireland is among the worst in Europe with regard to public service provision’. Proponents tend to espouse the opposite view. Limited as the data
gathered together here is, it does provide some evidence to inform the debate. Ireland’s public administration does not appear to be the best around, but it is a long way from being seen as the worst.
● The Taoiseach, in a speech at the Institute of Public Administration’s annual conference (Ahern, 2006) indicated that he sees merit in assessing how the Irish public service as a whole performs relative to its international peers. In particular he notes ‘…it would be useful to identify how we compare with those who are recognised as representing good practice in various different aspects of public administration and policy’. There are some suggestions from this review of a limited number of countries that seem to rank consistently well with regard to public administration quality and efficiency.
● The data can be used to prompt discussion and debate on the performance and productivity of public services. This issue has come to the forefront in recent years, with organisations such as the National Competitiveness Council looking to improve the way public sector productivity is assessed. Limited as it is, the data here can be a starting point for discussions about the need for more robust measurements.
Looking forward, with regard to improving the available data, a number of initiatives could facilitate the creation of a more rounded and robust set of indicators for use in the comparative assessment of administrative performance:
● Better survey data on public administration quality and efficiency, to complement the IMD based indicators, could be encouraged. A number of countries periodically survey citizens on administrative performance, as evidenced by the surveys sponsored by the Department of the Taoiseach quoted in the section above. The development of a common core set of questions to be asked in such surveys could help produce comparative indicators with good sample sizes and based on both business and public perceptions. The OECD could be encouraged to take on this role liaising with governments, surveying firms and academic networks to facilitate a coordinated approach in this area.
● The continuing development of the World Bank
Doing Businessindicators should be encouraged.
Also, the wider development of bottom-up indicators of administrative performance offers a potentially fruitful approach to the establish- ment of comparative indicators of administrative performance. As Boyle (2006) notes in relation to work undertaken by Putnam (1993) in a comparative study of bureaucratic responsive- ness of Italian regional governments, such indicators help provide a picture of what value is being delivered by public services. The National Economic and Social Forum (NESF), (forth- coming) state that: ‘A focus by service providers on how people actually experience services by mapping the customer/user journey will help to improve service design and foster innovation to service delivery.’ Again, survey firms and academic networks could be encouraged to do more work in this area.
● The OECD is engaged in the development of a comparative country data set on management in government with a view to the publication of an annual report entitled Government at a Glance.13 It is important that this data set is facilitated by member states as it has the potential to be an authoritative source of indicators on administra- tive performance. It should provide a rich data source on a number of aspects of the practice of public administration.
● Many of the indicators examined here rely on survey data and portray a subjective perception of public administration quality. Van de Walle (2006) notes that: ‘A potential danger of this measurement by subjective proxy is that the indicators merely return the popular image of the administration, rather than the actual function- ing’. There is a need to develop ‘hard’ data to complement the subjective data – for example, information on costs per employee. There is scope for more micro-level comparisons of inputs and outputs at organisational or sectoral levels rather than just taking public administra- tion as a whole. The Atkinson review in the UK (Atkinson, 2005) suggests improvements in sectoral output and input indicators for national accounts purposes. Also, the OECD Government at a Glanceinitiative should prove helpful with regard to input and output data as it develops over time.
APPENDICES
Score out of 10
0 1 2 3 4 5 6 7
Austria Belgium Denmark Finland France Germany Greece Ireland Italy Luxembourg Netherlands Portugal Spain Sweden UK EU 15 Cyprus Czech Republic Estonia Hungary Latvia Lithuania Malta Poland Slovak Republic Slovenia EU 25 Australia Canada New Zealand USA Norway Switzerland
Source: IMD, 2006
Bureaucracy does not hinder business activity (2006)
Score out of 10 Austria Belgium Denmark Finland France Germany Greece Ireland Italy Luxembourg Netherlands Portugal Spain Sweden UK EU 15 Cyprus Czech Republic Estonia Hungary Latvia Lithuania Malta Poland Slovak Republic Slovenia EU 25 Australia Canada New Zealand USA Norway Switzerland
0 1 2 3 4 5 6 7 8 9
Source: IMD, 2006
Transparency of government policy is satisfactory (2006)
Appendix 1
Score out of 10
0 1 2 3 4 5 6 7 8 9
Austria Belgium Denmark Finland France Germany Greece Ireland Italy Luxembourg Netherlands Portugal Spain Sweden UK EU 15 Cyprus Czech Republic Estonia Hungary Latvia Lithuania Malta Poland Slovak Republic Slovenia EU 25 Australia Canada New Zealand USA Norway Switzerland
Source: IMD, 2006
Government decisions are effectively implemented (2006)
0 1 2 3 4 5 6 7 8 9 10
Score out of 10 Austria Belgium Denmark Finland France Germany Greece Ireland Italy Luxembourg Netherlands Portugal Spain Sweden UK EU 15 Cyprus Czech Republic Estonia Hungary Latvia Lithuania Malta Poland Slovak Republic Slovenia EU 25 Australia Canada New Zealand USA Norway Switzerland
Source: IMD, 2006
Bribing and corruption do not exist in the economy (2006)
Score out of 10
0 1 2 3 4 5 6 7 8 9 10
Austria Belgium Denmark Finland France Germany Greece Ireland Italy Luxembourg Netherlands Portugal Spain Sweden UK EU 15 Cyprus Czech Republic Estonia Hungary Latvia Lithuania Malta Poland Slovak Republic Slovenia EU 25 Australia Canada New Zealand USA Norway Switzerland
Source: IMD, 2006
Justice is fairly administered (2006)
Score out of 10
0 1 2 3 4 5 6 7
Austria Belgium Denmark Finland France Germany Greece Ireland Italy Luxembourg Netherlands Portugal Spain Sweden UK EU 15 Cyprus Czech Republic Estonia Hungary Latvia Lithuania Malta Poland Slovak Republic Slovenia EU 25 Australia Canada New Zealand USA Norway Switzerland
Source: IMD, 2006
Public service independence from political interference (2006)
Appendix 2
Score out of 10
0 1 2 3 4 5 6 7 8
Austria Belgium Denmark Finland France Germany Greece Ireland Italy Luxembourg Netherlands Portugal Spain Sweden UK EU 15 Cyprus Czech Republic Estonia Hungary Latvia Lithuania Malta Poland Slovak Republic Slovenia EU 25 Australia Canada New Zealand USA Norway Switzerland
Source: IMD, 2006
Legal and regulatory framework encourages the competitiveness of enterprises (2006)
0 1 2 3 4 5 6 7 8
Score out of 10 Austria Belgium Denmark Finland France Germany Greece Ireland Italy Luxembourg Netherlands Portugal Spain Sweden UK EU 15 Cyprus Czech Republic Estonia Hungary Latvia Lithuania Malta Poland Slovak Republic Slovenia EU 25 Australia Canada New Zealand USA Norway Switzerland
Source: IMD, 2006
Regulation intensity does not restrain the ability of companies to compete (2006)
Dealing with Licences in Ireland
The table below summarises the procedures, time and costs to build a warehouse in Ireland N
Naattuurree ooff PPrroocceedduurree ((22000055)) PPrroocceedduurree DDuurraattiioonn SSttaarrtt EEnndd UUSS$$ ((ddaayyss)) ddaayy ddaayy CCoosstt
Obtain planning permission 1 90 1 90 5,266.89
Obtain C2 (taxation registration)
certificate 2 50* 41 90 0.00
Receive on-site inspection before
planning permission is granted 3 1* 90 90 0.00
Notify the Health and Safety Authority
about commencement of construction 4 1 91 91 0.00
A
Afftteerr ccoonnssttrruuccttiioonn iiss ccoommpplleetteedd
Obtain Fire Safety Certificate 5 90 92 181 1,125.40
Receive final inspection 6 1* 181 181 0.00
U Uttiilliittiieess
Obtain electrical connection 7 89* 93 181 1,511.42
Obtain water connection 8 42* 140 181 0.00
Receive visit from waterworks
department of Dublin City Council 9 1* 141 141 0.00
Obtain phone connection 10 16* 166 181 173.50
T
Toottaallss:: 1100 118811 $$88,,007777..2211
* This procedure runs simultaneously with previous procedures.
Source: World Bank and the International Finance Corporation, 2006
Appendix 3
1. The SCP study relied primarily on 2003 data, the ECB study on 2000 data, and the World Bank on 2002 data.
2. The IMD World Competitiveness Yearbook 2006 notes that its executive opinion survey is sent to executives in top and middle management in all the countries covered by the yearbook. The sample ‘represents a cross- section of the business community in each country or region. The distribution reflects a breakdown of industry by sectors: primary, manufacturing and services, and in order to be statistically representative, we select a sample size which is proportional to the GDP of each economy’ (IMD, 2006). In 2006, they received 4,055 responses to their executive opinion survey from 61 countries, an average of 66 returns per country.
3. The World Bank governance indicators explicitly address the issue of error associated with the point estimates arrived at. They present statistically derived margins of error for each country and period, as can be seen in the figures that appear in the text of this paper.
4. The IMD executive opinion survey asks respondents to rate, on a scale from 1 to 10, their response to statements. Usually 1 repre- sents a ‘low’ or ‘poor’ score (for example, bureaucracy hinders business activity) and 10 represents good performance (bureaucracy does not hinder business activity). For the corruption indicator, the SCP used the Transparency International index rather than the IMD survey data. The Transparency International index (TI) is made up of an aggregation of different indices including the IMD indicator, World Economic Forum indicator, World Bank indicator and Gallup International indicator. The SCP found that the IMD and TI indicators are highly correlated, and this was confirmed in the context of this study. For ease of measurement and computation, the IMD index of corruption is used in this study.
5. If the IMD indicator of corruption is substituted for the Transparency International indicator, Ireland drops to ninth of the EU15.
6. Some of these indicators have been amended or added to the list of indicators by the IMD since the SCP study was undertaken.
7. This indicator was used as one of the indicators of administrative performance in the ECB study (Afonso, Schuknecht and Tanzi, 2003).
8. According to the Central Statistics Office (2006), in 2005 GNI was 85.5 per cent of GDP.
The only other country of the EU15 where the difference between GDP and GNI is more than 10 per cent is Luxembourg. Spain has the next largest variation, at less than 2 per cent.
9. Details on the governance indicators used can be accessed from the World Bank Institute governance and anti-corruption web site:
www.worldbank.org/wbi/governance (last accessed 4th September 2006).
10. This issue is pertinent also for the IMD data that forms the basis of the analysis in sections 3 and 4, but less so in this case. The majority of the IMD data used refer to administrative perform- ance rather than political performance.
11. As an example of the approach taken, Appendix 3 outlines the results for Ireland of the procedures, time and costs to build a warehouse. In this case, it can be seen that the procedures involve both central and local government, and so examine a ‘whole of government’ aspect of public administration quality and efficiency.
12. Data on paying taxes and dealing with licenses first appeared in World Bank and the Intern- ational Finance Corporation (2006). It is not, therefore, possible to produce trends over time.
13. The intention of the OECD Government at a Glance project is to work towards the publication, in 2009, of a document entitled Government at a Glancethat will be produced on an annual basis and show comparative cross- national data (OECD, 2005).
Notes
Afonso, A., L. Schuknecht and V. Tanzi (2003), Public Sector Efficiency: An International Comparison, Working Paper No. 242, European Central Bank Working Paper Series, Frankfurt:
European Central Bank
Ahern, B. (2006), Speech by the Taoiseach, Mr.
Bertie Ahern TD, at the IPA national conference on Moving Towards the Public Sector of the Futurein the Grand Hotel, Malahide, 8th June Arndt, C. and C. Oman (2006), Uses and Abuses of
Governance Indicators, Paris: OECD
Atkinson (2005), Atkinson Review: Final Report – Measurement of Government Output and Productivity for the National Accounts, Basingstoke: Palgrave Macmillan
Boyle, R. (2006), Measuring Public Sector Productivity: Lessons from International Experience, Committee for Public Management Research Discussion Paper No. 35, Dublin:
Institute of Public Administration
Central Statistics Office (2006), Measuring Ireland’s Progress: 2005, Dublin: Stationery Office
Department of the Taoiseach (2006a), Irish Civil Service Customer Satisfaction Business Survey 2006 Report, research study conducted by Ipsos MORI, Dublin: Department of the Taoiseach Department of the Taoiseach (2006b), Irish Civil
Service Customer Satisfaction Survey 2006 Report, research study conducted by Ipsos MORI, Dublin: Department of the Taoiseach
IMD (2006), World Competitiveness Yearbook 2006, Lausanne: Institute for Management Develop- ment
Kaufmann, D., A. Kraay and M. Mastruzzi (2005), Governance Matters IV: Governance Indicators for 1996-2004, World Bank Policy Research Working Paper 3630, Washington, DC: The World Bank
National Economic and Social Forum (forth- coming), Improving the Delivery of Quality Public Services, NESF Report 34, Dublin:
National Economic and Social Forum.
OECD (2005), Management in Government:
Feasibility Report on the Development of Comparative Data, GOV/PGC(2005)10, 31st October, Paris: OECD
Pollitt, C. (2005), ‘Response to opening presentation and background paper by Christopher Hood and Craig Beeston’, paper presented at ESRC Public Services Programme seminar on international public service rankings, 13th December, London:
ESRC
Putnam, R. D. (1993), Making Democracy Work:
Civic Traditions in Modern Italy, Princeton, NJ:
Princeton University Press
Social and Cultural Planning Office (2004), Public Sector Performance: An International Compari- son of Education, Health Care, Law and Order and Public Administration, The Hague: Social and Cultural Planning Office
Van de Walle, S. (2006), ‘The state of the World’s bureaucracies’, Journal of Comparative Policy Analysis, Vol. 8, No. 4, pp. 437-448
World Bank and the International Finance Corporation (2006), Doing Business in 2006, Washington, D.C.: World Bank