Policy Research Working Paper 6223
Making Up People
The Effect of Identity on Preferences and Performance in a Modernizing Society
Karla Hoff Priyanka Pandey
The World Bank
Development Research Group Macroeconomics and Growth Team October 2012
WPS6223
Public Disclosure AuthorizedPublic Disclosure AuthorizedPublic Disclosure AuthorizedPublic Disclosure Authorized
Produced by the Research Support Team
Abstract
The Policy Research Working Paper Series disseminates the findings of work in progress to encourage the exchange of ideas about development issues. An objective of the series is to get the findings out quickly, even if the presentations are less than fully polished. The papers carry the names of the authors and should be cited accordingly. The findings, interpretations, and conclusions expressed in this paper are entirely those of the authors. They do not necessarily represent the views of the International Bank for Reconstruction and Development/World Bank and its affiliated organizations, or those of the Executive Directors of the World Bank or the governments they represent.
Policy Research Working Paper 6223
It is typically assumed that being hard-working or clever is a trait of the person, in the sense that it is always there, in a fixed manner. However, in an experiment with almost 600 boys in India, cues to one’s place in the traditional caste order turn out to influence the expression of these traits. The experiment assigned students to different treatments with respect to the salience of caste and had them solve mazes under incentives. It turned out that making caste salient can reduce output by about 25 percent, which is equivalent to twice the effect on output of being one year younger.
The channels through which this occurs differ by caste status. For the upper castes, the decline in performance under piece rates can only be explained by a shift in preferences regarding the provision of effort. When the ascriptive caste order is cued, upper-caste individuals
This paper is a product of the Macroeconomics and Growth Team, Development Research Group. It is part of a larger effort by the World Bank to provide open access to its research and make a contribution to development policy discussions around the world. Policy Research Working Papers are also posted on the Web at http://econ.worldbank.org. The author may be contacted at Khoff@worldbank.org.
may think, “I don’t need to excel.” In contrast, for the lower castes, which were traditionally “untouchables,”
publicly revealing caste identity impairs the ability to learn and may lead individuals to think, “I can’t (or don’t dare to) excel.” This paper provides a measure of the impact that ascriptive, hierarchized identities can have on preferences and performance after a society—in its public pronouncements and legislation—has adopted norms of equality in a formal sense.
The findings are important because they suggest that when contexts cue identities founded on the superseded rules of a hierarchical institution, the effects on human capital formation and development can be first-order.
Contexts that make traditional identities salient are an underemphasized source of impediments to institutional change.
Making Up People— The Effect of Identity on Preferences and Performance in a Modernizing Society
Karla Hoff and Priyanka Pandey
JEL classification: C93, D02, D03, I2, O15
Key words: Randomized experiment; Framing effect; Social identity; Institutional change;
Stereotype threat Sector Board: sdv
Corresponding author: Hoff (khoff@worldbank.org), 1818 H St.,Washington DC 20433 USA.
202-522-3518 (fax) 240-473-4077 (phone) Pandey (ppandey@worldbank.org
)
Acknowledgements. We thank the following people for very helpful comments and encouragement: Rachel Croson, Anjini Kochar, Leigh Linden, Tauhidur Rahman, Vijayendra Rao, Joe Stiglitz, and Ann Swidler. We thank seminar participants at Carnegie Mellon /University of Pittsburgh, Delhi School of Economics, George Mason University, and Yale. We owe a special debt to Anaka Narayanan, Ram Pratap, and Mayuresh Kshetramade for assistance with data collection and to Shweta Arya, Sonal Vats, and Sam Zhongxia Zhang for research assistance.
This work was made possible by grants from the World Bank-Netherlands Partnership Program, the World Bank Research Support Budget, and the MacArthur Foundation Research Network on Inequality and Economic Performance.
2 1. Introduction
A number of models in economics give different answers to the question of how someone’s identity—an individual’s sense of the social categories to which he belongs—might affect his preferences and behavior. We present an experiment that allows us to discriminate among some of these models. We report evidence that situational cues to identity can alter preferences to work hard, the ability to learn new skills, and the response to competitive environments. In particular, we provide a measure of the impact that ascriptive, hierarchized identities can have on preferences and performance after a society—in its public pronouncements and legislation—has adopted norms of equality in a formal sense.
Our findings are important because they suggest that when contexts cue identities founded on the superseded rules of a hierarchical institution, the effects on human capital formation and development can be first-order. Contexts that make traditional identities salient are an underemphasized source of impediments to institutional change.
A central goal in many disciplines is to understand how identity affects behavior.
Historians have documented that societies all over the world have systematically invented identities and used symbols, etiquette, rituals, dress codes, and segregation to impress on people the notion that individuals in different groups represented significantly different categories and were subject to different constraints. For example, in Growing up Jim Crow: How Black and White Southern Children Learned Race, Jennifer Ritterhouse (2006, p. 4) describes how the unwritten rules that governed interactions across race lines were used “not only as a form of social control but also as a script for the performative creation of…‘race’ itself.” In Power in the Blood, David Warren Sabean (1984, p. 59) shows how elites in early modern Germany used the Catholic sacrament to impress on peasants a caste-like hierarchy:
“The ordeal [of the sacrament] demanded more than just external compliance [as it entailed] massive inroads into their consciousness….It was through the sacrament that various state officials attempted to mediate their conceptions of the person, guilt, conscience, and justice.…”
Anthropologists emphasize that the assumption in standard economic models of
autonomous individuality belies the fact that “we inevitably think with concepts that have been developed by others” (Collier, 1997, p. 5). Our title alludes to and amplifies the title of an essay,
“Making Up People,” in which the philosopher Ian Hacking (1986) argues that the creation of
3
new slots in which to fit and categorize people, e.g. the perverted, the suicidal, and the heterosexual or homosexual person, molds individuals’ sense of themselves and hence their behavior.
Of interest to us is here is how identity affects preferences over effort, the ability to learn, and the response to competitive environments. A standard view, which derives from Max Weber, is that culture—as a matter of self-conscious orientation or identity—imparts values that are consistent across situations. The values explain action. However, there is an alternative view, drawing on cognitive psychology, that culture is fragmented and contradictory: a given culture provides multiple frames, understandings, and worldviews, and they may not be
consistent with one another. According to the sociologists Ann Swidler (1986, 2001) and Paul DiMaggio (1997), culture shapes behavior through frames that are situationally evoked and that determine which actions seem possible and desirable in that situation, given a person’s values.
Background settings or contexts can alter motives and behavior by evoking a particular aspect of the self or a particular worldview and by altering the framework of meanings that help to
constitute one’s social identity.
To test this hypothesis, we draw on our experiment in rural India that manipulates the salience and publicness of caste identity.
1Under the traditional caste system, preeminence was assigned to birth rather than competition (Béteille, 2011, II[2003], p. 11):
“For centuries it was believed that a man’s social capacities were known from the caste or the lineage into which he was born, and that no further test was necessary to determine what these capacities were.” (p. 99, emphasis added)
A body of work in anthropology supports the view that individual mobility
2was nearly impossible in the traditional caste system for someone who remained in or near his village,
1Hoff
and Pandey (2006) summarize the treatments that use only piece rate incentives (N =336) but do not present the treatments that use both piece rate and tournament incentives (N=246).
2
As distinct from collective mobility up or down the caste hierarchy. The caste system is the product of
politics and, thus, local political forces bring about changes in the local caste hierarchy and also in the
number of distinct castes over the medium- to long-term (Rao and Ban 2007). In addition, when caste
identity takes on significance for government incentives, some individuals are able to manipulate their
official caste designation, but even this process is slow. Thus Cassan (2011) estimates that over the
course of 20 years, in response to British classification of some castes as “agricultural castes” whose
members could own land, and others as “non-agricultural castes” whose members could not, 7.5% of the
4
where his caste identity would be known (e.g. Gupta 2000, Srinivas 2009). A low-caste boy could not move up, a high-caste boy could not move down.
At the bottom of the traditional caste hierarchy are the castes whose members were traditionally marked as “unclean.” They were called untouchables and are today called Dalits.
Untouchability has several dimensions: exclusion from public spaces and water sources,
humiliation (including prohibition from all but menial occupations), and exploitation by the high castes (Desphande, 2011, p. 9). Untouchability is illegal under the Constitution of India, and attitudes towards Dalits are radically different today from what they were in the recent past (Kapur et al. 2010). But the social division persists. Bros and Couttenier (2011) use official Indian crime statistics for 2001 to demonstrate the systematic use of violence across India to enforce untouchability rules. Two surveys give some indication of how untouchability plays out in schools:
“One common example of social prejudice in the classroom is the disparaging attitude of upper caste teachers towards Dalit children. This can take various forms, such as telling Dalit children that they are ‘stupid,’ making them feel inferior, using them for menial chores, and giving them liberal physical punishment.” (PROBE, 1999, p. 51)
“In one out of four primary schools in rural India, Dalit children are forced by their teachers or by convention to sit apart from non-Dalits. As many as 40 percent of schools practice untouchability while serving mid-day meals, making Dalit children sit in a separate row while eating.” (Shah et al., 2006, p.168, based on a 2001-02 national survey)
Participants in our experiment were 288 junior high school boys drawn from the top of the caste hierarchy (the “General Castes”, hereafter “high castes”), and 294 junior high school boys drawn from the bottom of the caste hierarchy (the Dalits, hereafter “low castes”). In groups of six, participants solved mazes under incentives under one of three conditions that varied the publicness and salience of caste.
In the first condition, caste identity, which is not discernible from natural physical markers,
3was not made public in a session of three high-caste and three low-caste boys. Since population that had an incentive to change their identity from a non-agricultural to an agricultural caste member were able to do so.
3
See Deliège (1999) and Gupta (2000). In contrast, Hindu surnames do constitute a marker of caste. For
that reason some low-caste groups have sought a constitutional amendment to abolish Hindu surnames
(The Telegraph, October 15, 2005, “Slash Surname to Kill Caste”).
5
there is a large overlap in poverty between high-and low-caste households in the local population, quality of dress is not an automatic sign of caste status. Thus we call the first condition “Caste Not Revealed.”
In the second condition (“Revealed Mixed”), caste identity was made public. As in the first condition, a session was composed of three high-caste boys and three low-caste boys.
The third condition (“Revealed Segregated”) was the same as the second except that a session was composed of only high-caste boys or only low-caste boys. Participants would likely have been aware that the composition of their session reflected deliberate segregation by caste status. This is so because participants were brought to the experiment site in groups with an equal number of high-caste and low-caste boys. Then each boy waited while other participants arrived until he was called in to be part of a newly formed group of six to participate in the experiment. Given the caste shares in the population of schoolchildren, the probability that a group of only high-caste or only low-caste students could result from a random draw of the local school population is very small (less than (0.2)
6= 0.00006). As discussed above, enforced segregation of the low caste is a sign of high-caste dominance.
We have three main findings, and they are robust to our controls for individual characteristics.
Result 1. Under piece rate incentives Revealed Segregated reduces high-caste
performance. High-caste participants solve 26% fewer mazes in Revealed Segregated than they
do when caste is not revealed, controlling for individual characteristics. Under the piece rate
incentive, the output and payoff of a participant are completely independent of the output of the
other participants. A participant’s output thus depends only on his ability and his preferences
over the provision of effort. There is no plausible reason why the ability of a high-caste
participant would be impaired in the Revealed Segregated condition. On the contrary, a large
body of literature in psychology, discussed in the next section, finds that if cued for an aspect of
one’s identity that is stereotyped as gifted, or if asked to recall memories of being powerful, an
individual becomes better able to perform cognitive tasks. To our knowledge there is only one
study, by Shih et al. (2008), that finds an ambiguous effect on performance of activating a
positive stereotype about a group’s intelligence, an effect that the authors explain as the result of
anxiety from the fear of failure to meet high expectations. But we are able to show that the
activation of high-caste identity in Revealed Segregated does not lower self-confidence and does
6
not cause anxiety that interferes with the ability to learn. Given this, we conclude that the decline in high-caste performance in Revealed Segregated reflects a change in preferences regarding the provision of effort.
Our preferred interpretation is that the Revealed Segregated condition evokes a mental frame in which high-caste participants feel less need to achieve. Recalling the quotation from Béteille, in the traditional caste system high-caste individuals’ preeminence was assigned by birth and “no further test was necessary to determine what these capacities were.” A
considerable literature in psychology and economics, discussed below, suggests that preferences are context-dependent. They are influenced by arbitrary “anchors,” the presentation (“framing”) of the choice problem, and cues to identity.
Result 2. Under piece rate incentives Revealed Segregated reduces low-caste
performance, and Revealed Mixed creates a caste gap in favor of the high caste. When caste is not revealed, low-caste boys solve mazes just as well as high-caste boys, whereas making caste public reduces mean low-caste relative to high-caste performance in Revealed Mixed. The caste gap is 20% controlling for individual characteristics. We infer that in other possible worlds the low castes could have been an equal or dominant group; there are no intrinsic differences in ability between high and low castes; a social identity has affected behavior. This result extends to a new social group, low-caste individuals of India, a large body of work in psychology that demonstrates that cues to a person’s identity if it is stereotyped as intellectually inferior undermine the person’s ability to perform cognitive tasks (“stereotype threat”).
Result 3. Making caste identity public eliminates the positive output response to
competitive environments by both the high and low castes. When caste identity is not public,
high-caste participants solve 25% more mazes under winner-take-all tournament incentives than
under piece rates. The comparable figure for the low caste is 28%. In contrast, when caste is
made public, performance does not improve under tournament incentives. Indeed, in the
segregated sessions, the low-caste participants solve 38% fewer mazes under tournament
incentives than under piece rate incentives, controlling for individual characteristics. Our
interpretation of this perverse response has two elements. First, the Revealed Segregated
condition cues a worldview in which preeminence is assigned to birth, not competition, and in
which for a low-caste person to perform well in a non-menial task may not be liked. This
worldview is very likely encountered in early childhood experiences of growing up low caste, in
7
fables that children learn, and in the continued atrocities against upwardly mobile low-caste individuals.
4A second explanation relies on strategic responses. It could be that the low-caste boys have internalized beliefs about their ability that are encapsulated in the caste system, with the result that they try less hard in a tournament facing only low-caste boys, who they believe are less able, than in a tournament facing both high- and low-caste competitors.
To help organize the discussion of our experimental results, in the next section we outline five theories about how a sense of identity with others might affect preferences and behavior.
Sections 3-5 present the experiment and results. Section 6 presents additional support for our identity-based arguments. In the concluding section, we argue that our findings suggest the need for a view of development that takes into account the multiple ways of “making up people.”
2. Five Theories about Identity and Preferences/Behavior
Theory 1: Identity has no effect on preferences. In the textbook model in economics, an individual has fixed preferences in which a sense of identity with others has no influence.
This theory is one of the fundamental differences between the standard model of economics and the conception of the individual that has increasingly been found useful in other social sciences, in which socially defined variables, such as conformity, affect preferences.
Theory 2: Identity is an element of fixed preferences. The theory that an individual has, at any moment in time, a well-defined set of preferences and that they are always salient is maintained in recent work that substantially broadens the notion of preferences by incorporating one’s sense of group membership. In Akerlof and Kranton (2000), a social category constitutes part of an individual’s identity. Associated with the category are a set of norms or ideals for how someone in that category should behave. The individual likes conforming to the ideals of that category, and dislikes actions by others that deviate from the ideals. A related idea in Ray (2006) is that a person’s membership in a particular group shapes his aspirations.
Theory 3: Identity is an element of fixed preferences, but it is chosen. An individual chooses his social identities, i.e. he can define himself and his relationships to others at a
4
E.g. Jadhav 2005. A recent Indian television show provided one of the first public settings where
viewers could watch low-caste individuals talk first-hand about their harsh and horrifying experiences of
growing up as untouchables (www.satyamevjayate.in, episode 10).
8
categorical level (Akerlof and Kranton 2002, Fang and Loury 2005, Hoff and Sen 2006, and Munshi and Rosenzweig 2006, Sen 2006). For example, a descendant of Irish immigrants to the US can define himself as Irish-American or not. The individual’s choice problem makes sense only under the assumption that an individual has a meta-utility function. However, just as in the two models above, an individual has well-defined preferences that provide all the information that is relevant for describing his choices.
Theory 4: In contexts in which it is salient, identity is a framing device that orients action. An individual has an extended utility function that expresses itself automatically in one way or another if stimulated appropriately (Salant and Rubinstein 2008). The work of decades of experiments supports a theory that “allows individual choice to depend on the context in which the choices are made” (Grether and Plott, 1979). Preferences can be shaped by cues that are irrelevant to the rational assessment of alternatives but that trigger memories, cue norms, or make a particular aspect of the self accessible. In the studies of Benjamin et al. (2010) and LeBeouf et al. (2010), individuals were asked to fill out a background questionnaire that focused on an identity. A questionnaire that primed Asian identity made Asian-Americans more
cooperative and patient and less individualistic, and a questionnaire that primed a “family- oriented” identity triggered values related to family obligations. These results support the hypothesis that people have multiple identities and the current context determines which is uppermost. We can make an analogy to DNA. DNA are the instructions for making an
individual, but as yet poorly understood features of the environment determine the “on-and-off states of genes” (www.nature.com/encode).
Where the idea of an extended utility function becomes interesting is that it leads to the observation of inconsistent choices. Of course, if we knew all the stimuli to the individual, then the theory of rationality (i.e. consistency) would be trivial. Since we do not observe all stimuli, and our understanding of the ways that individuals process information is limited, it becomes a useful construct to posit multiple preferences, one for each self-construal or worldview.
Useful for what purpose? It may be useful for understanding long-run social change,
which entails changes in the set of possible identities, the salience of particular identities, and the
possible ways of understanding a situation. In the process of economic development, the stimuli
to an individual can change in a way that leads to the expression of one set of preferences rather
than another. That is, preferences depend on context.
9
Theory 5: “Stereotype susceptibility.” Finally, another body of evidence in psychology relates to the nature of human productivity, rather than preferences. It finds that individuals’
productivity in a given situation depends on their sense of themselves in that situation. In dozens of experiments over many domains (e.g., SATs, chess, and sports), priming a negatively or positively stereotyped aspect of an individual’s identity shifts performance in the direction of the stereotype: African-Americans do worse on scholastic aptitude tests if before the test they are asked to check a box for their race (Steele and Aronson 1995); student athletes at a selective college do worse on academic tests if their identity as an athlete is made salient (Dee, in press);
Asian-American women, if the Asian aspect of identity is made salient, do better on math tests than women in the no-prime condition, but if their gender is made salient, do worse than women in the no-prime condition (Shih, Pittinsky, and Ambady 1999). Children in both lower
elementary grades and middle school grades (but not those in upper elementary grades) showed shifts in performance consistent with the patterns of “stereotype threat” and “stereotype boost”
(Ambady et al. 2001 and Afridi, Li, and Ren 2010).
However, the subtlety of stereotype activation also plays a role in boosting performance.
This is an issue we will have to address in interpreting our findings since we used a strong prime to caste identity. In two experiments, Shih et al. (2002) randomly assigned Asian-American students to one of three treatments: a blatant prime to Asian identity, a subtle prime to Asian identity, or no prime. Following this treatment, participants took a math test. Whereas in both experiments, the subtle prime significantly increased Asian-Americans’ average score on the test, in one of the two experiments the blatant prime significantly decreased it—perhaps by creating for participants anxiety that they would not live up to the high expectations for Asians in the U.S.
Mediating factors in stereotype threat include the ability to concentrate and physiological
reactions, of which “choking” under pressure is an extreme example (Schmader, Johns, and
Forbes 2008). A phenomenon underlying the effects of activating stereotypes, which seems
particularly relevant in the context of caste in India, is the effect on the person’s feelings of
power and control. In experiments that randomly divided individuals into two groups and asked
the first group to recall memories of being powerful, and the second group to recall memories of
being powerless, the former group surpassed the latter in cognitive performance and goal-
directed behavior, whereas the latter group surpassed the former in distractibility and attention to
10
peripheral information (Galinsky, Gruenfeld and Magee, 2003; Guinote, 2006; and Smith et al.
2008). Neuroscience is finding a neural basis for these responses. In a recent study, women taking a math test in conditions of stereotype threat did not recruit the neural regions associated with mathematical learning, but instead showed heightened activation in a neural region
associated with social and emotional processing (Krendl et al. 2008). More broadly,
neuroscientists are finding that early environmental exposure to stress can affect the chemistry of the DNA, with a long-term effect on one’s responses to stress (Begley 2007 and Pollak 2008).
Children who had earlier been exposed to stressful events react more strongly to current sources of stress. We conjecture that for a low-caste child who has encountered stressful events related to his caste identity, increasing the salience of caste is a source of stress, and that his reaction to it would be strong. In contrast, a high-caste child, because of his early experiences, may find comfort and power in contexts in which his caste identity is salient.
We conclude this section by noting that theories 4 and 5, unlike the first three theories, assume that individuals are constrained in their ability to process information (see Kahneman 2003). If working memory were infinitely expandable, then cues to identity could have no impact, since the thinker would already have the associations with all aspects of his identity in working memory. But if working memory is limited, cues can make certain memories and certain meanings that partly constitute one’s identity more accessible. In essence, theories 4 and 5 state that current cues to identity affect what is in the thinker’s working memory and thereby influence, respectively, his current preferences and his current ability to perform.
3. Participants and Design
288 high-caste (hereafter H) and 294 low-caste junior high-school boys (hereafter L) in the district of Hardoi in the Indian state of Uttar Pradesh participated in the study. In the 19
thcentury, this region was characterized by feudal rule. Its legacy today is greater high-caste dominance compared to areas of the state that did not have such rule (Pandey 2010).
Participants in groups of six solved mazes. These six boys were generally drawn from different villages, but since this was not always the case, we will control for the number of other participants that a participant knew. Each participant, just before entering the car that brought him to the experiment site, was asked in private his name, village name, father’s name,
grandfather’s name, and caste. On arriving at the site, we verified in private with each
11
participant his name and caste before randomly assigning him to a treatment and sending him to a large classroom, where participants were entertained for up to an hour while waiting for all the cars bringing participants from other villages to arrive. The focus of the experiment was on the effect of three conditions that varied the publicness and salience of caste identity in the session, which was always led by a high-caste young woman experimenter:
Caste Not Revealed (the control condition). A session was composed of 3 H and 3 L. No personal information about the participants was revealed.
Revealed Mixed (i.e. caste revealed in a mixed-caste session). The composition of a session was the same as in the preceding condition, but now the experimenter began a session by saying that she would like to confirm some information with each participant, who should nod if it is correct. Then the experimenter turned to each participant and stated his name, village name, father’s name, grandfather’s name, and caste.
Revealed Segregated (i.e. caste revealed in a segregated session). This was the same as the preceding condition except that a session was composed of either 6 H or 6 L.
The priming mechanism reflects a way in which caste identity is actually made salient in classroom settings. This increases the external validity of our results. Although an individual’s caste is widely known in a village, publicly referring to a child’s caste is not uncommon in rural schools. There is anecdotal evidence of teachers telling low-caste children to not drink from the tap at the school, lest it pollute the water for others. While implementing this study, we came across some such instances. Caste is commonly recorded in school enrollment books, often using different colors for high and low castes, to identify caste-targeted entitlements such as stipends and uniforms provided by state governments. In villages, people are frequently called by their caste names. Following the common usage in this area and also the way that caste is recorded in school enrollment books, in revealing caste identity we used the traditional name for each caste (Thakur, Chamar, etc.).
5We next describe the incentive schemes. Participants were given a packet of 15 mazes to solve in each of two 15-minute rounds.
6Some participants had piece rate incentives in both
5
In the 1998-99 Indian National Family Health Survey, households were asked to name their caste. Most low-caste respondents gave their actual caste name (e.g. Chamar), but a few used the more generic and politically correct names, Dalit, harijan, or Scheduled Caste (Marriott 2003).
6
The mazes are Xerox copies from http://games.yahoo.com/games/maze.html, level 3. Gneezy, Niederle,
and Rustichini (2003) showed that individuals do not solve mazes just for fun, they respond to incentives.
12
rounds (the “P/P treatments”); others had piece rate incentives in round 1 and tournament incentives in round 2 (the “P/T treatments”). Under the piece rate scheme, a participant earned one rupee per maze solved. Under the tournament scheme, he earned six rupees per maze solved if he solved the most mazes in his session; otherwise he earned nothing. In case of a tie, both winners received the prize. The tournament provided high-powered incentives: a winner could (and some did) earn 15 x 6 rupees, equivalent to almost two days’ unskilled adult wages.
Figure 1 gives the organization of the experiment. Experimental conditions were identical in the first round of treatments (1) and (4), (2) and (5), and (3) and (6), and so we will pool them when reporting first-round results.
Figure 1. Experiment Design
Note. P/P means that the piece rate incentive applies in both rounds of maze-solving. P/T means that the piece rate incentive applies in round 1 and the tournament incentive applies in round 2.
Recruitment. We conducted the experiment in January and March 2003 and in March 2005. In January 2003, on days that schools were open, we went to public schools near the site of the experiment and chose high- and low-caste children for each day after pooling the
enrollment data for all nearby public schools. A letter from the District Magistrate instructed the
teachers to cooperate with our team. On days that schools were closed, we visited homes in
nearby villages each evening to ask parents’ permission to pick up their children the next day to
drive them to the junior high school that served as the site of the experiment. In only rare
instances did parents refuse to let their children participate. In March 2003 and March 2005, to
13
choose the subjects, every day our team went to six randomly selected villages within a 20- kilometer radius of the experiment site. From each village, we drew an equal number of high- caste and low-caste children. At most ten participants came from a single village, nearly always an equal number of H and L. On each day, we recruited participants from a new set of villages.
Implementation. On arrival at the experiment site, participants waited in silence in a large common room while a research assistant entertained them. When we were ready to begin the sessions, the participants were directed in groups of six to a new set of classrooms, where they remained for the rest of the experiment. They were not told anything about how or why the particular groups were formed.
We next describe what took place during an experimental session, which lasted about 70 minutes. Under the Revealed Mixed and Revealed Segregated conditions, the experimenter began a session by making public the identity of the participants, as described above. After that, all sessions proceeded in the same way. The experimenter told the participants that they would
“take part in two games of solving puzzles.” She gave participants the show-up fee of 10 rupees and described how to solve a maze in this way:
“…there is one child. The child has to go to the ball. The solution is a path that takes the child to the ball. The black lines are walls. The child cannot cross a wall.”
Participants were given five minutes to practice with an additional maze. The experimenter explained that for each maze they solved, participants would receive an additional one rupee.
She checked to make sure each child understood the incentive scheme. She explained that the earnings of each participant would be revealed in private. Then she told the participants that they would have 15 minutes to solve a packet of mazes, and the first round of maze-solving began. After that round, and without giving feedback on performance, she said that there would be one more round of solving mazes, explained the incentive scheme (piece rate or tournament), and checked that each child understood it. After the second round, participants gave information about their background privately in a post-play survey. Mazes were graded blind. Participants received their earnings in sealed envelopes and were taken home.
Predictions. Under piece rates, the output and payoff to a participant are independent of the output of the other participants. Individual output thus depends only on preferences
regarding effort provision and on ability. In contrast, under tournament incentives, revealing the
caste identity of the other participants might affect beliefs about the individual’s chances of
14
winning the tournament. Since we cannot separately measure beliefs and preferences, here we make predictions only about performance under the piece rate scheme. In Section 6.3, we discuss beliefs relevant to the tournament scheme.
The predictions of the theories presented in Section 2 are fairly clear—see Figure 2. Since preferences are fixed and always salient under the first three theories, they predict that increasing the salience of caste would have no effect on behavior. In contrast, theory 4, which states that cues to identity have framing effects that orient action, predicts that increasing the salience of caste reinforces for a low-caste individual the worldview in which Dalits are accepted only so long as they stay in “their place,” which would reduce the utility from high achievement. For a high-caste individual, the predictions under theory 4 are ambiguous. On the one hand, the ideal of a high-caste person is to be superior: making him more aware of his caste should, if anything, enhance his desire to conform to this ideal. On the other hand, making caste more salient could activate a mental frame in which he has less need to achieve because a high-caste individual has an entitlement to status or because, as in the quotation from Béteille above, “a man’s social capacities were known from the caste or the lineage into which he was born.” Finally, under the theory of "stereotype susceptibility," making caste more salient entails a negative productivity shock to L and, possibly, a positive productivity shock to H (Dee 2009).
Figure 2. Predicted Effects of Increasing the Salience of Caste under Piece Rate Incentives Theory Predicted effect of increasing caste salience on the performance of:
High caste Low caste
Effect on preferences Theories 1-3
Individuals have well-defined preferences that are always salient.
None None
Theory 4
Increasing an individual’s awareness of an aspect of his identity may cue a worldview and self-concept. Individuals have multiple sets of preferences, one for each worldview and self-concept.
Ambiguous—
Cueing an identity whose norm is to be superior increases the utility from achievement, which increases effort; but evoking a worldview in which life chances depend less on effort than on caste decreases effort.
Declines—
Making a low-caste person more aware of his caste reinforces a worldview in which it is a norm violation for him to perform at a high level.
Effect on ability: Stereotype susceptibility
Theory 5 Ambiguous Declines
15 4. Descriptive Statistics
In this section, we describe the participants’ characteristics and broadly summarize the results.
7Table 1 shows that parents of H have much greater education than parents of L. For simplicity, the table groups together Revealed Mixed and Revealed Segregated as the “identity conditions.”
The table shows that 45% of all H compared to 12% of all L have a mother with at least six years of schooling. (These are weighted averages across conditions, calculated using Figure 1.) For only 5% of H, compared to 28% of L, both parents are illiterate. Only 8% of H have fathers who are day laborers, compared to 18% in the case of L. These differences highlight the need to examine whether the correlates of caste can explain the differences between H and L in our results. We can do that because the distribution of parents’ characteristics for H shares a common support with that for L. For example, there are not only L who have mothers with no schooling; there are also H whose mothers have no schooling. We collected data on two other variables in the post-play survey: exposure to mazes, and number of participants in a session known that a subject knows.
Table 1 shows that the randomization between the control and identity conditions was largely successful. However, in the identity conditions, participants have parents with a significantly higher level of education and are significantly more likely to have had some exposure to mazes. These differences should, if anything, improve performance in the identity conditions compared to the control. An effect that goes the other way is that the low caste is on average slightly more likely to be in 6
ththan 7
thgrade in the identity conditions.
8We control for
7
In each time period in which we conducted the experiment (January and March 2003 and March 2005), we held at least six sessions under P/P incentives in the control condition. As shown in Web Appendix Table A1, there were no significant differences in output by time period. Therefore we pool the data across the three time periods. We also found no experimenter effects on the number of mazes solved per round.
8
Unlike for L, the randomization in terms of grade in school is perfect for H across control and identity
treatments. For L, the mean grade in school is 6.53 for control (Caste Not Revealed) and 6.34 for the
identity treatments and this difference is significant, as
Table 1 shows. Further disaggregating the data by treatment reveals that the problem of imbalance in grade for L lies with the control versus all other treatments, and that this is not so in the case of H. For H, for piece rate conditions, the means for grade in school (with standard deviations in parentheses) are 6.53 (0.50) for Caste Not Revealed, 6.53 (0.50) for Revealed Mixed, and 6.69 (0.47)16
these factors in the analysis, and all results described in Section 1 are robust to these controls. In particular, Results 2 and 3 that the low caste underperforms when caste is revealed is robust to controlling for grade in school.
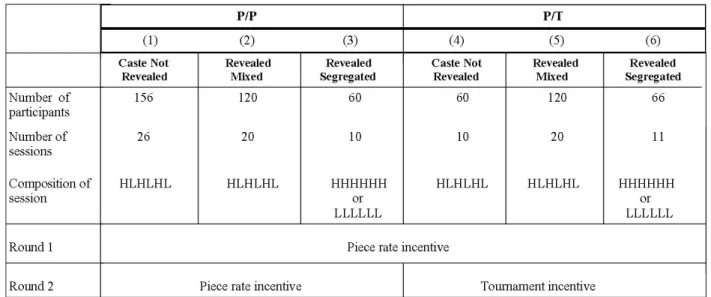
Figure 3 shows the average number of mazes solved by H. For ease of exposition, the figure is divided into three blocks. Block 1 is round 1, block 2 is round 2-piece rate, and block 3 is round 2-tournament. In each block, it is easy to see that H output is lowest in Revealed
Segregated. Under the Mann-Whitney U-test, the differences between Caste Not Revealed and Revealed Segregated are significant at p< .05 in all blocks. In block 2, average output is higher in Revealed Mixed than in the control, but the difference is not significant.
for Revealed Segregated. For the tournament conditions, the means are 6.47 (0.50) for Caste Not Revealed, 6.44 (0.50) for Revealed Mixed, and 6.43 (0.50) for Revealed Segregated. On the other hand, for L, while there is little difference in the mean grade in school among the four identity treatments, the mean grade for Caste Not Revealed is higher. For L, for piece rate conditions, the means are 6.57 (0.50) for Caste Not Revealed, 6.37 (0.48) for Revealed Mixed, and 6.30 (0.46) for Revealed Segregated. For the tournament conditions, the means are 6.43 (0.50) for Caste Not Revealed, 6.30 (0.46) for Revealed Mixed, and 6.39 (0.49) for Revealed Segregated.
17 Table 1: Descriptive Statistics for Participants
High caste Low caste
Caste Not Revealed
Identity conditions
Caste Not Revealed
Identity conditions Mother’s education
None 32% 25% 75% 68%
Years ϵ (0,6) 26% 29% 17% 17%
At least 6 years 42% 46% 8% 15% *
Father’s education
None 6% 6% 26% 31%
Years ϵ (0,6) 7% 13% * 22% 19%
At least 6 years 86% 81% 52% 50%
Both parents illiterate 7% 4% 26% 29%
4% 7% 7% 5%
Mother works outside the home
8% 9% 16% 19%
Father is a day laborer
Grade in school 6.51 6.51 6.53 6.34*
Previous exposure to
mazes 7% 15% * 4% 16% *
Mean number of other
participants known 0.55 1.14* 0.56 1.03*
Notes. This table looks at the balance between treatments in which caste identity is revealed (“Identity
conditions”) and those in which it is not. Except for the last row, the characteristics reported in this table are binary. For example, “both parents illiterate” =1 if both parents have no formal education and otherwise it is zero; “previous exposure to mazes before” =1 if the subject had seen mazes before and otherwise it is zero; and grade in school is equal to either 6th or 7th. For binary variables, the tests of equality of means across conditions for the high caste are based on logit regressions, one for each
characteristic; and similarly for the low caste. For “mean number of other participants known,” the test of
equality of means is based on a t-test. * denotes rejection of the equality of means for the control and
identity conditions at p < 0.05.
18 Figure 3. Average Output of High-Caste Participants
Note. Brackets indicate differences between treatments with 95% confidence based on the Mann-
Whitney U-test.
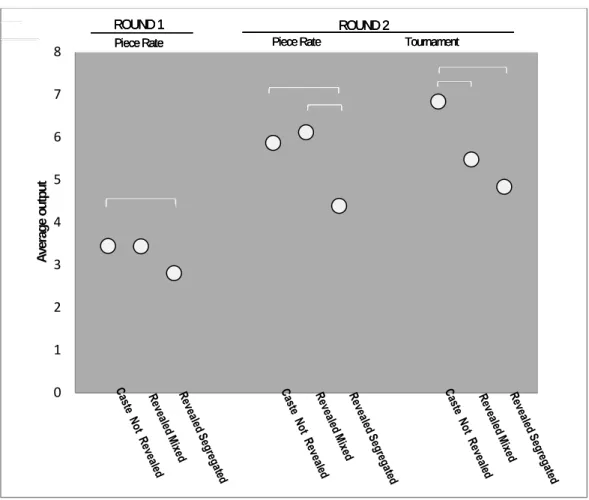
Figure 4 superimposes on Figure 3 the average L output by condition. All three blocks show that when caste is not revealed, the average output of H is almost the same as that of L.
However, when caste is made public, the performance declines for L are generally steeper than those for H.
0 1 2 3 4 5 6 7 8
Average output
ROUND 1 ROUND 2
ROUND 1Piece Rate Piece Rate Tournament ROUND 2 ROUND 1Piece Rate Piece Rate Tournament ROUND 2 Piece Rate Piece Rate Tournament
19
Figure 4. Average Output of High-Caste and Low-Caste Participants
Note. Black brackets indicate differences between treatments for L. Vertical lines indicate significant
caste gaps. Statistical significance is based on the Mann-Whitney test with 95% confidence.
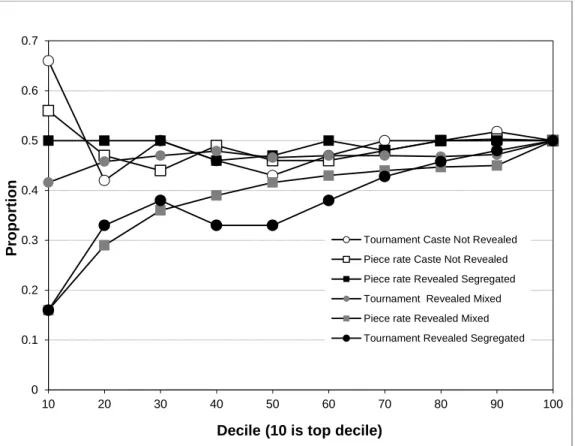
Figure 5 shows how the identity conditions impair L relative to H performance at the very top of the ability distribution. The figure reports, for round 2, the ratio of L participants to all participants with output at or above each decile. (If H and L were equally represented
throughout the achievement distribution and if varying caste salience had the same effect on both groups, all points in the figure would lie along the horizontal line at one-half; i.e. any cut of the distribution would have a proportion of L participants equal to about one-half.) The figure shows that if the top 10 percent of participants was selected based on performance in the control condition, this would result in a majority L representation. If selection was based on
performance in Revealed Mixed, this would result in a minority L representation. And if
selection was based on performance in Revealed Segregated under piece rate incentives, it would result in an equal representation of H and L.
0 1 2 3 4 5 6 7 8
Average output
High Caste Low Caste
ROUND 1 ROUND 2
ROUND 1Piece Rate Piece Rate Tournament ROUND 2 ROUND 1Piece Rate Piece Rate Tournament ROUND 2 Piece Rate Piece Rate Tournament
20
Figure 5. Proportion of the Low Caste above each Performance Decile in Round 2 (Cumulative)
Note. There is, in general, more than one subject whose performance ranks him at the border between two
deciles. In those cases, we calculated the proportion of L among participants whose performance was exactly the decile performance, and allocated L in this proportion to both sides of the boundary.
0 0.1 0.2 0.3 0.4 0.5 0.6 0.7
10 20 30 40 50 60 70 80 90 100
Proportion
Decile (10 is top decile)
Tournament Caste Not Revealed Piece rate Caste Not Revealed Piece rate Revealed Segregated Tournament Revealed Mixed Piece rate Revealed Mixed Tournament Revealed Segregated
21 5. Measuring Treatment Effects
5.1. Number of Mazes Solved—Full Sample
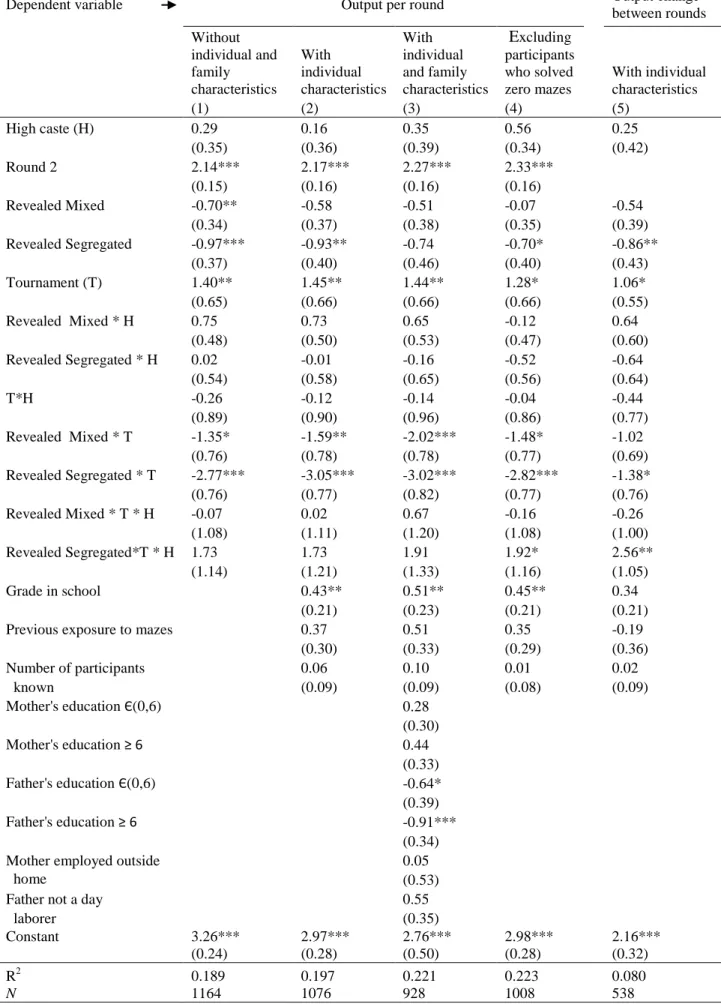
We find patterns similar to those in Figure 4 in regressions that control for individual and family characteristics. We pool all observations and allow for interactions among caste, context, and incentives. Table 2, columns (1)-(4), report OLS estimates, with robust standard errors clustered at the individual level, for the following specification:
Mazes solved in a round = α + ω·(round is 2) + β·(subject is H) + γ·(session cues identity) (1) + δ ·(subject is H*session cues identity) + τ·(Tournament) + λ· (Tournament*subject is H) +
ξ·(Tournament*session cues identity) + θ·(Tournament*subject is H * session cues identity) + μ·Ζ + error
where Z is a vector of individual and family characteristics. α measures predicted output in the omitted case: an L in Caste Not Revealed in round 1. The next eight coefficients (from ω to
θ) measure round, caste, treatment effects, and the two-way and three-way interactions.
9Two results from the table are immediate. First, the estimated coefficients on H show that the caste gap is very small and always insignificant in Caste Not Revealed. Second, the coefficients on tournament show that in Caste Not Revealed, tournament incentives significantly increase output. The coefficients on T*H are always insignificant, which means that the
response of H to tournament incentives is statistically indistinguishable from that of L.
Specification (1) uses only treatment and caste indicators. Specification (2) adds controls for individual characteristics: grade in school, previous exposure to mazes, and number of other participants known in a session. Specification (3) adds controls for family characteristics.
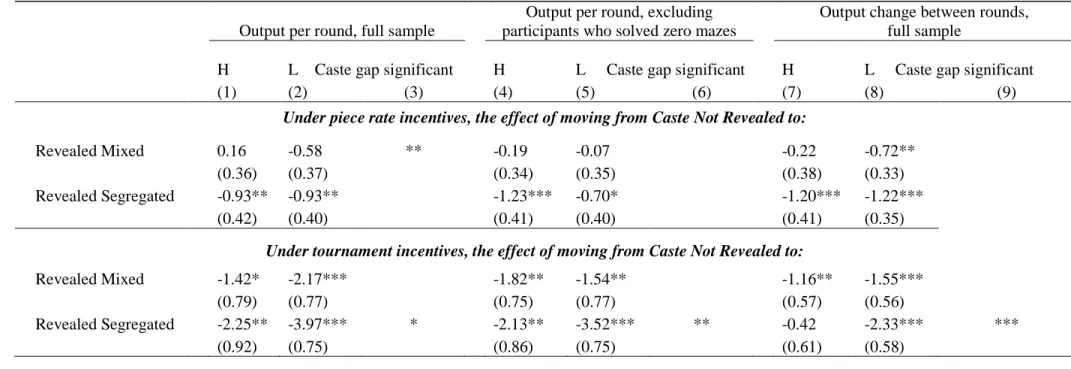
Between specifications (1) and (2), the only change in the set of significant treatment effects is that the output decline by L in Revealed Mixed under piece rates is no longer
significant. We report the treatment effects in Table 3, columns (1)-(2). The top panel considers output under piece rates. It shows that the treatment effects of Revealed Mixed for each caste are
9For example, γ is a vector that measures the difference for L between an identity condition (Revealed Mixed or Revealed Segregated) and the control, under piece rate incentives. Using a subscript s for Revealed Segregated, α + ω + γs is the predicted output of L in round 2 of Revealed Segregated under piece rate incentives. The predicted output of H in Revealed Segregated under tournament incentives is α + ω + β + γs + δs + τ + λ + ξs + θs.
22
individually insignificant but jointly produce a significant caste gap in favor of the high caste.
The effect of moving from Caste Not Revealed to Revealed Segregated is -0.93 mazes for H and L, and is significant. Is this decline important? One meaningful benchmark is the output effect of being one year younger, which is -0.43 and significant. Thus, the treatment effect on output of moving from the control to Revealed Segregated is roughly double the effect on output of being in 6
thinstead of 7
thgrade.
The bottom panel of Table 3 reports treatment effects of cues to caste in the tournaments.
All four effects (that is, the two identity conditions crossed with the two caste groups) are negative and significant. The declines in output are much more severe for L than for H. For example, for H, Revealed Segregated decreases output by 2.25 mazes, or 34%. The comparable figure for L is a decrease in output by 3.97 mazes, or 60%.
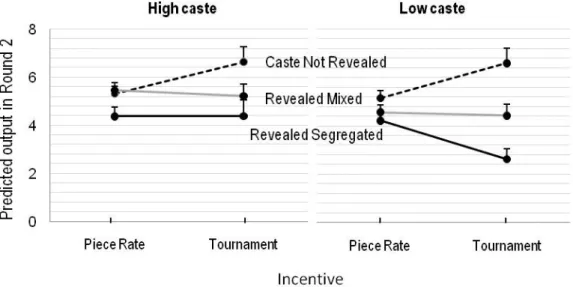
Figure 6 graphs predicted output in round 2. The dotted lines show that when caste is not revealed, output under the tournament scheme is significantly greater than under piece rates. The increase is 1.3 mazes for both H and L (p-value = 0.01); in percentage terms, the boost is 25%
for H and 28% for L. However, as shown by the solid lines, when caste is made public, there is
no increase in output by H or L in tournaments compared to piece rates. In fact, in Revealed
Segregated the tournament scheme perversely reduces L output. The decline is 1.6 mazes (p-
value < 0.01), which is equivalent to a 38% decline from the predicted level under piece rates.
Notes. Standard errors in parentheses are robust to heteroskedasticity, and observations are clustered at the level of the individual. The omitted case is L in Caste Not Revealed under piece rate incentives. Column (4) excludes participants who have zero output in both rounds. Round 2 = 1 for round 2 and zero for round 1. Grade in school = 1 if the participant is in grade 7, 0 if he is in grade 6. Previous exposure to mazes = 1 if some time before the experiment, the participant had seen mazes; 0 otherwise. Number of other participants known is the number of others in the experimental session known to a given participant. *** p<0.01, ** p<0.05, *** p<0.10.
Table 2: OLS Estimates of the Determinants of Output per Round and Output Change between Rounds
Dependent variable Output per round Output change between rounds Without
individual and family characteristics
With individual characteristics
With individual and family characteristics
E
xcluding participants who solved zero mazesWith individual characteristics
(1) (2) (3) (4) (5)
High caste (H) 0.29 0.16 0.35 0.56 0.25
(0.35) (0.36) (0.39) (0.34) (0.42)
Round 2 2.14*** 2.17*** 2.27*** 2.33***
(0.15) (0.16) (0.16) (0.16)
Revealed Mixed -0.70** -0.58 -0.51 -0.07 -0.54
(0.34) (0.37) (0.38) (0.35) (0.39)
Revealed Segregated -0.97*** -0.93** -0.74 -0.70* -0.86**
(0.37) (0.40) (0.46) (0.40) (0.43)
Tournament (T) 1.40** 1.45** 1.44** 1.28* 1.06*
(0.65) (0.66) (0.66) (0.66) (0.55)
Revealed Mixed * H 0.75 0.73 0.65 -0.12 0.64
(0.48) (0.50) (0.53) (0.47) (0.60)
Revealed Segregated * H 0.02 -0.01 -0.16 -0.52 -0.64
(0.54) (0.58) (0.65) (0.56) (0.64)
T*H -0.26 -0.12 -0.14 -0.04 -0.44
(0.89) (0.90) (0.96) (0.86) (0.77)
Revealed Mixed * T -1.35* -1.59** -2.02*** -1.48* -1.02
(0.76) (0.78) (0.78) (0.77) (0.69)
Revealed Segregated * T -2.77*** -3.05*** -3.02*** -2.82*** -1.38*
(0.76) (0.77) (0.82) (0.77) (0.76)
Revealed Mixed * T * H -0.07 0.02 0.67 -0.16 -0.26
(1.08) (1.11) (1.20) (1.08) (1.00)
Revealed Segregated*T * H 1.73 1.73 1.91 1.92* 2.56**
(1.14) (1.21) (1.33) (1.16) (1.05)
Grade in school 0.43** 0.51** 0.45** 0.34
(0.21) (0.23) (0.21) (0.21)
Previous exposure to mazes 0.37 0.51 0.35 -0.19
(0.30) (0.33) (0.29) (0.36)
Number of participants 0.06 0.10 0.01 0.02
known (0.09) (0.09) (0.08) (0.09)
Mother's education Є(0,6) 0.28
(0.30)
Mother's education ≥ 6 0.44
(0.33)
Father's education Є(0,6) -0.64*
(0.39)
Father's education ≥ 6 -0.91***
(0.34)
Mother employed outside 0.05
home (0.53)
Father not a day 0.55
laborer (0.35)
Constant 3.26*** 2.97*** 2.76*** 2.98*** 2.16***
(0.24) (0.28) (0.50) (0.28) (0.32)
R2 0.189 0.197 0.221 0.223 0.080
N 1164 1076 928 1008 538
24
Table 3: Treatment Effects of Making Caste Identity Public under Piece Rate and Tournament Incentives
Output per round, full sample
Output per round, excluding participants who solved zero mazes
Output change between rounds, full sample
H L Caste gap significant H L Caste gap significant H L Caste gap significant
(1) (2) (3) (4) (5) (6) (7) (8) (9)
Under piece rate incentives, the effect of moving from Caste Not Revealed to:
Revealed Mixed 0.16 -0.58 ** -0.19 -0.07 -0.22 -0.72**
(0.36) (0.37) (0.34) (0.35) (0.38) (0.33)
Revealed Segregated -0.93** -0.93** -1.23*** -0.70* -1.20*** -1.22***
(0.42) (0.40) (0.41) (0.40) (0.41) (0.35)
Under tournament incentives, the effect of moving from Caste Not Revealed to:
Revealed Mixed -1.42* -2.17*** -1.82** -1.54** -1.16** -1.55***
(0.79) (0.77) (0.75) (0.77) (0.57) (0.56)
Revealed Segregated -2.25** -3.97*** * -2.13** -3.52*** ** -0.42 -2.33*** ***
(0.92) (0.75) (0.86) (0.75) (0.61) (0.58)
Notes. All treatment effects reported here can be derived from the regressions in Table 2: Effects in columns (1)-(3) can be obtained from
regression (2); those in columns (4)-(6) can be obtained from regression (4); those in columns (7)-(9) can be obtained from regression (5).
However, it is easier to estimate these effects and obtain their standard errors by running a separate regression for each benchmark case. For
example, to obtain the effect on H of moving from Caste Not Revealed to Revealed Mixed under tournament incentives, a convenient benchmark
is H, Caste Not Revealed, tournament incentives. Cluster-robust standard errors are in parentheses. *** p<0.01, ** p<0.05, * p<0.1
25
Figure 6. Predicted Output in Round 2: Piece Rate and Tournament Incentives
Note. Error bars are based on standard errors. Predicted values, based on specification (2) of Table 2, control for the participant’s grade in school, prior exposure to mazes, and number of other participants known in the session. See Supporting Figure A1 for the values.
Up to now, we have discussed results controlling only for individual characteristics, based on specification (2) of Table 2. We next consider the effect of controls for household characteristics. This is important because it could be that the channel through which social identity influences behavior is class—a poor versus rich effect (Croizet and Claire 1998)—
instead of caste. Our proxies for class are parents’ education, whether the mother is employed outside the home, and whether the father is employed as a day laborer. Because stigma is associated with daily wage-labor, our post-play survey did not ask the participants, “Is your father a day laborer?” Instead the survey asked about the father’s occupation. We formed a binary variable for daily wage labor based on the response.
Specification (3) of Table 2 reports the regression results controlling for our proxies for class. The main change in the results when we add controls for class is that the decline in performance in Revealed Segregated is reduced, and it is significant at p < 0.10 only for H, not for L (for whom the decline is only -0.74 mazes, p-value = 0.11),
Our other qualitative results are little changed by adding the controls for parental characteristics. Three points, which hold for specifications (1) and (2), remain clear as well for specification (3):
26
(1) For H, it is segregation rather than merely making caste public that impairs performance. Compared to the condition in which caste is not revealed, Revealed Mixed slightly and insignificantly increases H output, whereas Revealed Segregated strongly reduces it (the effect is -1.03; p-value =0.03).
(2) H and L are equally good at solving mazes when caste is not revealed. In contrast, in Revealed Mixed a caste gap in favor of H emerges (= 0.35 + 0.65=1.0; p-value = 0.01).
(3) Making caste public eliminates the positive response to tournament incentives for both groups. In Revealed Segregated, L’s response is strongly negative (= -1.58 mazes, p- value = 0.004).
We have emphasized specification (2) in Table 2 more than specification (3) because we cannot reject the hypothesis that parental variables have no effect on performance:
F(6,486) = 1.58, p = 0.11. The only proxy for class that is individually significant is father’s education, and the result was in the opposite direction from what is required to explain the superior performance of H as an effect of class. Boys with educated fathers actually solve fewer mazes than their counterparts.
It might be, however, that parental variables matter for L, but not H, because having educated parents alleviates low-caste stigma. Therefore in unreported regressions, we rerun specification (3) separately for H and L participants. We still find that parental variables have little explanatory power and are insignificant by an F-test. We also checked for the effect of having both parents illiterate. We find that this is not significant (result not shown). In these and all other regressions that we have run, we find no evidence that class is the channel through which caste influences behavior. However, since we do not have measures of income and wealth, the concern that unobserved class variables may matter, remains.
5.2 Between-Round Change in the Number of Mazes Solved
As an additional check on our results, we consider the treatment effects on the change in output between rounds: see Table 3, the last three columns. We find that for both H and L, the
impairment of performance in Revealed Segregated compared to the control remains significant
under the piece rate scheme (p-value < 0.01). Thus, whether our dependent variable is the output
level or the between-round change in output, we obtain a counter-stereotype susceptibility result
for H and a pro-stereotype susceptibility result for L.
27
To investigate whether the counter-stereotype susceptibility result for H comes from a shift in preferences that lead to reduced effort or, alternatively, a decline in the ability to perform when identity is blatantly primed (as in Shih et al. 2002, discussed in Section 2), in the remainder of this section we decompose performance into two stages:
Stage 1. The participant learns what it means to solve a maze. The outcome is binary—
success or failure. We measure failure by zero output by a participant during the 30 minutes of maze-solving.
Stage 2. The participant applies and improves his skills. The outcome is the number of mazes solved conditional on success in learning how to solve a maze.
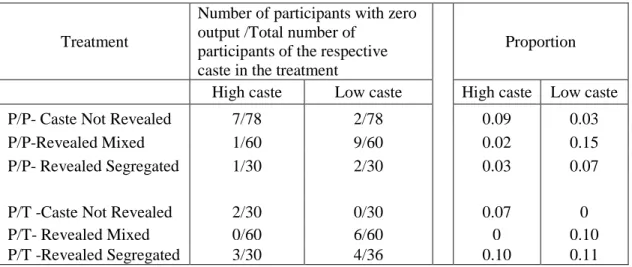
5.3 Failure to Learn How to Solve a Maze
Here we consider stage 1. Table 4 shows that failure for H occurs more often in the control than in the identity conditions, whereas the reverse is true for L. To fit a logit model, it is necessary to collapse the two identity conditions and also the two incentive conditions.
10We estimate
Failure = α + β·(subject is H) + γ·(session cues identity) (2) + δ ·(subject is H * session cues identity) + μ·Ζ + error,
where the benchmark case is L in Caste Not Revealed. We use the logit results, reported in Supporting Table A2, to predict the probability of failure. Figure 7 reports the results,
controlling for individual characteristics. The figure shows that revealing caste reduces failure among H from 8% to 2%, and increases failure among L from 1% to 11%. These changes are statistically significant and robust to the addition of controls for household characteristics. These changes are also consistent with the predictions of stereotype susceptibility: when the
participants are made more aware of caste, H are less likely, and L are more likely, to completely fail to learn how to solve a maze. These results suggest that the identity conditions do not
depress the ability of H to perform a cognitive task. They suggest instead that the decline we find in H output in Revealed Segregated reflects a change in preferences regarding the provision of effort.
10 Otherwise the estimates are unbounded, since some cells in Table 4 are empty.
28
Table 4. Proportion of Participants with Zero Output
Treatment
Number of participants with zero output /Total number of
participants of the respective caste in the treatment
Proportion
High caste Low caste High caste Low caste
P/P- Caste Not Revealed 7/78 2/78 0.09 0.03
P/P-Revealed Mixed 1/60 9/60 0.02 0.15
P/P- Revealed Segregated 1/30 2/30 0.03 0.07
P/T -Caste Not Revealed 2/30 0/30 0.07 0
P/T- Revealed Mixed 0/60 6/60 0 0.10
P/T -Revealed Segregated 3/30 4/36 0.10 0.11
Figure 7. Predicted Probability of Failure
Note. Based on the logit regression in Supporting Table A2, column (1). The control variables are grade in school, prevision exposure to mazes, and number of other participants in the session known. The predicted probabilities are estimated at the means of the control variables.