Report No. 67
South Asia Human Development Sector
How much and what kind of teaching is there in elementary education in India?
Evidence from three States
February 2014
Discussion Paper Series
Public Disclosure AuthorizedPublic Disclosure AuthorizedPublic Disclosure AuthorizedPublic Disclosure AuthorizedPublic Disclosure AuthorizedPublic Disclosure AuthorizedPublic Disclosure AuthorizedPublic Disclosure Authorized
86001
Report No.67
South Asia Region, Human Development Sector
How much and what kind of teaching is there in elementary education in India?
Evidence from three States
Deepa Sankar and Toby Linden
February 2014
Discussion Paper Series
ACKNOWLEDGEMENTS
This study was initiated in concurrence with the Ministry of Human Resource Development (MHRD) to understand the conditions of quality inputs and processes, especially pedagogical practices prevalent in classrooms in India, that influence quality of outcomes, including students’
learning outcomes.
This study was conceptualized and initiated by Venita Kaul, when she was with the World Bank.
Deepa Sankar was the main leader of the study over the whole of its implementation and the writing of this report. Toby Linden made a major contribution to the structure and writing of the final report. Savita Dhingra and Karthika Radhakrishnan-Nair (all World Bank) provided necessary support. Mamata Baruah managed the formatting and publishing support.
The study is indebted to the following people for their invaluable contributions. Prof. Jane Stallings and David Markham provided the basic framework for classroom observation and the initial training of the master trainers. A Technical Committee of eminent people was formed to inform and guide the study: Mrs. Snehalata Shukla, Prof. A.B.L. Srivastava, Prof. Saxena, Prof.
Sudhakar Venukappalli, Prof. Shashi Rai, Mrs. Madhumita Pal, Michael Ward (The United Kingdom’s Department for International Development) and Parimal Bardhan (European Union).
Financial assistance came from the EPDF Trust Fund (World Bank) for the field work in Andhra Pradesh and Uttar Pradesh and from DFID for the field work in Madhya Pradesh. The teams that conducted the study in each state were led by Prof. Sudhakar Venukappalli (Divya Disha, Andhra Pradesh), Manish Shankar (Yadharth, Madhya Pradesh), Prof. Pandey (SARED, Uttar Pradesh). Each state team consisted of 20-30 field investigators who enthusiastically internalized the observation method and collected information without compromising on quality. The data collected was compiled by Pravin Ramtake of New Concepts.
The concept note of the study was reviewed by Kin Bing Wu, Helen Abadzi and Robin Horn (then all World Bank). The draft paper on which the report is based was reviewed by Raisa Venalainen and Michael Ward. The report also benefited from comments provided by Tara Beteille and Sofia Shakil (World Bank) and Venita Kaul, A.B.L Srivastava and Samuel C.
Carlson (then all World Bank). Support for the study from Michelle Riboud and Amit Dar (successive Education Sector Managers, World Bank) is duly acknowledged. The authors would also like to acknowledge the participants of the Regional Conference on Quality held in October 2007 in New Delhi and the Learning Event organized by Human Development Network in Washington, DC in December 2007 who raised questions and provided useful comments on the presentation of the study results. The findings were also presented to the Joint Review Mission of Sarva Shiksha Abhiyan in July, 2008.
Discussion Papers are published to communicate the results of the World Bank’s work to the development community with the least possible delay. The typescript manuscript of this paper therefore has not been prepared in accordance with the procedures appropriate to formally edited texts. Some sources cited in the paper may be informal documents that are not readily available.
The findings, interpretations, and conclusions expressed herein do not necessarily reflect the views of the International Bank for Reconstruction and Development/The World Bank and its affiliated organizations, or those of the Executive Directors of the World Bank or the Governments they represent.
The World Bank does not guarantee the accuracy of the data included in this work.
The boundaries, colors, denominations, and other information shown on any map in this work do not imply any judgment on the part of The World Bank concerning the legal status of any territory or the endorsement or acceptance of such boundaries.
TABLE OF CONTENTS
Executive Summary ... 1
Chapter 1: Introduction ... 7
Context and Objectives ... 7
Instructional time use studies: Literature review ... 11
Planning the study and methodology ... 13
Structure of the report ... 15
Chapter 2: Tracking teachers’ teaching time in schools ... 17
Instructional time ... 17
Days prescribed by the school calendar (allocated time) ... 19
Teachers’ available time in school ... 20
Teacher presence in school ... 22
Reasons for teachers’ non-availability in schools ... 22
Teachers’ time for academic activities and classroom teaching ... 27
Equity in availability of teachers’ time ... 28
Summary ... 28
Chapter 3: The teacher in the classroom ... 29
Methodology of classroom observation ... 29
Time on different categories of activities ... 31
Summary ... 34
Chapter 4: Students’ Time on Task and Nature of Tasks ... 35
Student attendance ... 35
Students’ opportunity to learn outside school ... 36
Students’ time on task in classrooms ... 37
Multi-grade classrooms ... 39
Summary ... 41
Chapter 5: Teacher perceptions, attitudes and behavior ... 43
Teachers’ perceptions, beliefs and understanding ... 43
Teaching practices ... 47
Teacher training ... 50
Teachers’ behavior in the classroom ... 52
Chapter 6: Learning outcomes ... 63
How did children perform? ... 63
Results... 65
Private versus public school performance ... 69
Chapter 7: Some final reflections ... 73
Works Cited ... 76
Additional background materials ... 77
Appendix 1. Sample Selection process and Profile of schools, teachers, classrooms and students ... 87
Appendix 2. Details on the construction of Indices using Principal Component analysis ... 92
Appendix 3. Differences in reporting school calendar days: An illustration ... 94
Appendix 4. Pattern of activities in school at different hours – Uttar Pradesh ... 95
Appendix 5: Correlation matrix of variables used in the regressions on teacher available days ... 97
Appendix 6. Multivariant analysis ... 98
Appendix 7. Time on Task Study Classroom Snapshot Observation Coding Manual ... 104
Appendix 8. Regression analysis ... 109
Appendix 9. MHRD’s study on Student attendance Rate (Ed.CIL, 2008) ... 113
Appendix 10. Time on Task: Maths test ... 114
Appendix 11. Conceptual Model for Analyzing School Effectiveness ... 115
LIST OF BOXES Box 1: UNESCO’s Framework for defining and monitoring Quality ... 8
Box 2: Specific issues addressed in this report ... 10
Box 3: Tools used in the study ... 14
Box 4: Defining different concepts of time in the context of learning ... 18
Box 5: Classification of classroom activities ... 30
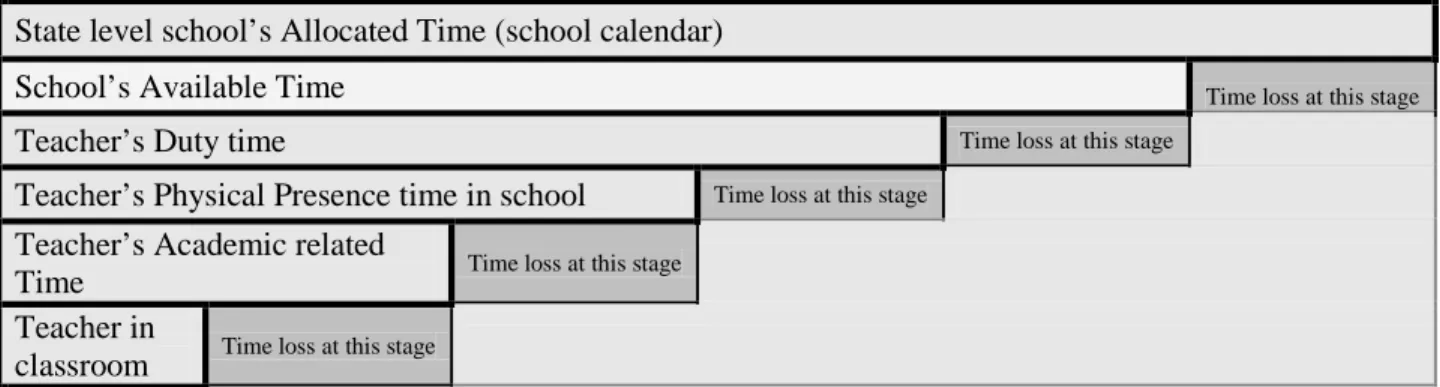
LIST OF TABLES Table 1: Instructional Time Flow model ... 18
Table 2: Teacher attendance rates in India ... 21
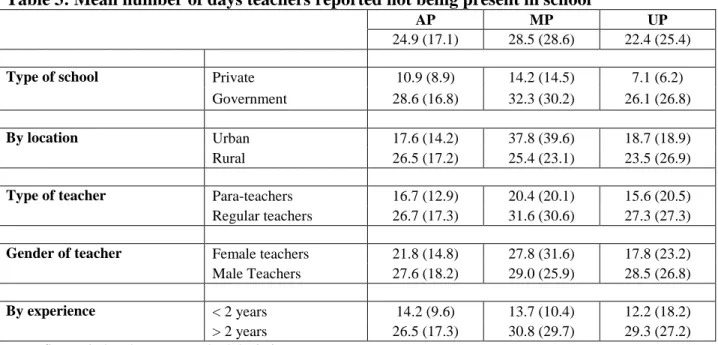
Table 3: Mean number of days teachers reported not being present in school ... 21
Table 4: Reasons for teacher absence (percent), by day of visit ... 23
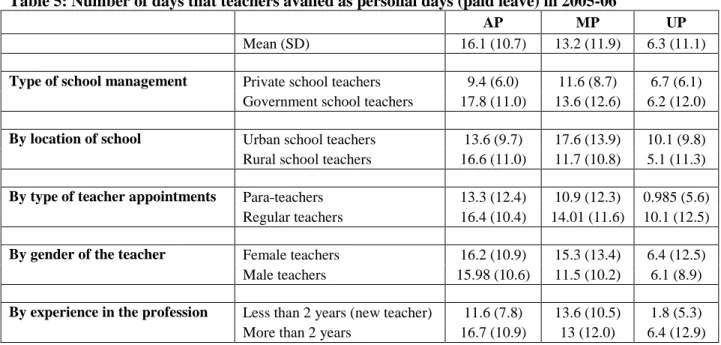
Table 5: Number of days that teachers availed as personal days (paid leave) in 2005-06 ... 24
Table 6: Teachers' beliefs about good teaching ... 43
Table 7: Teachers' beliefs about children's learning ... 44
Table 8: Teacher perceptions about daily hurdles in teaching, by state ... 46
Table 9: Teacher perceptions about daily hurdles in teaching, by sector and type ... 47
Table 10: Teachers reporting different types of remedial teaching, percent ... 48
Table 11: Teachers reporting having their own teacher guides or text books, percent ... 49
Table 12: Teachers receiving training, by type of teacher, duration of training and state, percent ... 52
Table 13: Factors influencing learning outcomes ... 66
Table 14: Difference between private and government schools in terms of school / teacher / classroom and students endowments ... 70
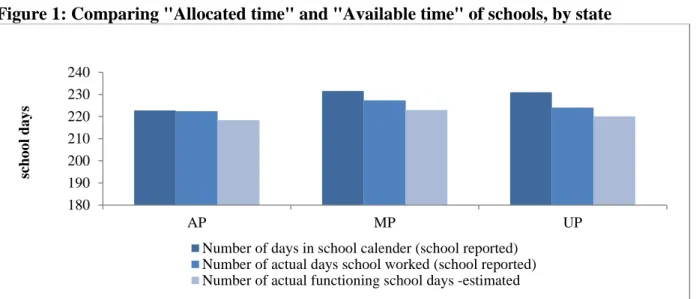
LIST OF FIGURES Figure 1: Comparing "Allocated time" and "Available time" of schools, by state ... 20
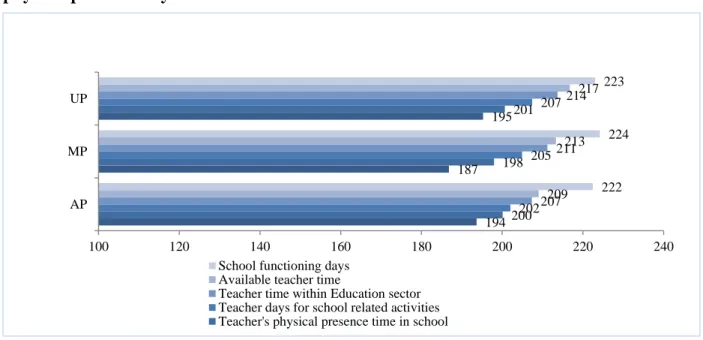
Figure 2: Teacher days available at each stage from school functioning days to teacher physical presence days ... 26
Figure 3: Mean days teachers were away from school during school functioning days: By reasons ... 26
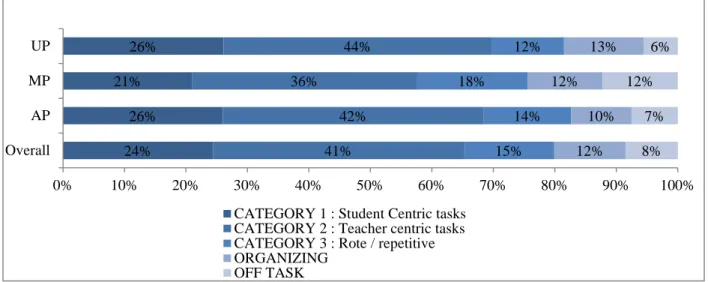
Figure 4: Distribution of classroom time across various types of activities, percent ... 32
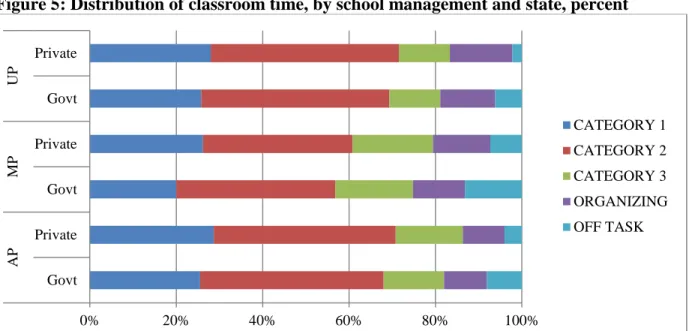
Figure 5: Distribution of classroom time, by school management and state, percent ... 33
Figure 6: Distribution of classroom time, multi-grade classrooms, percent ... 34
Figure 7: Students present in the class during school visits (percent) ... 36
Figure 8: Student attendance before and after lunch hours (percent) ... 36
Figure 9: Percent of grade 4 children who reported that they neither get space, time nor
assistance at home for studies ... 37
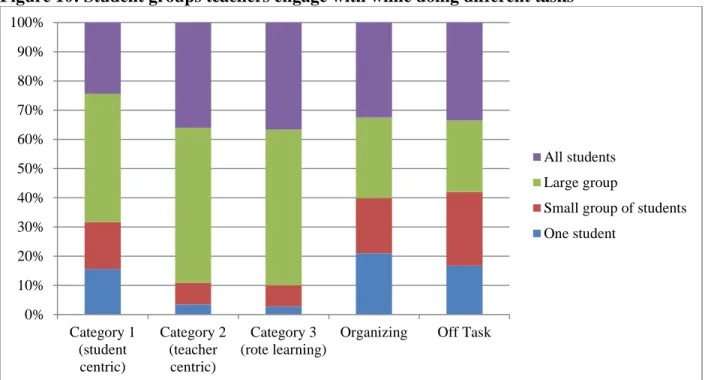
Figure 10: Student groups teachers engage with while doing different tasks... 38
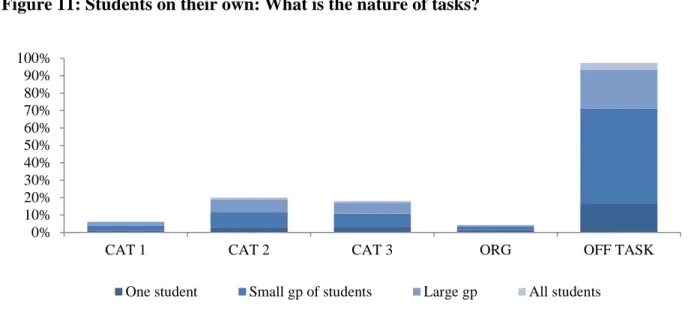
Figure 11: Students on their own: What is the nature of tasks? ... 39
Figure 12: Grades teacher addresses in multi-grade situation ... 40
Figure 13: Students and their activities in grades teacher is not primarily focused in multi-grade situations: All ... 41
Figure 14: Percentage of multi-grade classrooms where students are "Off-task", when teacher is not attending to them ... 41
Figure 15: Teachers’ attitudes / perceptions towards teaching learning process, by state ... 45
Figure 16: Teachers’ attitudes / perceptions towards teaching learning process, by school type and contract type ... 45
Figure 17: Government school teachers who discuss various issues with majority of parents/ community, percent... 50
Figure 18: Government teachers who received in-service training during the previous year, percent ... 51
Figure 19: Average number of days of training of teachers who attended training either at CRC/other training ... 51
Figure 20: Proportion of government teachers reporting usefulness of CRC training and support ... 52
Figure 21: Seating arrangements, by groups and by gender ... 53
Figure 22: Quality of teachers’ speech and writing in class ... 54
Figure 23: To whom teachers address questions ... 55
Figure 24: To whom teacher pay attention while teaching, by grade, type of school, and student gender ... 55
Figure 25: To whom teacher pay attention while teaching, by seating pattern ... 56
Figure 26: Non-availability of materials / rare use reported by teachers, by state ... 57
Figure 27: Non-availability of materials / rare use reported by teachers, by school type ... 57
Figure 28: Materials used by teachers while teaching in classrooms by school type ... 58
Figure 29: Materials used by teachers while teaching in classrooms by state ... 58
Figure 30: Use of materials for Category I activities in classrooms by teachers, by subject ... 59
Figure 31: Use of materials for Category II activities by teachers in Classrooms, by subject ... 59
Figure 32: Grade IV students’ mean scores by subject and state ... 64
Figure 33: Grade IV students' mean scores by asset quintiles ... 64
Figure 34: Grade IV students' mean scores, by type of school management and by state ... 65
Figure 35: Grade IV students' mean scores by type of classrooms ... 65
Figure 36: Predicted differences between mean achievement levels of government and private schools, before and after controlling for student and school level factors... 71
-1-
EXECUTIVE SUMMARY
During the last decade and a half, India’s efforts in improving primary education have resulted in better provision of schooling facilities and increased enrolments, and have reduced the gender, social and economic gaps in education participation. However, low learning outcomes remain a concern. Understanding the core processes of teaching that result in better learning outcomes requires understanding the underlying dimensions: learner characteristics, context, enabling inputs; teaching and learning;
and outcomes.
This study, carried out with concurrence from Ministry of Human Resource Development (MHRD), Government of India (GOI), is built upon the independent study commissioned by the MHRD to explore the teacher attendance rates in schools and its reasons. This study ventures beyond the quantitative dimensions of teacher attendance (physical presence) to look at the ‘time-on-task’ and the nature of tasks taking place in classrooms – that is, both the quantity and quality of teacher presence and interaction with students which are essential conditions for learning. Most specifically, it aims to provide insight into the work of teachers and suggest implications for both policy and program interventions to empower teachers and introduce more accountability into the system. The study also aims to find out the factors that facilitate improved quality of instructional time on the one hand, and what it means to the process of improving learning levels on the other.
Methodology
This study was carried out in 2006-07 in three states – Andhra Pradesh (AP), Madhya Pradesh (MP) and Uttar Pradesh (UP). A random sample of 100 government schools in each state. In addition, private schools, selected from each neighborhood of every 5th government school, were included in the study. Three primary grades in each school – Grades I, II and IV – were observed for Language and Math classes (for Grades I and II) and in addition for Environmental Sciences (for Grade IV).
All subject classes per grade were observed twice using, for the first time, a standardized method. In each state, 1,680 classrooms were observed, generating more than 75,000 observation snapshots.
Three dimensions of teachers’ time were considered. First, the number of school days prescribed by the calendar and days the school actually functioned. Second, the amount of time teachers were physically present in school and its distribution across various functions within school; and, third, teachers’ time in the classroom and the distribution of that time across various learning (‘on task’) and non- learning (‘off task’) activities. Time-on-learning tasks were of three types: (i) “student centric”
(Category I activities); (ii) traditional teacher – centric, “chalk and talk” methods (Category II activities); and (iii) “rote learning” (Category III activities). These different measures of teachers’ time yield insight into the amount of productive learning time that children experience in Indian elementary schools. The learning outcomes of students tested were correlated with the usual school characteristics and student characteristics, but also to classroom time and processes, and quality of tasks. This study examines the teachers’ as well as students’
time in both mono-grade and multi-grade classrooms.
Available school days
The average number of days of allocated time reported by schools was 231 days each in UP and MP and 223 days in AP.
In an academic year of 220-225 days, on an average, at least one seventh (14 percent) of the school calendar days went unutilized for instruction. There were three main reasons.
First, teachers reported that they were not in school, either because of training, attending meetings or performing functions outside of the education department for, on average, 25- 30 days of teachers’ duty days. These lost days were particularly high in government schools, where teachers were absent 10 days more on average than private school teachers. Moreover, within government schools, regular (as against
-2- para or ad hoc), more experienced, and better- trained teachers were absent more often.
Second, teachers’ personal and sick leave reduces the teacher time available to school by at least an additional 12 days, especially in the case of regular teachers in government schools. These leave days can be used during the school year and are in addition to the 1-2 months of vacation in a year.
Third, around 3-4 days of each school’s prescribed school calendar was lost on account of local festivals, events of national importance and campaigns even in an
“uneventful” year (such as the year in which the study took place). The number of school days lost differed across States (for example, among the three states where the study was conducted, it varied from 4 days in AP to 11 days in UP) and, within states, across districts and schools.
Instructional time
Non-academic activities such as compilation and provision of data, maintenance of records, and supervision of mid-day meal distribution accounted for 20-25 percent of the weekly working hours (as reported by teachers). Government school teachers reported they worked more hours in school every week than teachers in private schools, but the non- academic activities “crowded out” the advantages of that extra time in school. Within academic activities, classroom teaching occupied the majority of time.
Time on task and nature of tasks
Some amount of classroom organization is a necessary part of teaching (for example, organizing activities also include taking attendance, distributing learning materials, etc.).
However, on average, for around one-fifth of the classroom time, teachers were not on any teaching learning tasks: they were either in organizational tasks or on tasks completely unrelated to teaching and learning. From the students’ perspective, it is not only the number of days of school or time a teacher is teaching that is important, but also how a teacher’s time is used during lessons.
Teachers were engaging children in student- centric, higher order activities for around 24 percent of the classroom observation time on average. The prevalence of student-centered tasks increased in higher grades and in Math classes. However, a fifth of the classrooms observed were devoid of any student-centered tasks of teaching-learning.
Overall, the largest proportion of time was spent on activities that were teacher-centric.
Traditional teaching activities accounted for over 40 percent of overall classroom time and more than 50 percent of all teaching time within the observed classrooms. Finally, teachers using rote learning activities (Category 3) were observed to occupy 15 percent of classroom time. The general distribution of activities between categories was similar across the three states. There are no significant differences in the patterns of teaching practice between government and private schools. This is one of the most striking findings in the study.
Moreover, private schools in each state look much more like the government schools in that state, than they do like private schools in other states.
Multi-grade classrooms present a complex picture. On the one hand, taking the children in these classes as a whole, their learning experience is very similar to that of children in classrooms in which only one grade is being taught. On the other hand, in multi-grade classrooms, the grade being observed had much higher proportion of the time spent on Category 1 activities than the other grades in the same classroom. So the overall similarity of multi- grade classrooms to single-grade classrooms seems to be driven by the way teachers teach to one grade in the multi-grade classroom. In other words, multi-grade teaching is practiced much less frequently than the presence of multi-grade classrooms would suggest. Here is another urgent need for more effective training programs.
Teachers’ perceptions, beliefs and understanding
How teachers teach in the classroom is influenced by what they perceive or believe as
-3- the best ways to teach. On the whole, the majority of the teachers across both government and private schools, and across the three states, agreed with more “student-inclusive” statements regarding teaching and learning. However, most teachers are not able to translate these beliefs consistently into views about the ways children learn best. Sixty-two percent of teachers in government schools said that children need to be provided with all the answers, while, at the same time, 65 percent said that students were capable of learning on their own.
Availability of materials
One-third of teachers overall, and more than half of teachers in MP, reported that they did not possess teacher guides, and overall 15 percent did not possess their own text books. In AP and UP, around 70 percent teachers possessed a teacher guide; while in MP only 43 percent teachers had one. Less than half of the teachers in the private sector possessed teaching guides.
There was considerable variation across states.
For example, regular teachers were significantly better off with respect to teaching guides compared with para teachers in AP (77 percent as against 57 percent), somewhat better off in MP (44 percent versus 31 percent), but worse off in UP (68 percent as against 74 percent).
Teaching-learning materials were available in 87 percent of classrooms but much less in private than in government classrooms.
However, around 52 percent of the classrooms had teaching-learning materials such as charts, maps or pictures displayed on the walls or elsewhere. While around 57 percent of government classrooms had some TLM displayed, less than a third of the classrooms in private schools did. This finding is consistent with the reported concerns of teachers in private schools that a significant hurdle to teaching is the lack of materials.
Teachers’ training
About two-thirds of teachers received some in- service training in the previous twelve months, for an average of 15 days, but the type of training, focal area of training and duration of training varied across states. Across states, the average number of days teachers received
training ranged from 9 days in AP to 23 days in MP. Para teachers had very varied experiences across states with respect to training opportunities, seemingly driven by state policy.
Only around a third of the government teachers who received in-service training reported that the training benefited them.
Moreover, as noted above, when teachers are trained, they very often do so during school working days. So not only do students lose out by not having their regular teacher available to teach them, they also lose out because mostly this training does not improve the ability of teachers to teach.
Use of learning material in classrooms
Teacher-centric methods with no materials or only the blackboard were observed three- quarters of the time. It was observed that around 11 percent of academic learning time, teachers were on academic activities without any materials. This means that teachers were simply
“lecturing”. Such instruction without using any materials was observed mostly in MP (on an average, 17 percent of the classroom observation time) and least in classrooms in UP (3 percent).
Within student-centric activities, more observations using TLMs or innovative methods were found in classrooms in government schools (22 percent of Category I activities time as against 12 percent of classroom situations in private schools).
The availability of different types of teaching materials varied considerably, though the patterns of which materials were available across states were similar. Almost all teachers, in both government and private schools and across all 3 states, reported that they had textbooks. The availability of textbooks did not however translate consistently into their use in the classroom. This broad pattern, of heavy dominance of use of the blackboard and textbooks rather than other materials, is perhaps explained by the finding that teachers strongly believed that students learn by copying the teacher. Even when child-centric learning activities were taking place, teachers relied mostly on textbooks or the blackboard, even though other materials were available.
-4- Students’ time on learning
The average attendance rate of children was found to be 66 percent and lower in government schools. At the same time, the shares of repeaters among students were found to be quite high. For example, in government schools, the percentage of children in grade IV who were repeating the grade due to attendance shortage in the previous year was 18 percent.
Attendance rates of children also varied by the time of the day. Student attendance rate dropped after the lunch break; especially in government schools where the midday meal (MDM) was served. Clearly, all enrolments did not get translated into regular school attendance.
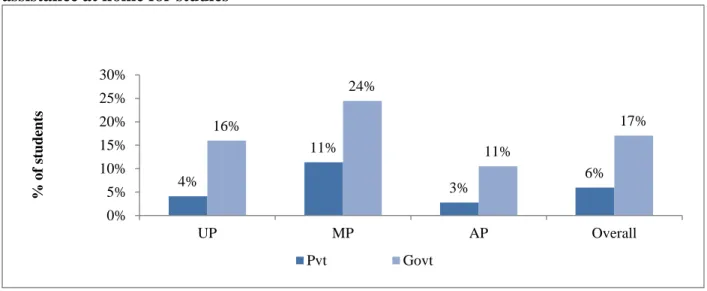
More than 17 percent of government school children do not have an opportunity to learn outside of school (as they do not have space, time or assistance at home). In private schools only 6 percent of children reported no such opportunity. There was a similar pattern in each state, with government children significantly worse off. However, overall children in AP were much better off (11 percent of government school and 3 percent of private school children reported no opportunity to learn outside school) than in MP (24 percent and 11 percent respectively).
Students’ learning outcomes
Across the three states students achieved on average only 54 percent in language and 52 percent in mathematics of the expected skills and knowledge at this age. Not surprisingly, learning achievement scores were better for those children from better economic background. In this study, the difference in language achievement between a child from the poorest and from the richest quintile was 18 percentage points in AP, 14 percentage points in MP and an astonishing 25 percentage points in UP. Students in a single grade class situation fared better than those studied in multi-grade classrooms. For example, in mathematics the average scores in single grade and multi-grade were 68 percent and 62 percent, respectively, in AP, 53 percent and 40 percent respectively in
MP, and 52 percent and 44 percent respectively in UP.
The student level factors contribute or take away from student outcomes in this study in many of the ways one would expect from the broader literature on learning outcomes.
However, there are some surprises. Boys do better overall when compared to girls though with some important caveats, while children with better educated fathers but not better educated mothers do better, students belonging to the general category do not do significantly better than other social groups, and there is little advantage to urban schools over rural schools.
There are also some other important policy implications, including some counter-intuitive results, regarding grade repetition, teacher type, teacher qualifications, and government versus private schools. Children who repeated grades tend to do worse. This provides support for the no-retention policy introduced under RTE. It also indicates that additional efforts are needed to ensure children attend and to give sufficient support so that children can learn what they need to learn the first time through. While making children repeat a grade does not improve their performance significantly, neither does poor quality education in the age-appropriate grade.
Looked at in detail, teachers’ qualifications and backgrounds do not have much impact on student performance. Considering the results overall, there are some correlations, though not all one might expect. For example, having a professionally qualified teacher did support better learning outcomes; but children taught by more experienced teachers did worse overall, as did children whose teachers had more than a Bachelor’s degree.
However, these results hold true only when the results overall are considered; looking at the results in more detail reveals fewer correlations with performance, good or bad. In UP, the results follow the general picture in that children with professionally qualified teachers did better and those with teachers who had more experience did worse; but in AP and MP teachers’ qualifications and experience made no difference in either direction. Similarly, as with
-5- the overall results, teachers with more than a Bachelor’s degree did worse in government schools, but there was no significant impact of more education of teachers in private schools or in any one state. The contractual status of teachers (regular versus contract) has no effect on performance.
Private schools have several advantages over government schools, both with respect to the students they teach and the endowments of the schools. The mean scores of private schools were higher than those of government schools by about 23 percentage points.
Students from richer, educated families tend to choose private schools and such children are also better equipped with support from home and facilities and more opportunity to learn outside classrooms. However, even when all these advantages of private schools are taking into account, they retain a performance advantage over government schools. Overall, the difference remains at 15 percentage points.
Finally, teachers’ pedagogical practices do have an impact on learning outcomes, thus confirming the initial rationale for this study to examine in detail how teachers teach in the classroom. Where more of teachers’ time was used engaging in student-centric activities, performance was better. These results held true for all states and types of school, though the results were statistically significant only in AP and MP. Similarly, where more students were engaged in learning time with teachers, results were better; though, again, significantly so only overall and in MP. The conclusion that might be drawn from this evidence is that teacher pedagogy makes a difference, but good practice is not yet sufficiently widespread to make a big difference for a large number of pupils.
Reflections
First, State policy can make a difference. One of the most striking findings in the report is how similar private schools are to government schools in the same state, and how private schools in one state look more similar to their government school neighbors than to private
schools in another state. Second, state governments can make a difference in teacher attendance through planning and implementing the official school calendar, as well as reviewing policy and practice for official leave.
Third, good teaching practice makes a difference to student learning outcomes. More student- centric activities would lead to better learning outcomes for children. In this respect, it is deeply worrying that only one-third of teachers said that they found the training they attended to be useful. Policy makers and training providers need to review urgently the training being offered and to develop methodologies for assessing the impact on the teaching-learning processes that take place in the classroom.
Fourth, students suffer from a lack of learning opportunities in multiple ways. They do not attend school even if they are enrolled.
Children’s learning opportunities outside school vary (and again the similar pattern across private and governments schools within states is more striking than the similarities across states).
Moreover, as this study has shown in detail for the first time, students miss out of learning time because of the prevalence of off-task activities and, especially, rote learning and teacher-centric activities.
Fifth, the classroom observations reveal plenty of examples of good teaching practice even in the most difficult circumstances. More widespread presence and especially use of other learning materials would help spread good teaching practice more quickly.
-6-
-7-
CHAPTER 1: INTRODUCTION
Context and Objectives
India has made tremendous progress towards improving access to elementary education. The Government of India is committed to attain the Millennium Development Goal (MDG) of universal primary school completion by 2015. Continuing and consolidating the initiatives introduced under various primary education projects such as Lok Jumbish and the District Primary Education Projects (DPEP), the Government of India (GoI) launched its flagship program, Sarva Shiksha Abhiyan (SSA) in 2001 whose objective is universal primary education of satisfactory quality for the 200 million plus children in the age group of 6-14 years. More than 97 percent of the habitations in the country now have access to primary schools within a square kilometre distance. Around 192,000 primary schools and 106,000 upper primary schools were constructed, 1,604,000 additional classrooms were provided, 223,000 drinking water facilities and 584,000 toilets were built in schools under SSA (up to March 2012) (Planning Commission (Government of India), 2013). In addition, more than 1,965,000 teachers were appointed. Teachers are provided with in-service training and Teaching Learning Materials every year, and children are provided with free text books (in addition to other incentives like midday meals). Community mobilization and involvement of Village Education Committees (VECs) in education management is also encouraged to increase accountability in education service delivery.
Better provision, improved infrastructure and availability of more teachers have resulted in increased participation of children in elementary education. The analysis of enrolment figures at elementary level increased from around 160 million in 2002-03 to more than 199.7 million in 2007-08 (National University of Educational Planning and Administration, 2013). The gender and social gaps are narrowing, with more girls and children from marginalized groups like Schedule Caste (SC) and Scheduled Tribes (ST) increasingly coming to school. Gender and social parity are almost achieved in the case of primary education and improving at the upper primary level.
Yet, there are areas of major concerns, especially related to quality and learning outcomes.
Concerns about low learning outcomes persist, especially in the context of the huge number of first generation learners coming to school. Though primary retention rates have improved from around 53 percent in early 2000s to 80 percent in 2012-13 (National University of Educational Planning and Administration, 2013), it still means that around one fifth of the cohort is not reaching the final grade of primary. Transition rates from primary to upper primary have improved (from less than 74 percent in early 2000s to 87 percent in 2012-13 (ibid), but more than 10 percent of primary completers still do not go to the upper primary grades. Average learning levels of children has continued to be low, with only marginal improvements between Baseline Assessment Surveys (BAS) and midterm Assessment Surveys (MAS). For example, in Grade III in 2004, the average score nationwide in Math was 58 percent and in Language, 63 percent; the mean scores improved marginally to 60 percent in Math and 67 percent in Language by 2007. In Grade V, over the same period, the average score for Math has improved only slightly from 46.5 percent to 48 percent and for Language, from 58.6 percent to 60 percent.1 By the end of the elementary education (usually Grade VIII but Grade VII in some states), the average scores were around 38 percent (30 percent in Grade VII) for Math and 52 percent for Language.2 By 2007 this had risen only to 41.5 percent (39 percent) and 56 percent (52 percent). National surveys conducted by Civil Society Organizations like PRATHAM show that there are still substantial proportions of children in
1 NCERT is now using an updated methodology for the national assessment surveys. The first cycle using this Item Response Theory (IRT) approach was Class V in 2009, and all future cycles will use this methodology. However, the results reported for the 2009 cycle are not comparable to the earlier rounds and so are not reported here.
2 Remember also that by the end of elementary education more than 40 percent children who started in Class I had dropped out, and the learning outcomes of those who have dropped out is almost certainly significantly lower than those who remain in education.
-8-
grade V whose competency levels are lower than those expected of children at the end of Grade II (ASER Centre, 2013).
However, defining quality as a process in education or processes leading to good learning outcomes is complex. At the macro level, the concept of quality encompasses many aspects, including those related to inputs, outputs/outcomes and processes. Quality education as has been described as what students learn, how well they learn and what benefits they draw from their education (UNESCO, 2005). At the micro level, quality becomes specific interventions or actions. UNESCO (2005) looks at quality through 5 central dimensions that influence the core process of teaching and learning, such as: (a) learner characteristics, (b) context, (c) enabling inputs; (d) teaching and learning; and (e) outcomes. UNESCO’s framework to understand and interpret the notions of quality places learners at the center of the teaching learning process in a policy framework aimed at improved quality (Box 1).3
Several aspects of quality have already been investigated beyond learning outcomes, which include teacher attendance and availability, governance and accountability. The study by Chaudhury et al. ( (Chaudhury & et al., 2004)) found high teacher absenteeism rates – around 25 percent – among Indian teachers, and more than 30 percent in some states. The study further reported that among those who are present, only half of them were engaged in teaching learning activities. MHRD’s study (Ed.CIL, 2007) shows improvement in teacher attendance rates, but student attendance rates are still a concern, and quite high at 30 percent at primary level. Completing elementary education of satisfactory quality means not only expansion of access and increase in enrolments, but also ensuring that children attend school regularly and internalize skills at appropriate ages. This in turn depends on how well students are taught.
Other indicators related to quality that have been investigated are those related to teacher availability or teacher training related variables, for example, indicators such as PTR, number of schools and districts with PTR above certain norms, percentage of teachers trained and teacher education.
Box 1: UNESCO’s Framework for defining and monitoring Quality
A framework for understanding, monitoring and improving education quality developed by EFA places learners at the center of teaching and learning process, emphasizing that, from the outset, policy must acknowledge their diverse characteristics, context and learning needs. Learner characteristics and enabling inputs (especially teaching and learning) together form a process that takes place within classrooms, aimed at imparting good education and learning experience.
3 This study was conducted before the World Bank regional study on the quality of education, which uses a different framework, based around learning outcomes (World Bank, Forthcoming).
Education sector Policy Enabling environment
School Management &
Governance Knowledge
Infrastructure
Learner The
Teaching Learning
Human &
Physical resources
-9- Source: (UNESCO, 2005)
This study is an effort to look at some of the “enabling inputs” or processes in Indian classrooms, especially those related to teacher availability, instructional time, and the nature of tasks. What happens in the school or classrooms determines the quality of processes in teaching and learning.
Teaching (and learning) time, teaching methods, systems of assessments, feedback and incentives to improve are core to the process of teaching and learning.
School governance and accountability are linked to quality, hence there was a need to link these issues to processes related to teaching and learning. A third factor triggering this study is related to processes in the realm of school management, governance and accountability, issues of which were increasingly being linked to quality issues, especially after the World Development Report 2004 (World Bank, 2004). While there are positive signs of improvements in teacher and student attendance, there was a need to go beyond teacher attendance, to see whether teachers have sufficient time in school to devote to teaching learning activities and how they use time within classrooms. In short, it is not mere teacher presence time in school that matters, but whether that time is sufficient in providing students with optimum “opportunity to learn” higher order skills. These concerns also arise from the fact that the majority of schools in many educationally poorer states are organized into multi-grade classrooms, and children attending schools now come from more diversified backgrounds, and a large number are first generation learners.
This study focuses on the link between teachers’ “time-on-task” (TOT) and the nature of tasks in classrooms. This study, carried out with concurrence from MHRD, is built upon the independent study commissioned by MHRD to explore teacher attendance rates in schools. This study ventures beyond the quantitative dimensions of teacher attendance (physical presence) to look at the ‘time-on-task’ (TOT) and
Learner Characteristics
• Aptitude
• Perseverance
• School readiness
• Prior Knowledge
• Barriers to learning
Enabling Inputs
• Teaching & Learning Materials
• Physical infrastructure & facilities
• Human resources: teachers, administrators etc
• School governance
Outcomes
• Literacy, numeracy and life skills
• Creative & emotional skills
• Values
• Social Benefits Teaching and Learning
• Learning time
• Teaching Methods
• Assessment, feedback, incentives
• Class size
Context
• Economic & labor market conditions in the community
• Socio-cultural & religious factors
• Educational knowledge & support infrastructure
• Public resources available for education
• Competitiveness of the teaching profession on the labor market
•National governance & management strategies
•Philosophical standpoint of teachers and learner
•Peer effects
•Parental support
•Time available for schooling and homework
•National standards
•Public expectations
•Labor market demands
•Globalization
-10-
nature of tasks, that is, the quantity and quality of teacher presence and interaction. Most specifically, it will provide insight into the work environment of teachers who are the key to service delivery and suggest implications for both policy and program interventions to empower teachers and introduce more accountability into the system. The McKinsey & Company study (Barber & Mourshed, 2007) identified three things that matter most: (1) getting the right people to become teachers; (2) developing them into effective instructors; and, (3) ensuring that the system is able to deliver the best possible instruction for every child. In the present study, the attempt is to see whether the teachers are “effective instructors” and the system is delivering the best to its children.
Research Questions: The study aims to find out the factors that facilitate improved quality of instructional time on the one hand, and what it means to the whole process of improving learning levels on the other. In addition, there is an effort to understand the characteristics of various enabling inputs (Box 2).
Box 2: Specific issues addressed in this report
Since the specific focus of the study is to understand the “time-on-task” and the nature of instructional time, the specific questions addressed in this study are the following:
A. How many school days (in the academic year under reference):
• were prescribed (by the state/ districts/ local body authorities) for the primary schools /grades to function?
• did the school function in reality? What accounted for the loss of time between allocated days and actual days available?
• did the teachers attend schools during the school functioning days? What accounted for the leakage of time from school functioning days to teacher physical presence days?
• did the teachers devoted totally to non-academic activities within the total teacher presence days in school? What was nature of the non-academic activities that accounted for a few full school days?
B. How many hours/ share of time (within the total teacher presence days):
• Did teachers spent on non-academic activities during school functioning days within school in the academic year under reference? What were the non-academic activities they engaged in?
C. How much of the weekly working hours
• Did the teachers spent in school? How did they distribute the time between various academic activities and non-academic and administrative activities?
• Did the teachers devoted to classroom teaching?
D. Within each classroom period,
• What proportion of time was devoted to academic tasks, organizing activities and activities that is in the nature of off-(any academic) task?
E. All the above, analyzed by
• school characteristics such as: (a) type of school management, (b) location of schools; and (c) schools by levels of grades; and
• Teacher characteristics by (d) gender of teacher; (e) type of teacher appointments; (f) teacher education and training; and (g) teachers by experience in service.
F. Nature of tasks (within classroom and a period) by:
• Category I tasks, Category II tasks, Category III tasks, tasks in the nature of organizing classroom process and off tasks
• Nature of tasks by school characteristics, teacher characteristics, grades addressed, subjects taught, and mono-grade and multi-grade situations
• Use of materials in teaching learning process, and the type of materials used.
-11- G. Classroom environment while teaching in terms of
• Teacher interaction with students, teacher movements within class, legibility of writing and clarity of speech,
• Classroom environment in terms of lighting, space, seating arrangements, number of students etc.
H. Students’ time and involvement
• Students attendance rate in general
• Students involved in classroom teaching learning tasks with students and nature of tasks
• Students on their own within the classroom and the nature of tasks
• All the above by various school/teacher/grade/subject characteristics and mono-grade and multi- grades, and in multi-grades, when teacher is addressing the grade and other wise.
I. Learning levels of Grade IV students
• Average scores of students in Mathematics and language
• Learners’ background characteristics J. Teacher perceptions and views about:
• Hindrances to daily teaching
• Students’ learning and approach towards teaching
• Usefulness of training
• Interactions with parents/ community
Instructional time use studies: Literature review
Instructional time use has been studied from broadly two different perspectives. Under the first approach, research has tried to understand, define and predict “time use” or “time loss” in schools or in classrooms. Here, measuring instruction time itself was the main objective. Focus was mainly on defining, understanding and measuring time on instructional activities either in school, or within classrooms, of either teachers or students or both.4 Some of the studies explored the nature of task within instructional time while other studies looked at factors that led to instructional time loss.5 This “school effectiveness” approach is to see how teachers manage instructional time in classroom. The assumption here is that student achievements increase in environments in which time-on-task activities predominate.
4 For example, Rossmiller (1983)’s analysis showed that in US, “during a typical school year of 1080 hours, students actually receive academic instruction for 364 hours or 34%”. Prior to this, Fischer et al (1978) estimated that the academic learning time in US classrooms amounted to 2/3rds of the total engaged time of children. The recent study conducted by NICHD and the University of Virginia (2007) concluded that children in US classrooms have less than 20 percent chance of having a rich classroom experience. In another study in Peru (Amadio, 1997), it was found that students were being taught only 50-80 percent of the official class hours, which itself was as low as 720 hours per year. In rural areas with single-teacher schools and multi-grade classes, the estimated instructional time did not amount to 30 percent of the total official time. Abazi (2006) reported that the average instructional time in
classrooms were more in the range of 70-85 percent - in Brazil – 72 percent, Ghana, 70 percent, Morocco 82 percent and in Tunisia 86 percent. Worldwide, yearly instructional hours are, on an average, lower in grades 1–3 and higher in grades 4–6. Indeed, there is a systematic increase of about 20–30 hours per grade level, with the global mean moving from 705 hours in grade 1 to 830 hours in grade 6 (Benavot, 2002, Abadzi 2007). However, that global annual intended instructional time has not increased since the mid-1980s and is often well below 1,000 hours (UNESCO, 2005, based on Benavot, 2004).
5 Rossmiller’s (1983) study arrived at instructional time by deducting time allocated to non-instructional activities (lunch, class passing and attendance taking), process activities (distributing materials, establishing order and disciplining the students). Dia (2003)’s study shows that substantial time was lost in writing lessons and problems on the board in Gambian and Burkina Faso classrooms, because students lacked text books. Benavot (2004), in his study of instructional time across countries concluded that meeting demand for increased access under resource constraints, particularly developing countries, may have resulted in reductions in instructional time (Benavot, 2004).
-12-
The second approach used instructional time as a factor in explaining learning outcomes. In this approach, instructional time and type of activities is treated as a process, and is a determinant of educational outcomes.6 In the second set of studies – that takes the “opportunity to learn” approach – school based process variables like instructional time, which frame and delimit pupil’s learning opportunities, are key factors in determining pupil achievement. As Millot and Lane (Millot & Lane, 2002) point out “while there is an intuitively appealing, and almost trivial, connection between time input and educational outcomes at the macro level, it is very difficult to isolate the contribution of time at the micro, or classroom level. Although the concept of time use at first seems straightforward, the actual measure is complex (210)”.
The findings of the studies, however, vary. There is early research which did not show any consistent relationship between teachers and learning achievement of students.7 Coleman (Coleman, 1990) further suggested that the most important impact on student achievement was the socioeconomic background of students rather than the schools themselves. There are others who found some linkages, but too weak to establish any significant relationship between length of schooling and learning outcomes.8 Some of the later studies, especially those since 1980s, have shown the positive and consistent relationship between instructional time quality and learning achievements.9 As later research focused on classroom observation of teacher behavior, more systematic links between some teacher characteristics (e.g., clarity, flexibility, enthusiasm, ordered preparation) and pupil performance were suggested (UNESCO, 2005).
6 Instructional time in various forms was among the few conditions that enhanced school effectiveness (Purkey and Smith, (1983) who identified role of instructional time in terms of time on task, reinforcement, streaming; Levine and Lezotte, (1990) who emphasized on effective instructional arrangement; Scheerens, (1992) whose focus was on Structured teaching, effective learning time, opportunity to learn; Cotton, (1995) focused on the role of Classroom management and organization, instruction; and Sammons, Hillman and Mortimore, (1995) who talked about instruction time and purposeful teaching time). Stallings (1985)’ study points towards the role of effective learning time, class organization and management, teaching strategies and instruction, and assessments and teachers’
expectations in improving student learning outcomes. These studies also have shown that making school day is not necessarily lead to better performance, if the effectiveness of the time spent does not improve. Stallings and Mohlman (1981)’ study has shown that effective teachers spent some 15 percent of the school day on organization, management and lesson planning; 50% on interactive teaching and 35 percent on monitoring student’s work (UNESCO, 2005).
7 For example, research by Medley and Mitzel (1963), Rosenshine and Furst (1973), Smith (1979), Borg (1980) etc.
8 (Anderson (1980, 1981); Blai (1986); Borg (1980); Brown and Saks (1986); Cotton and Savard (1981); Fisher and Berliner (1985); Fredrick and Walberg (1980); Honzay (1986-87); Karweit (1976, 1985); Leach and Tunnecliffe (1984); Levin and Tsang (1987); Lomax and Cooley (1979); Mazzarella (1984); O'Donnell (1978); Quartarola (1984); and Walberg (1988). Hanushek (1986)’s research also suggested that “Teachers and schools differ dramatically in their effectiveness”. There are many studies that have established the positive correlation between the length of schooling and the learning outcomes (for example, Wiley and Harnischfeger 1974; Kidder, O'Reilly, and Keisling 1975). A review of research evidences by Wang, Haertel and Walberg (1993) ranked factors that have been found to influence student achievement from high to low thus: (a) student characteristics, (b) classroom practices, (c) home and community educational contexts, (d) design and delivery of curriculum and instruction; (e) school demographics, culture, climate, policies and practices; and (f) state and district governance and organization (UNESCO, 2005).
9 School-based instructional time to be especially significant for poor children, whose out-of-school learning time was limited (Suryadi, Green and Windman (1981). A review carried out by Walberg and Fredrick (1991) found that around 88 percent of the studies showed positive influence of time on learning. Reimers (1993) showed that teaching time by itself was a poor predictor of student achievement; but effective use of time was a more accurate predictor. Another set of studies found that improved use of time devoted to learning, by facilitating more pupil- oriented teacher behavior have had significant impact on learning processes and in higher achievement levels (Tan, Lane and Coustère (1997)’ study in Philippines, Verwimp (1999) study in Ethiopia). Fuller and Clarke (1994) also showed that instructional time is one of three major areas (in addition to teacher quality and textbook availability) in which consistent achievement effects obtain.