The relationship between public balance and inflation in Europe (1999-2007)
Miklós-Somogyi, Patrícia and Balogh, László
Working Paper No. 65 June 2009
k*
b
0 k
B A M
AMBERG CONOMIC
ESEARCH ROUP
B E R G
Working Paper Series BERG
on Government and Growth
Bamberg Economic Research Group on Government and Growth
Bamberg University Feldkirchenstraße 21
D-96045 Bamberg Telefax: (0951) 863 5547 Telephone: (0951) 863 2547 E-mail: public-finance@uni-bamberg.de http://www.uni-bamberg.de/vwl-fiwi/forschung/berg/
ISBN 978-3-931052-72-0
Reihenherausgeber: BERG Heinz-Dieter Wenzel Redaktion
Felix Stübben
∗∗ felix.stuebben@uni-bamberg.de
The relationship between public balance and inflation in Europe (1999-2007)
Miklós-Somogyi, Patrícia – Balogh, László Ph.D.
Chair of Economics and Finance University of Kaposvár, Hungary
Abstract
The study considers some of the factors determining budget balance. In particular, it investigates the relationship between budget balance and inflation. The analysis focuses on European states in the period between 1999 and 2007, and concludes that the relationship between budget balance and inflation is not demonstrable. In the literature, attempts to quantify the relationship between the two factors have faced severe difficulties.
Inflation influences both the revenue side and the expenditure side of the budget, often increasing one and reducing the other at the same time. These effects might balance each other out, leaving the budget balance unchanged.
(budget balance, budget deficit, inflation)
Table of contents
1. Introduction ... 3
2. Relationship between state of development and budgetary categories... 4
3. Relationship between inflation rate and the rest of the categories... 6
4. Relationship between the factors of public finance ... 8
4.1. Expenditure-to-GDP ratio depending on revenue... 8
4.2. Relationship between gross government debt and expenditure ... 9
5. Public balance and inflation in Europe between 1997 and 2008 ... 10
6. Relations between inflation and public balance... 11
6.1. Segmentation... 11
6.2. Regression analysis ... 12
6.2.1. Relationship of inflation and budgetary categories... 13
6.2.2. Factors determining public balance... 13
7. Conclusions ... 14
8. References ... 15
9. Appendix ... 16
1. Introduction
The objective of our study is to introduce and analyse the development level and government deficit/surplus of European countries and to analyse and define the relation between inflation rate and public balance. These two factors interact; thus, both directions of the relationship can be analysed, that is, the influence of the change in inflation rate on public balance as well as the impact of balance on the inflation rate. Numerous theoretical approaches can be found considering both issues in the relevant literature. We summarise these theories by showing the role inflation plays in determining government revenue and expenditure, and thus the way it affects the budgetary situation. Following the theoretical argumentation, the interrelations of factors defined in the previous will be presented by using various methods in the international comparative analysis of the variables.
In the relevant literature, the usual way of discussing the relation between inflation rate and public balance is the following: if there is a budget deficit, the acceleration of the inflation can be expected; while if the budget has surplus, the inflation slows down.
According to Erdős (1991) it can be stated that deficit does not always result in inflation even if it is covered by issuing money, and even less so if the deficit is covered by borrowings from private sector (the population or companies). Assuming given and stable amount of GDP, the government deficit covered by money-issuing will not influence inflation if it amounts to not greater than the increase of the amount of money that is intended to be spent on consumption by the public sector. Similarly, it will not cause an increase in inflation rate when government buying expenditures are covered by taxes paid by the private sector. The problem, however, is that gradually decreasing amount of deficit can be financed in this way only when inflation accelerates. In case the deficit is intended to be covered by borrowings by the government, this is possible only in limited extent due to the interest rate. There will be no problem if the GDP increases; hence increasing income induces increasing tax revenue; thus the limit of the government deficit is determined by the growth rate of GDP.
In this paper, however, we do not investigate the factors influencing the inflation rate, nor the way government deficit affects inflation. The current study intends to answer the question:
what effect does the change in inflation have on the government deficit/surplus?
Macroeconomic theory assumes an obvious relation between these two factors. However, although their interaction is evident, it is difficult to quantify. Several foreign and Hungarian researchers – among others Erdős (1997), (1998), (1999) – pointed out that inflation heavily influences government revenue and expenditure. Thus it is interesting to determine what impact it has on public balance. The impact depends on two factors: 1, the interest paid on borrowings, as the nominal interest rate is adjusted to inflation rate, thus net saving on the interests can be achieved by lowering inflation rate
1; 2 its impact on the government seigniorage income. Thus, if inflation decreases, the government deficit can be reduced only if the effect of the former factor is greater than that of the second one. It is however not certain that the nominal interest rate on borrowings will promptly change due to the inflation change, nor that the rate of change will be similar to the change of the inflation rate. This greatly depends on the share of the long term fixed-income securities within the financing structure.
Erdős claims base money can be generated in three different ways, on the basis of which he distinguishes between various seigniorage definitions. His final claim is however the
1 Net interest burden decreases the interest to be paid on internal borrowing excluding the bank of issue. This decline cannot be seen in the budget balance after the debt to the bak of issue, because the paid interest on this debt flow back to the budget through the profit of the bank of issue.
following: decreasing inflation leads to decreasing seigniorage-incomes, which in turn worsen public balance. The questions are what savings in net interest expenditures can be expected due to decreasing inflation rate, considering the interests to be paid on domestic borrowings of the government budget excluding central bank debt, and what decrease in the government revenues is due to the loss of part of the seigniorage income. Erdős’s findings are based on the developments in the nineties in Hungary. He found that lowering the inflation rate can result in significant improvement in the budget balance (Erdős, 1997). Thus, the impact of the decrease in interest expenditure is stronger than that of the revenue due to the decreasing seigniorage-income. Starting from this point we examine to what extent inflation may influence the government expenditure, revenue and public balance. It is not easy to answer the question, however, since different countries have varying development status, inflation rate, growth rate, seigniorage-income
2, and internal debt, which fundamentally influence the results of the study. Given that countries are at varying stages of development, and that the inflation rate in countries with lower price level the inflation rate is necessarily higher due to the convergence of the real price level, in these countries higher government deficit can be expected according to the theory. The question is whether this claim can be proven by the analysis of the countries involved in the current study.
In their research on the relation of fiscal deficit and inflation, Catao and Terrones (2003) found that in case of countries with higher inflation rate there is an obvious relation between the inflation and government deficit. Our analysis, however, shows no significant relationship, since inflation rates in their study were substantially higher than what we found.
They used data from much longer time series, including 107 countries in their analyses. As we shall later see, inflation was low in tEuropean countries, with correspondingly different budget situation.
The current study thus deals with the relationship between inflation and government budget.
All of our analyses were based on Eurostat data. In order to reveal the relation between variables several regression models were set up aided by Microsoft Office Excel and the econometric software package Gretl. The data sets origin from 1999 to 2007 and cover the EU-27, Iceland, Croatia, Norway and Turkey. The exact sets of data involved in the analysis are indicated in each phase of the analyses, as some data were not available and the software packages made the calculations on the basis of the involved variables.
2. Relationship between state of development and budgetary categories
At first, we analyse state of development, budget balance, government expenditure and revenue, and government debt. We use correlation matrix to define the linear relations between the variables (see Appendix); on the basis of this we found that the development status and government debt are uncorrelated; there is weak correlation between the development level and expenditure-to-GDP ratio. Of course this holds only for the examined countries and for the average data from between 2001 and 2007, thus the finding cannot be generalised. Positive and moderate correlations were found between GDP per capita and public balance as well as the expenditure-to-GDP ratio.
2 Seigniorage income is smaller in developed countries than in less developed ones, which is true for the analysed European countries as well.
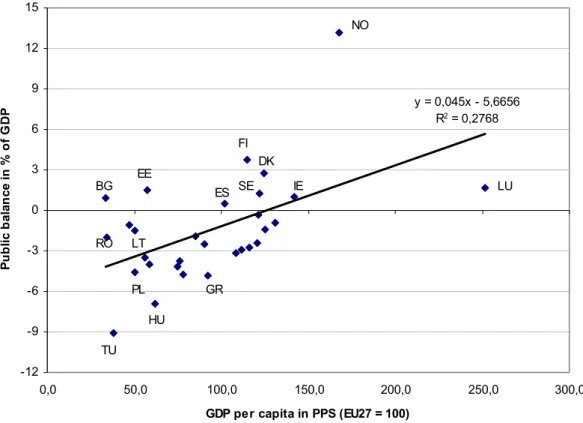
Thus, the more developed a country is, the higher its revenue-to-GDP ratio is, therefore the better situation the government budget is in. Figure 1 shows the linear relationship of GDP per capita and public balance,
3while Figure 2
4that of development and government revenue.
Linear regression shows that public balance is determined by the development status of the country by 27.68 per cent; if the GDP per capita increases by 10 per cent of PPS, 0.45 percentage point better balance can be expected on average. Luxembourg, as the most developed country
5, is an outlier, while the similarly highly developed Norway poorly fits the regression model due to its outstanding government surplus. The budgetary situation of Bulgaria, Estonia and Finland is better than it could be expected on the basis of their development status; because they can be found much higher than the regression values.
Compared to their development status, Turkey, Hungary and Greece have worse budgetary situation.
Figure 1: Public balance in the percentage of GDP depending on development status
y = 0,045x - 5,6656 R2 = 0,2768
-12 -9 -6 -3 0 3 6 9 12 15
0,0 50,0 100,0 150,0 200,0 250,0 300,0
GDP per capita in PPS (EU27 = 100)
Public balance in % of GDP
TU HU
LU NO
FI
IE
GR BG
RO
PL LT
EE DK
ES SE
Source: Own construction based on Eurostat data sets
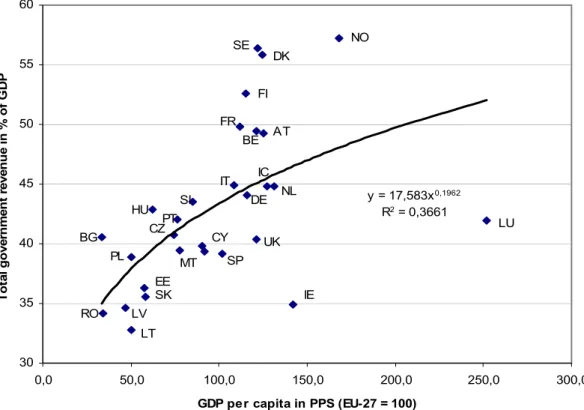
According to the results, the more developed a country is, the higher is its revenue. On the basis of the regression model, if GDP per capita increases by 1 per cent, the revenue-to-GDP ratio will grow by 0.196 per cent in general. The Figure indicates that Scandinavian states (Finland, Sweden, Denmark, Norway) and France, Belgium and Austria have much higher revenues than that it could be expected according to their development level. According to the regression model a GDP-to-revenue ratio of approximately 45 per cent would be reasonable, considering the data of similarly developed countries (Cyprus, Italy, Germany, Iceland).
Compared to its outstanding development, Luxembourg, as well as Ireland, has much lower
3 The calculation was based on the average data of the EU27, Croatia, Turkey and Norway between 2001 and 2007.
4 The calculation was based on the average data of the EU27, Iceland and Norway between 2001 and 2007.
5 Development is indicated by GDP per capita.
government revenue than the regression value would indicate. The GDP-to-revenue ratio of the rest of the countries fits the regression model. It is important to note that the data of Hungary also fits the model, thus the government revenue of the country amounts to what can be expected on the basis of its development stage.
Figure 2: Total government revenue in per cent of GDP depending on development status
y = 17,583x0,1962 R2 = 0,3661
30 35 40 45 50 55 60
0,0 50,0 100,0 150,0 200,0 250,0 300,0
GDP per capita in PPS (EU-27 = 100)
Total government revenue in % of GDP
NO
LU
SE DK
FI
FR AT
BE
IE
LT
RO LV
SKEE PL BG
HU PT CZ
SI
MT
UK SP CY
IT IC DE NL
Source: Own construction based on Eurostat data sets
3. Relationship between inflation rate and the rest of the categories
The regression analysis of development and inflation rate showed moderate negative relationship. It is interesting to find such a definite correlation, because in my previous studies the regional inflation analysis of Italy gave not such obvious results; it seemed that there is no relationship between the development and inflation (Somogyi, 2006). I had two hypotheses with opposite directions concerning inflation:
•
If a region/country is less developed and we assume price convergence across the countries, the lower price level of the less developed region/country may generate higher inflation in the course of the convergence.
•
In those – more developed – regions where the consumption expenditure is high, the inflation rates are likely to be higher due to the demand effect; while where the consumption expenditure is lower, the inflation rate can be lower due to the lack of demand.
Assuming these hypotheses the relationship of the two variables was not obvious in the above
mentioned cases, however the definite negative correlation coefficient obtained for the EU
countries allows us to conclude that the first effect is stronger than the second one; that is, due to the Balassa-Samuelson effect the less developed regions have higher inflation rate.
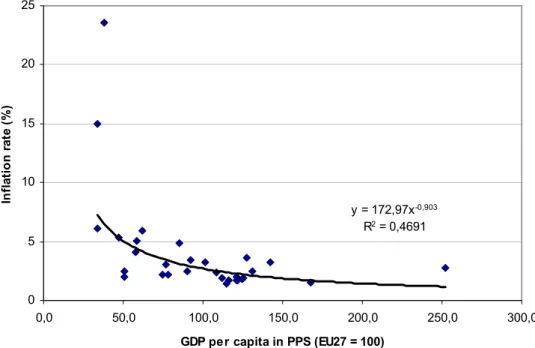
The analysis of the regression indicated that the best fitting regression model was the multiplicative regression model; the coefficient of determination was (R
2) 46.91 per cent, that is the GDP per capita determines the inflation rate in 46.91 per cent. On the basis of the regression model, if GDP per capita increases by 1 per cent, the inflation rate decreases by 0.903 per cent per cent on average. Figure 3 shows the inflation rate in its relation with development level
6.
Figure 3: Inflation rate depending on development status
y = 172,97x-0,903 R2 = 0,4691
0 5 10 15 20 25
0,0 50,0 100,0 150,0 200,0 250,0 300,0
GDP per capita in PPS (EU27 = 100)
Inflation rate (%)
Source: Own construction based on Eurostat data sets
The correlation coefficient matrix indicated moderate negative correlations between inflation rate and budget balance as well as the revenue and expenditure of the government. This indicates that an increase in the inflation rate results in worsening balance and the decrease of expenditures and revenues. That means that the balance worsens because the expenditure decreases to a lesser extent than revenue. Correlation between expenditure and balance was not found, thus changes in the expenditure do not follow the change in the balance.
The linear regression analysis of the budgetary balance and inflation shows that the coefficient of determination was 16.1 per cent, which was found too low in the course of the F-test (F=5.37; p=0.03), thus this model did not allow us to draw consequences. Although logarithmic model fit better it was not significant either (R
2=19.2 per cent); thus these statistical methods did not prove the relationship between inflation and budgetary balance.
We can expect more precise results in the following parts of the study, where we analyse the data from the period between 1999 and 2007 with panel techniques.
Multiplicative regression was the most appropriate method to define the impact of inflation on government expenditure and revenue. It was the most fitting model with a coefficient of
6 The calculation was based on the average data of the EU27, Iceland, Turkey and Norway between 2001 and 2007.
determination 35.69 per cent in the first case and 26.76 per cent in the second case. Thus, if inflation increases by 1 per cent, the revenue-to-GDP ratio decreases by 0.174 per cent on average and expenditures by 0.134 per cent on average. This proves the hypothesis that the increase of inflation rate results in lower rate of the expenditure decline than that of revenue.
However, due to the almost similar coefficients, the impact of the inflation on the budgetary balance, defined as the difference between the factors, will be neutral each other as we have seen. Thus let us look at how government expenditure and revenue are influenced by government debt.
4. Relationship between the factors of public finance
4.1. Expenditure-to-GDP ratio depending on revenue
Besides development status and inflation rate, the government’s income centralisation and reallocation are influenced by the social structure and traditions of a given country; thus various typical types of the European countries can be differentiated (Kármán, 2008). Let us see how the revenue-to-GDP ratio and expenditure correlate.
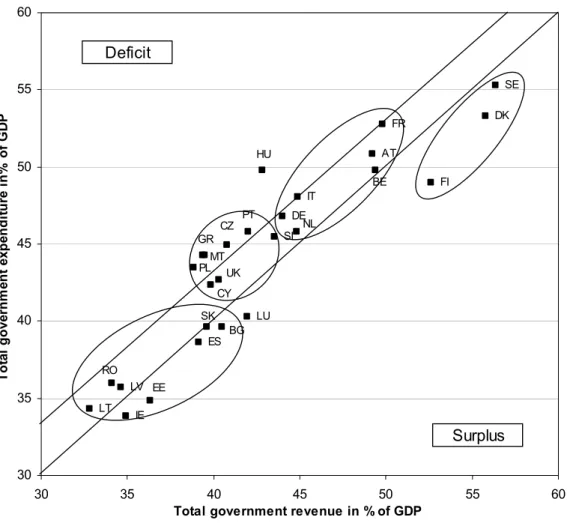
Figure 4: Expenditure-to-GDP ratio depending on revenue (2001-2007, EU-27)
DK
DE
IE
ES
FR
IT
LV LT
LU
AT
SI
FI
SE
BE
BG CZ
EE GR
CY HU
MT
NL PL
PT
RO
SK UK
30 35 40 45 50 55 60
30 35 40 45 50 55 60
Total government revenue in % of GDP
Total government expenditure in% of GDP
Deficit
Surplus
Source: Own construction based on Eurostat data sets
Based on the average data of the EU-27 between 2001 and 2007 (Figure 4) low expenditure-
to-GDP and revenue-to-GDP ratios are typical for the less developed, Eastern European
countries (Lithuania, Latvia, Romania, Slovakia, Bulgaria, Estonia), and for Spain, Ireland
and Luxembourg. A moderate expenditure and revenue level is typical for part of the Mediterranean countries (Cyprus, Malta, Greece, Portugal), and for the rest of the Eastern European countries (Poland, Czech Republic, Slovenia) as well as for the United Kingdom.
Austria and the five founding countries (France, Italy, Belgium, Germany, and the Netherlands) have high expenditure and revenue level. Not only is the redistribution rate high, but typically the budget has deficit too, although mostly below 3 per cent ratio to the GDP. At the end, the Scandinavian countries (Finland, Denmark, Sweden) stand out with their redistribution rate of 50-55 per cent. Hungary is an outlier with almost 50 per cent of expenditure while with revenue-to-GDP ratio only 42.8 per cent It shows that the redistributing function of the government does not correspond with the international pattern.
Similar countries to Hungary have much lower expenditures (by 10-15 percentage points) and revenues (by 8-10 percentage points). Figure 4 shows those countries where either the revenue exceeds the expenditure or the budget has deficit; the upper line indicates the 3 per cent criterion.
There is a definite positive linear relationship between revenue and expenditure. The regression shows that revenue determines the expenditure in 83.76 per cent; if revenue-to- GDP ratio grows by 1 percentage point, expenditure-to-GDP ratio grows by 0.87 percentage point in on average.
4.2. Relationship between gross government debt and expenditure In those countries where debt is low the interest to be paid is also lower than in those countries where debt is higher. The expenditure is highly influenced by the interest to be paid on the debt accumulated in the past.
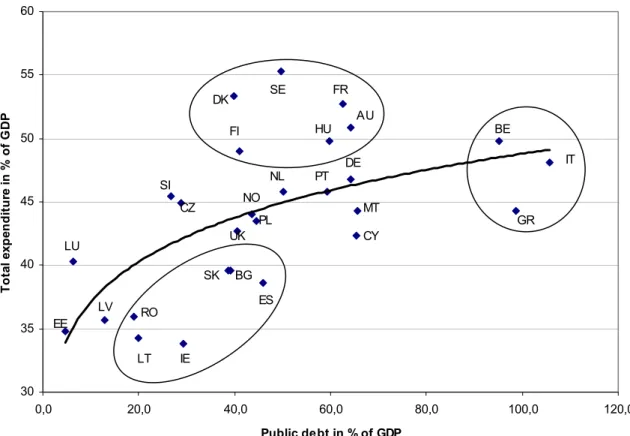
In the current study a strong positive correlation was found between gross government debt and expenditure-to-GDP ratio according to the matrix of the correlation coefficients (see appendix). The regression analysis showed that multiplicative model was the best fitting function (Figure 5
7). According to this model the government debt determinates the expenditure in 40.3 per cent. If debt-to-GDP increases by 1 percentage point, the expenditure- to-GDP grows by 0.119 percentage point in general.
In case of countries with low government debt (around 20 per cent ratio to GDP) the low expenditure is reasonable, however in some countries it is even too low (Romania, Ireland, Lithuania, Bulgaria, Slovakia, Spain). In case of a part of the countries with moderate debt (Denmark, Finland, Sweden, France, Austria and Hungary) expenditure does not correspond with the government debt; they have much higher expenditures. For the three countries with the highest debt (Belgium, Italy, Greece) the high expenditure is reasonable due to the presumably high interest to be paid.
7 The calculation was based on the average data of the EU27 and Norway between 2001 and 2007.
Figure 5: Total expenditure in per cent of GDP depending on the public debt
30 35 40 45 50 55 60
0,0 20,0 40,0 60,0 80,0 100,0 120,0
Public debt in % of GDP
Total expenditure in % of GDP
BE
IT
GR
EE LU
IE
ES
DK SE FR
DE HU
PT FI
CY MT AU
NL
PL NO
UK SI
CZ
RO
LT LV
SK BG
Source: Own construction based on Eurostat data sets
5. Public balance and inflation in Europe between 1997 and 2008
The average level of the public balance of the countries analysed between 2001 and 2007 was around -2 per cent in the first years of the period, then it showed improvement in the last 4 years, with an increase from -1.8 to 0.4 per cent surplus. The minimum values indicate improvement, as well; while in 2001 even a -33 per cent deficit could be seen (in case of Turkey) in 2007 the worst figure belonged to Hungary with -5 per cent. Without exception, it was Norway that had the highest figures representing outstanding values across the EU states.
Significant surplus was seen in case of the Northern EU countries (Finland, Sweden, Denmark).
There was a decline seen in case of inflation rate between 1997 and 2007 for the EU27, Turkey, Iceland and Norway. In 2008, however, it went up in almost all of the countries analysed. The only exception was Hungary, with a further decreasing rate from 7.9 per cent to 6per cent. Since 1997 the EU countries of that time had a moderate inflation rate of around 2 per cent, which typically has not changed even for the last 12 years.
The average rate of inflation of the 30 countries increased to 5.68 per cent from 3.43 per cent, from 2007 to 2008, which was only 12.53 per cent in 1997. This high value was mainly due to Romania that had an inflation rate of 154.8 per cent decreasing to 7.9 per cent in 2008.
Another country with high inflation was Turkey where the rate decreased to 10.4 per cent
from 85.8 per cent in 1997. In 1997, the inflation rate was higher than 10 per cent in Hungary, Poland and Lithuania, while in 2007 only in Latvia, and in 2008 – obviously due to the global economic crisis – Estonia, Latvia, Lithuania, Turkey and Iceland were found with the highest inflation rates. The current analysis however does not cover the year 2008, as budget information was not available for this year. Thus the consequences of the crisis evolving in the second half of 2008 are not covered by our analysis.
6. Relations between inflation and public balance
6.1. Segmentation
The above analysis yielded insufficient results concerning the relationship between inflation rate and public balance. Therefore, we grouped countries into three different segments both in terms of their inflation rate and their budgetary situation. According to the public balance data between 2001 and 2007 those countries were grouped into the segment ‘excessive deficit’
where the deficit was lower than 3 per cent to GDP. Countries between 3 and 0 per cent deficit were grouped into the segment ‘acceptable deficit’, while countries with surplus got into the third segment. For inflation, rates below 2 per cent were considered as ‘low’, those between 2.1-4.2 per cent ‘moderate’ and above it ‘high inflation’.
The question was if there is a relation between inflation and budgetary categories. According to the Cramer indicator (0.31) the relationship is moderate. The table shows that those countries that have low inflation rate typically belong to the ‘surplus’ or ‘acceptable deficit’
categories concerning their budgetary situation. Countries with moderate inflation could be found in any of the budgetary categories; there was not a clear tendency in the relationship of the variables. While in case of countries with high inflation, deficit was typical, with only one exception. The groupings were made on the basis of an arbitrary choice of values, the intervals being defined so as to create groups with similar number of units, and to make it clear which segment a given country should belong around the interval ends. It seems that there are tendencies, however the test of independence showed no significant results (critical value: 9.49 and test statistics: 5.69).
Table 1: Segments of European countries in terms of their inflation rate and budgetary situation
Inflation rate Budget
deficit low moderate high Sum of the observation
Surplus 4 4 1 9
Acceptable
deficit 6 2 3 11
Excessive
deficit 1 5 3 9
Sum of the
observation 11 11 7 29
Source: Own construction based on Eurostat data sets
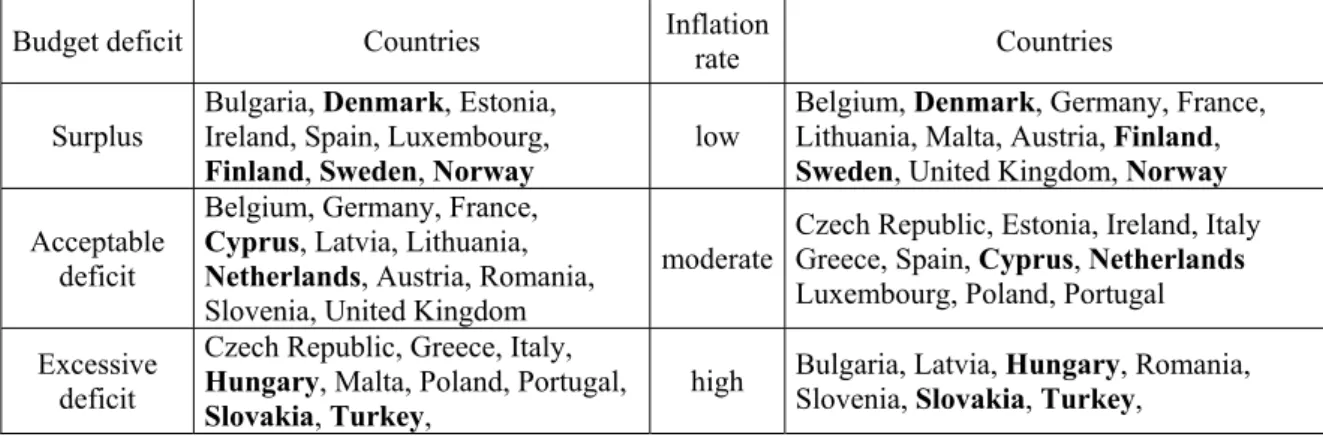
Table 2 shows the segments of countries, highlighting those that belong to same inflation and
budgetary categories. If we assume that higher inflation accompanies worse budgetary
situation, and that in case of lower inflation rate improvement in the budgetary stance can be
expected, then only the Scandinavian countries (Norway, Denmark, Finland and Sweden)
show low inflation rate compared to the government surplus; the Netherlands and Cyprus are in the moderate category, while Hungary, Slovakia and Turkey bear too high (above 3per cent) deficit and high inflation. The rest of the countries do not show this tendency.
Table 2: Inflation and budgetary categories of countries
Budget deficit Countries Inflation
rate Countries
Surplus Bulgaria, Denmark, Estonia, Ireland, Spain, Luxembourg,
Finland, Sweden, Norway low Belgium, Denmark, Germany, France, Lithuania, Malta, Austria, Finland, Sweden, United Kingdom, Norway Acceptable
deficit
Belgium, Germany, France, Cyprus, Latvia, Lithuania, Netherlands, Austria, Romania, Slovenia, United Kingdom
moderate Czech Republic, Estonia, Ireland, Italy Greece, Spain, Cyprus, Netherlands Luxembourg, Poland, Portugal Excessive
deficit
Czech Republic, Greece, Italy, Hungary, Malta, Poland, Portugal,
Slovakia, Turkey, high Bulgaria, Latvia, Hungary, Romania, Slovenia, Slovakia, Turkey,
Source: Own construction based on Eurostat data sets
6.2. Regression analysis
Finally, let us see the results of the last analysis of data of EU27, Iceland, Turkey and Norway between 2001 and 2007. The variables of the regression analysis and the direction of the expected relationship, if it exists, were the following:
8:
•
publicbal: Net borrowing/lending of consolidated general government sector as a percentage of GDP
•
pubrev: Total general government revenue; General government, (per cent of GDP)
•
pubexp: Total general government expenditure; General government, (per cent of
•
GDP) infl: Annual average rate of change in Harmonized Indices of Consumer Prices (HICPs); negative sign: public balance worsens along with increasing inflation (- 0.18); negative sign government revenue declines if inflation increases (-0.17);
negative sign government expenditure decreases along with increasing inflation (- 0.16).
•
debt: General government gross debt; Percentage of GDP, Million EUR, per cent of GDP; negative sign: public balance worsens if government debt increases (-0.23)
•
GDPpercap: GDP per capita in Purchasing Power Standards (PPS) (EU-27 = 100);
positive sign: public balance improves along with increasing GDP per capita (0.50)
•
realgrowth: Real GDP growth rate, Growth rate of GDP volume - percentage change on previous year; positive sign: public balance improves if growth rate is better (0.14)
•
unemp: unemployment rate (per cent); negative sign: public balance worsens if unemployment rate increases (-0.38)
•
labprod: Labour productivity per person employed, GDP in Purchasing Power Standards (PPS) per person employed relative to EU-27 (EU-27 = 100), positive sign:
budgetary situation improves if labour productivity increases (0.44)
8 Brackets contain the coefficients of correlation. The analysis was carried out by the panel technique tool of the econometric software Gretl.
6.2.1. Relationship of inflation and budgetary categories
Let us first see the relationship between inflation and budgetary categories. The relations between inflation and revenue-to-GDP and expenditure-to-GDP were analysed by using the Fixed-effect model. We have used the analysis robust (HAC) standard errors.
Pubrev = 42,2 + 0,26 * infl (1)
Pubexp = 43,43 + 0,187 * infl (2)
The results obtained seem controversial as the relationship was expected to be negative according to our anticipations. We should remember however that while the coefficient of correlation was the result of a two variable linear regression analysis, the panel technique considers how data from given countries are connected and it considers the time attribute of the data. The linear analysis although assumes no relation between different pairs of values.
According to the models (1) and (2), inflation determines government expenditure in 89.4 per cent and the revenue in 94.5 per cent. If inflation grows by 1 percentage point, the government expenditure increases by 0.187 percentage point in general and revenue by 0.26 percentage point. Thus, if inflation rate increases, the growth of the expenditure is higher than that of the revenue, and the budgetary situation should worsen; however the analysis of the public balance did not show relation with inflation rate. The reason for it can be that the coefficients of the revenue and expenditure differ only slightly. Since the balance is defined as the difference between revenue and expenditure, the two very similar effects neutralise each other. Another analysis of the mean values showed logarithmical relationship between inflation and public balance. Therefore further analyses were carried out, unfortunately without sufficient results showing any relation between ln (1 + infl/100) and balance.
After all these analyses it can be stated that neither inflation rate nor its logarithmic value correlate public balance. Thus, conclusions on the budgetary situation can be drawn neither
from the rate of inflation nor its change.6.2.2. Factors determining public balance
Let us see which are those variables that determine public balance, if inflation does not determine it. The analysis covered the data of 29 countries (EU27, Iceland and Norway) between the years 1999 and 2007. As they were panel data, the Random effects model proved to be the best compared to the Pooled OLS estimation.
publicbal = - 4,26 – 0,17 * unemp + 0,38 * realgrowth +0,058 * labprod – 0,048 * debt
The indicator of the correlation between explanatory variables (Variance Inflation Factors)
showed low values: unemp: 1.493, realgrowth: 1.413, labprod: 1.676, debt: 1.450. Thus the
parameters can be explained as multicollinearity of the variables was small. If unemployment
rate increases by 1 percentage point, public balance worsens by 0.1 percentage point. If GDP
growth increases by 1 percentage point, public balance improves by 0.38 percentage point in
general. If labour productivity improves by 1 percentage point, the balance increases by 0.058
percentage point, and if government debt increases by 1 percentage point the balance worsens
by 0.048 percentage point in general – assuming no changes in the rest of the variables at the
same time. Linear coefficient of correlation shows that inflation indirectly has effect on the
public balance through these variables, even if it was not possible to prove the direct impact
of inflation.
7. Conclusions
In this study we analyse the relationship between state of development, inflation rate and budgetary status. The relevant literature usually discusses the relationship between inflation rate and public balance by examining whether worsening public balance causes inflation and if so, how it does. However, these two factors interact, thus, we examined the impact of inflation on public balance.
We first assessed the development status of the European countries, then we focused on the relationship between inflation and budgetary categories. It was found that the more developed a country is, the higher is its revenue-to-GDP ratio; therefore the better situation the budget is, the lower the inflation is in the country.
Inflation rate influences both government expenditure and revenue. The question is how great this impact is on these items and what is the share of these items within the whole. The analysis of expenditures and revenues proved that inflation has impact on them, however the rate of their impacts eliminates each other, and thus inflation has no effect on the public balance. We can only assume an indirect effect of inflation on the budgetary situation in the analysis.
In subsequent work we will consider what phase of the conjuncture cycle the analysed countries are in; the impact of the years of parliamentary elections; the difference between the share of superannuation within the expenditure across countries; and the ratio of the elderly people within the population or the activity rate. As further factors, the impact of taxation can be also considered; this has an impact on the balance of payment on current account as well.
Including all these factors in the analysis may result in a better picture about the relationship
between public balance and inflation.
8. References
CATAO, LUIS – TERRONES, MARCO E. (2003): Fiscal deficits and inflation. IMF Working Paper. WP/03/65, April 2003, International Monetary Fund.
ERDŐS, TIBOR (1991): Az inflációról az elméletben és a gyakorlatban. Magyar Tudomány, XXXVI. évfolyam, (6. szám) pp. 691-701.
ERDŐS, TIBOR (1997): Dezinfláció, seigniorage és az állami költségvetés egyenlege.
Közgazdasági Szemle, XLIV. évfolyam, (december) pp. 1021-1046.
ERDŐS, TIBOR (1998): Infláció. Akadémiai Kiadó, Budapest.
ERDŐS, TIBOR (1999): Az infláció és néhány közgazdasági kategória kapcsolata.
Közgazdasági Szemle, XLVI. évfolyam, (július-augusztus) pp. 629-656.
HAJDU, OTTÓ (2003): Többváltozós statisztikai számítások. Központi Statisztikai Hivatal, Budapest.
KÁRMÁN, ANDRÁS (2008): A magyar költségvetés kiadási szerkezete nemzetközi összehasonlításban. Hitelintézeti Szemle, Hetedik évfolyam 6. szám, 665-677.o.
SOMOGYI, PATRÍCIA (2006): Olaszország inflációjának regionális elemzése (2000-2004),
Acta Scientiarum Socialium, Tomus XXI.-XXII./2006. Kaposvár, pp. 129-148.
9. Appendix
Correlation matrix
GDP per
capita Public debt Public
balance Total
revenue Total
expenditure Inflation rate
GDP per capita 1
Public debt 0,025 1
Public balance 0,526 -0,319 1
Total revenue 0,455 0,335 0,509 1
Total expenditure 0,226 0,575 -0,046 0,843 1
Inflation rate -0,462 -0,052 -0,401 -0,463 -0,429 1