Self-organized Ion Beam Pattern Formation on Si(0 0 1)
I n a u g u r a l - D i s s e r a t i o n zur Erlangung des Doktorgrades
der Mathematisch-Naturwissenschaftlichen Fakultät der Universität zu Köln
vorgelegt von
Martin Engler
aus Bergisch Gladbach
Berichterstatter: Prof. Dr. Thomas Michely
Prof. Dr. Stephan Schlemmer
Tag der mündlichen Prüfung: 14. 10. 2014
Kurzzusammenfassung
Mit in-situ Rastertunnelmikroskopie, niedereneegetischer Elektronenbeugung, sowie ex- situ Rasterkraftmikroskopie, Rasterelektronenmikroskopie, Transmissionselektronenmi- kroskopie und Rutherford-Rückstreu-Spektrometrie wurde die selbstorganisierte Ionen- strahl-Musterbildung von Si(0 0 1) durch Beschuss mit2keV Kr+ Ionen untersucht.
Bekannterweise können Metallverunreinigung die Musterbilderung verusachen. Dazu wurde untersucht, wie die Ko-Deposition von Pd, Ir, Fe, Ag und Pb die Ionenstrahl- Musterbildung beeinflussen. Bei den hier untersuchten Bedingungen ist es nötig, dass die Metalle Silizide bilden können, um Musterbildung zu verursachen. Dies allein reicht jedoch nicht aus. Die Stoßkinetik ist nicht enscheidend dafür, ob ein Metall Musterbil- dung verursacht, wie sich durch den Vergleich von Metallen mit ähnlicher Atommasse und Kernladungszahl zeigt. Um die Beobachtungen zu erklären, muss man berücksichti- gen, dass die Oberflächenmorphologie und deren chemische Zusammensetzung eng mit einander verknüpft sind und sich gegenseitig beeinflussen. Durch diese gegenseitige Be- einflussung hängt die mittlere Metallkonzentration empfindlich von der Geschichte der Musterbildung ab und ist daher kein geeignetes Maß, um das entstehende Muster zu charakterisieren.
Bei Beschuss mit 2keV Kr+ Ionen unter Einfallswinkeln im Bereich zwischen 58° und 79° bilden sich bei Raumtemperatur auch ohne Verunreinigungen Muster. Die Entwick- lung der Muster wurde mit in-situ Rastertunnelmikroskopie bei den Einfallswinkeln 63°
und 75° untersucht. Dabei wurde jeweils die Ionenfluenz um den Faktor 1000 verändert.
Für beide Winkel lassen sich zwei Fluenzbereiche unterscheiden. Während sich für nied- riege Fluenzen bei beiden Einfallswinkel ähnliche Wellenmuster mit einem Wellenvektor senkrecht zum auf die Oberfläche projizierten Ionenstrahl bilden, ist bei hohen Fluen- zen die Entwicklung und die entstehende Morpholgie qualitativ unterschiedlich. Für 63°
bilden sich Wellen senkrecht zu den ursprünglichen Wellen, während sich für 75° eine Dachschindel-artige Oberflächenmorpholgie ausbildet. Der Vergleich der Ergebnisse mit experimentellen Daten über Ionstrahl-Musterbildung auf Si- und Ge-Oberflächen aus der Literatur erlaubt es universelle Phänomene zu indentifizieren. Die Anwendbarkeit bestehender theoretische Modelle auf die Musterbildung bei den hier untersuchten Be- dingungen wird bewertet.
Unterhalb einer kritischen Temperatur amorphisiert Si(0 0 1) bei Ionenbeschuss, wäh- rend es oberhalb dieser Temperatur kristallin bleibt. Für2keV Kr+ liegt die Temperatur bei (674±10)K. In einem engen Temperaturbereich über dieser Temperatur bis 720K entwickelt sich eine Morphologie aus Gruben und Hügeln, deren Stufenkanten parallel zu
Kurzzusammenfassung
den ⟨1 1 0⟩ Richtungen sind. Durch die Ehrlich-Schwoebel-Barriere an den Stufenkanten wird während des Ionenbeschusses ein destabilisierender Diffusionstrom induziert. Bei
≈ 0K ist die Aufrauhung durch diesen Strom am stärksten. Deshalb wurde bei dieser Temperatur die Fluenzabhängigkeit der Oberflächenmorphologie untersucht. Bei hohen Fluenzen ändert sich die Morphologie und es bilden sich Täler und Bergrücken, die≈45°
gegen die ⟨1 1 0⟩ Richtungen verdreht sind.
iv
Abstract
Self-organized ion beam pattern formation of Si(0 0 1) by 2keV Kr+ ion bombardment was investigated in-situ with scanning tunnelling microscopy, and low energy electron diffraction and ex-situ with atomic force microscopy, scanning electron microscopy, trans- mission electron microscopy, and Rutherford backscattering spectrometry.
It is known that metal impurities can induce pattern formation. The effect of co- depositing Pd, Ir, Fe, Ag, and Pb on ion beam pattern formation was analyzed. For the condition analyzed here, the ability of the metal to form a silicide is necessary for inducing pattern formation. However this is not sufficient. Comparing the effects of metals with similar nuclear charge and mass, but with different ability to form silicides, shows that collision kinetics are not decisive for pattern formation. To understand the observed phenomena one has to consider that the morphology and the composition of the surface are bidirectionally coupled. Due to this coupling the metal concentration depends on the surface history and it does not determine the resulting morphology.
For ion incidence angles from 58° to 79° patterns develop on Si during 2keV Kr+ ion bombardment at room temperature even without co-deposition of impurities. The evolu- tion of the surface morphology was studied using in-situ scanning tunnelling microscopy for the ion incidence angles63° and75°. The fluence was varied by a factor of 1000. Two fluence regimes can be distiguished. While a similar ripple pattern evolves in the low fluence regime for both incidence angles, the evolution differs for both incidence angles in the high fluence regime. In the high fluence regime perpendicular mode ripples and a roof-tile morphology develop for 63° and 75° respectively. The observations will be compared to experimental data of ion beam patterning of Si and Ge from literature to identify universal phenomena. Comparing the results with theoretical models allows to asses their applicability to ion beam pattern formation of Si.
Si(0 0 1) amorphizes under ion bombardment below a critical temperature and is crys- talline above the critical temperature. For 2keV Kr+ ions the critical temperature is (674±10)K. In a limited temperature range of 674K to 720K the surface develops a pit and mound morphology with the step edges parallel to the ⟨1 1 0⟩ directions. The pattern formation is driven by the Ehrlich-Schwoebel barrier inducing an effective uphill diffusion current. The surface roughness is maximum atT ≈700K. At this temperature the fluence dependence of the surface morphology was studied. For high fluences the pattern changes into a ridge and valley morphology where the directions of the ridges and valley is≈45° rotated to the⟨1 1 0⟩directions.
Contents
Kurzzusammenfassung iii
Abstract v
List of Figures ix
List of Tables xiii
1. Introduction 1
2. Scientific background 3
2.1. Ion bombardment of solids . . . . 3
2.2. Spinodal decomposition . . . . 6
2.3. Ion beam pattern formation of amorphous elemental semiconductors . . . 7
2.4. Pattern formation on crystalline surfaces . . . . 14
2.5. Metal induced pattern formation . . . . 16
2.6. Si(0 0 1) . . . . 18
3. Methods 21 3.1. UHV systemAthene . . . . 21
3.2. Calibration of the movable thermocouple . . . . 21
3.3. Sample preparation . . . . 22
3.4. Methods of sample analysis . . . . 25
3.5. Image analysis . . . . 29
3.6. Kinetic Monte Carlo simulations with TRIM.SP . . . . 33
4. Silicide induced patterns 35 4.1. Ag co-deposition . . . . 35
4.2. Pd co-deposition . . . . 39
4.3. Pb co-deposition . . . . 44
4.4. Ir co-deposition . . . . 46
4.5. Fe co-deposition . . . . 48
4.6. Discussion . . . . 52
Contents
5. Pattern formation without impurities 63
5.1. Angle dependence near the transition from a flat surface to ripples . . . . 63 5.2. Pattern evolution at 63° incidence angle . . . . 64 5.3. Pattern evolution at 75° incidence angle . . . . 68 5.4. Discussion . . . . 71
6. Pattern formation on crystalline Si(001) 81
6.1. Temperature dependence . . . . 81 6.2. Fluence dependence . . . . 86 6.3. Discussion . . . . 89
7. Summary 93
8. Outlook 95
A. Numerical modelling of sputter co-deposition fluxes 97
Bibliography 99
Acknowledgements 113
Publications 115
Erklärung 117
Curriculum Vitae 119
viii
List of Figures
2.1. Collision of an ion with a stationary target atom. . . . 3
2.2. (a)Fe-Si phase diagram, (b) sketch of plausible free energy curve . . . . 6
2.3. STM topographs at (a)ϑ = 55°, (b)ϑ = 63°, (c) ϑ= 75°, (d) ϑ= 81° . . 8
2.4. Dependence of surface roughness on incidence angle. . . . 8
2.5. Sputtering yield of Si as function of the local incidence angle . . . . 9
2.6. Definition of slope angleα, (global) incidence angleϑ, and local incidence angle θ. . . . 9
2.7. Sketch to illustrate coarsening by reflected ions. . . . 13
2.8. Sketch of angles relevant for the discussion of the Hauffe mechanism (see text). . . . 13
2.9. Si(0 0 1) surface. . . . 19
3.1. Calibration of the movable thermocouple. . . . 22
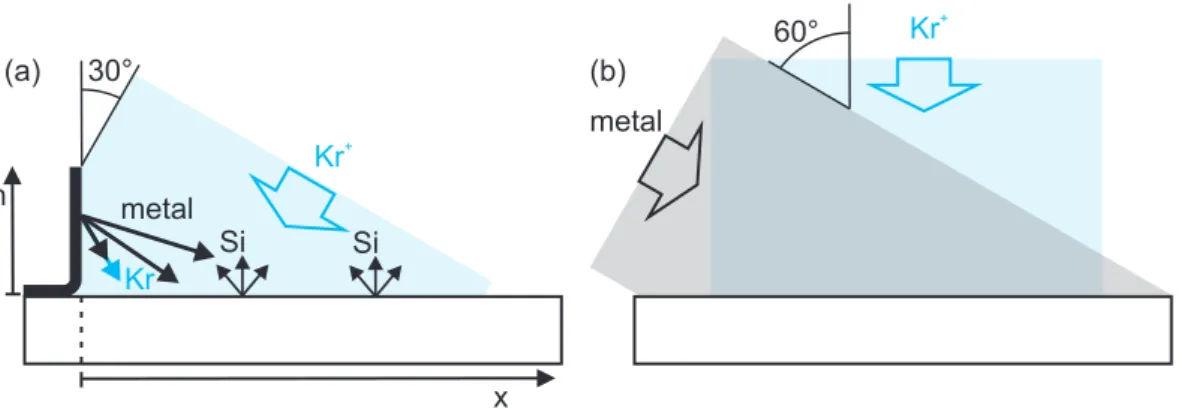
3.2. (a) Sputter co-deposition setup, (b) co-evaporation setup. . . . 23
3.3. Sketch of force-distance curve for AFM . . . . 27
3.4. Sketch of an AFM setup . . . . 27
3.5. Rutherford backscattering spectrometry (RBS) geometry . . . . 28
3.6. Determination of slope distributions . . . . 31
3.7. separation into long and short wavelength components . . . . 32
3.8. Sobel filter . . . . 33
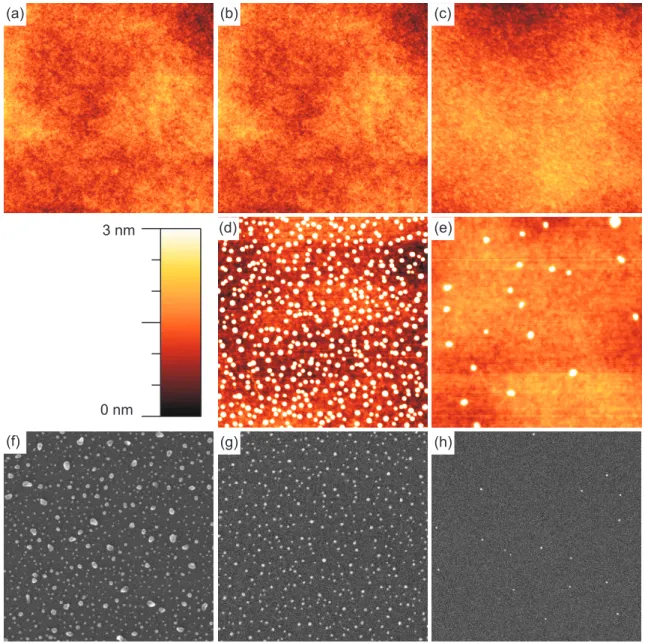
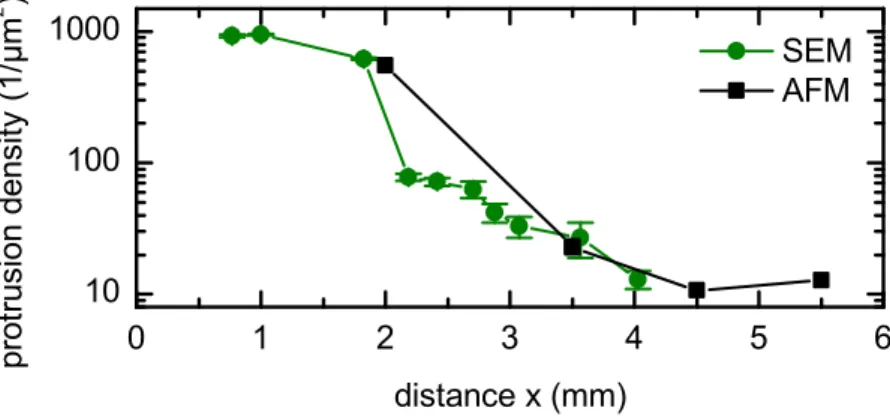
4.1. Ag sputter co-deposition: in-situ STM, ex-situ AFM, ex-situ SEM images 36 4.2. Ag sputter co-deposition: protrusion density . . . . 37
4.3. Ag sputter co-deposition: roughness . . . . 37
4.4. Ag sputter co-deposition: SE and ESB SEM images . . . . 38
4.5. Sketch of the Ag cluster formation . . . . 38
4.6. Pd sputter co-deposition: STM images . . . . 40
4.7. Pd sputter co-depostion: roughness, wavelength, Pd surface density . . . 41
4.8. Pd co-evaporation: STM images . . . . 42
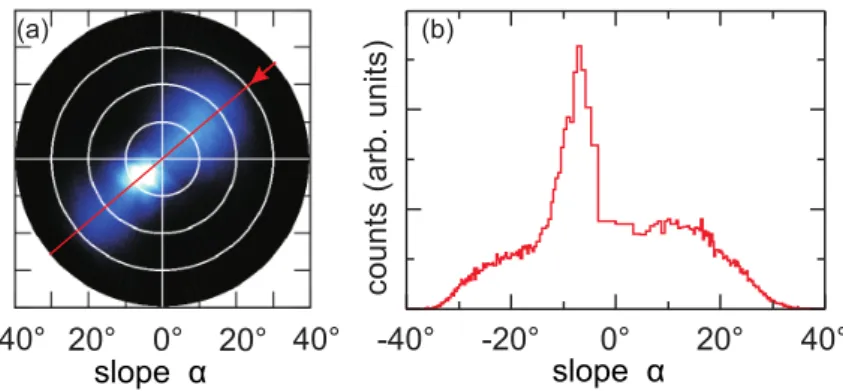
4.9. Slope angle distribution after Pd co-evaporation with ΦPd/ΦKr = 0.8. . . 43
4.10. Pd co-evaporation: cross-sectional TEM . . . . 45
4.11. In-situ STM topographs after Pb sputter co-deposition . . . . 46
4.12. Ex-situ SEM image of Pd sputter co-deposition sample . . . . 46
4.13. In-situ STM topographs after Ir sputter co-deposition . . . . 47
List of Figures
4.14. Ex-situ AFM images of the Ir sputter co-deposition sample . . . . 47 4.15. Roughnessσ and wavelengthλ for Ir sputter co-deposition. . . . 48 4.16. Roughnessσ, wavelengthλ, Fe concentrationcFe, and Fe area densitynFe
of Fe sputter co-deposition experiment . . . . 49 4.17. STM topographs and autocorrelation for Fe co-evaporation experiments 50 4.18. Dependence of pattern formation on angleαbetween ion beam and Fe flux. 51 4.19. Metals inducing pattern formation . . . . 52 4.20. Sketch of the assumed evolution of nFe during co-evaporation . . . . 56 5.1. Transition from flat surface to ripple patterns . . . . 63 5.2. Dependence of (a) roughnessσ, (b) wavelength λ, and (c) disorder δλ/λ
on incidence angle ϑ near transition from flat to ripple surface. . . . 64 5.3. Evolution of topography at ϑ= 63° . . . . 65 5.4. Slope distribution atϑ = 63° . . . . 65 5.5. Evolution of the roughnessσ, the short wavelength roughness component
σs, and the long wavelength roughness component σl as a function of ion fluenceF for ϑ= 63°. . . . 66 5.6. Evolution of (a) roughness σ, (b) wavelength λ, (c) pattern order δλ/λ,
and (d) local ion incidence angles . . . . 67 5.7. Evolution of topography at ϑ= 75° . . . . 69 5.8. Slope distribution ϑ= 75° . . . . 69 5.9. SEM image after2keV Kr+bombardment atϑ= 75° withF = 3.0×10²²ions/m2
. . . . 70 5.10. Local incidence angle on downwind faceθd and upwind faceθuas function
of global incidence angleϑ. . . . . 75 5.11. Roughness σ as a function of ion fluence F for ion exposure of Si(001)
under various ion beam conditions. . . . 76 5.12. Evolution of (a) roughness σ and (b) wavelength λ of ion beam induced
patterns on Si and Ge (Teichmann et al. [131]) as function of fluence. . . 78 6.1. Overview of temperature dependence with old thermocouple . . . . 82 6.2. Overview of temperature dependence with new thermocouple . . . . 83 6.3. Dependence of (a) roughness and (b) structure width on sample temper-
ature . . . . 84 6.4. Distribution of slope angles of series with old thermocouple (figure 6.1) . 85 6.5. Distribution of slope angles of series with new thermocouple (figure 6.2) 85 6.6. LEED patterns after annealing of ion beam amorphized Si(0 0 1) . . . . . 85 6.7. Fluence dependence atT = (704±10)K . . . . 87 6.8. Dependence of (a) roughnes σ and (b) structure width λ on fluence at
T = (704±10)K. . . . 88 6.9. Distribution of slope angles as function of the fluence at T = (704±10)K. 88
x
List of Figures
6.10. Sketch of the pattern rotation for the case of two touching pyramids . . . 90 A.1. Sketch of sputter co-deposition . . . . 97 A.2. Differential Pd sputtering yielddYPd/dΩ and ion reflectivitydYR/dΩ . . 98 A.3. Relative Pd fluxΦPd/Φprimary Kr(a) and secondary Kr+fluxΦreflected Kr/Φprimary Kr
(b) as function of the distance to the targetx. . . . 98
List of Tables
4.1. Densities n, total sputtering yields Y, partial Si sputtering yields YSi, partial metal (M=Pd,Fe,Ir,C) sputtering yields YM, total erosion rates ρ=Y /n, partial Si erosion ratesρSi =YSi/n calculated with TRIM.SP. . 53 5.1. Regimes of morphological evolution atϑ= 63° . . . . 72 5.2. Regimes of morphological evolution atϑ= 75° . . . . 72
1. Introduction
Self-organized ion beam pattern formation is a simple method for producing regular patterns with nano- to micrometer periodicity. The ease of pattern production enables many possible applications, e. g. anti-reflective coatings [47, 49], or nano-scale patterned magnetic films [78, 145, 146]. Navez, Sella, and Chaperot [100] reported already in 1962 the formation of ripples on glass after bombarding it with ionized air at 4keV energy.
Self-organized ion beam pattern formation has been reported in the following for many different systems: 1. metal surfaces [58, 59, 67, 92, 94, 129], 2. glas surfaces [2, 47, 69, 100, 137], 3. compound semiconductors [36, 46, 51], and 4. elemental semiconductors which amorphize under ion bombardment at room temperature [3, 20, 21, 68, 77, 86, 131, 144]. Depending on the system and ion bombardment conditions used many different surface morphologies can be achieved like ordered ripple or dot patterns, faceted roof-tile morphologies, pit and mound morphologies, cones, pillars, wall structures, sponge like structures.
Initially ion beam pattern formation was modeled taking into account the dependence of erosion on the local incidence angle [19, 102]. Bradley and Harper [14] derived the dependence of erosion on the local curvature from the Sigmund model of sputtering [126].
They combined the curvature dependence of erosion with relaxation by surface diffusion to explain the development of regular ripple patterns. Later attention was drawn to material transport at the surface as source of an instability leading to pattern formation [20, 22, 105, 106]. In systems with more than one atomic species also the evolution of the surface composition and chemical effect have to be considered [9, 10, 13, 15, 104, 123, 124].
These continuum models are suited to describe evolution of amorphous or amorphized substrates as these surfaces are locally isotropic. On crystalline substrates additional effects arise due to the anisotropic nature of crystalline surface. Surface diffusion depends on the direction with respect to the crystallographic directions [4]. Step edges introduce an additional barrier for diffusion of adatoms and vacancies [28, 43, 122], leading to an effective uphill diffusion bias [75, 125, 136].
Silicon is an ideal substrate material for studying ion beam pattern formation. It can be produced in high purity and with extremely low surface roughness. As Si amorphizes quickly under ion bombardment at room temperature, continuum modeling can be ap- plied to the pattern evolution. Recently, it was found that early experiments yielding pattern formation for near normal incidence angles were influenced by metal impurities unintentionally deposited during ion bombardment [81, 108]. Clean experiments, which avoid the deposition of impurities, showed that for large range of incidence angles from
1. Introduction
normal incidence to50°–60° to the surface normal the surface remains flat, depending on ion energy and species [81, 84, 85]. For larger incidence angles three angular ranges with qualitatively different surface morphologies have been identified: 1. a range with ripples with the wave vector parallel to the ion beam direction 2. a range with roof tile morphol- ogy at larger incidence angles, and 3. at grazing incidence grooves in direction of the ion beam [81]. This initiated further experimental [62–64, 80, 82, 109, 147] and theoretical [9, 10, 12, 13, 104, 124] effort to understand the mechanisms of pattern formation with concurrent deposition of metal impurities, as this is a promising procedure to produce well ordered patterns. The type of pattern produced with metal co-deposition can be tuned by the metal and the metal flux used [62, 80, 81]. To explain the metal induced pattern formation two different approaches have been proposed: chemically driven phase separation [62, 104], and a geometrical instability [9, 80].
Although ion beam pattern formation is known for more than five decades, the mecha- nisms of ion beam pattern formation are still not fully understood. This thesis contributes to the effort to better understand ion beam pattern formation. Three aspects of ion beam pattern formation on Si(0 0 1)will be addressed in this thesis.
In chapter 4 ion beam pattern formation with metal co-deposition will be discussed.
The question, how important silicide formation is for pattern formation, is investigated by comparing co-deposition of the silicide forming metals Pd and Ir with co-deposition of the non-silicide forming metals Ag and Pb. The dependence of pattern formation on the metal to ion flux ratio gives further insight into the mechanisms of pattern formation with metal co-deposition.
In chapter 5 the evolution of the pattern morphology during2keV Kr+ without metal co-deposition will be analyzed. The pattern evolution was studied in the ripple pattern range and the roof tile pattern range at the two incidence angles63° and75° respectively.
In chapter 6 the temperature dependence of the surface morphology will be analyzed.
At temperatures above 670K the surface remains crystalline during 2keV Kr+ ion bom- bardment and a pit and mound structure emerges. The evolution of the surface at700K will be analyzed.
2
2. Scientific background
2.1. Ion bombardment of solids
Ions impinging on a solid surface with a few keV kinetic energy loose their energy in a series of collisions with the target atoms. In the following the physics behind this will be reviewed briefly.
Elastic collisions
When an ion hits a solid surface it collides with the target atoms. Due to the short interaction time and the screening of the Coulomb interaction for ions with energies
>1keV this can be described in a good approximation as a binary collision between the resting target atom and the moving ion [99]. The energy transferredT =E−E′ from the ion to a target atom in an elastic binary collision is a function of the scattering angleθof the ion (see figure 2.1). In the laboratory system the energy transfer for non-relativistic velocities, i. e. for kinetic ion energies <10MeV, is given by
T = (1−K)E (2.1)
K = Mion2 (Mion+Mtarget)2
cosθ±
(Mtarget2
Mion2 −sin2θ
)1/2
2
. (2.2)
For Mion < Mtarget energy and momentum conservation allow only the plus sign. For Mion > Mtarget both signs are allowed and θmax = arcsin(Mtarget/Mion) is the maximum
b
θ
θ'
Figure 2.1.: Collision of an ion with a stationary target atom.
2. Scientific background
possible scattering angle [76, 91]. The target atom is scattered under the angle θ′ =−arctan
√K sinθ
√
1−K(1 + sin2θ)
. (2.3)
Further details, like the scattering cross-section and the dependence of the scattering angle on the impact parameterb, can only be obtained with knowledge of the interaction potential. The screening of the nuclear potential by the electrons has to be considered.
Usually a screened Coulomb potential V(r) = 1
4πϵ0
ZionZtargete2
r Φ
(r a
)
(2.4) is assumed with a screening functionΦ(r/a) and the screening length a [54].
Ion stopping
Energetic ions or atoms hitting a target will interact with the target in different ways depending on their energy and charge state. Highly charged ions, where the potential energy released during neutralization is significant and can lead to surface modifications, will not be discussed here. Ions are decelerated in the target by (a) elastic collisions with target atoms as discussed above (nuclear stopping), (b) exciting the electronic system of the target (electronic stopping), and (c) nuclear reactions. The activation barriers of nuclear reaction are in the order of several MeV. Thus nuclear reactions are not relevant for the energy used usually in ion bombardment experiments. The deceleration can be described by the energy loss per path length x or stopping power
dE
dx = dE dx
n
+ dE dx
e
(2.5) which is the sum of the nuclear (n) and electronic stopping (e). For small energies of a few keV considered in this work nuclear stopping is the dominant stopping mechanism and electronic stopping can be neglected [54].
Collision cascade and defect generation
For ions with a kinetic energy of a few keV, nuclear stopping is associated with producing a collision cascade near the surface. During a collision with a target atom the ion transfers a part of its kinetic energy to the target atom (see eq. (2.2)). If the transfered energy is larger than the displacement threshold energy ED the atom will be scattered away from its original site. This atom is called a primary knock-on atom. If the transfered energy is lower the atom stays at its original site and the energy will be dissipated by exciting lattice vibrations. After the collision the ion usually has enough energy
4
2.1. Ion bombardment of solids
to displace further atoms. When the ion has lost its kinetic energy, it is implanted into the target. If the primary knock-on atoms have enough energy they displace other atoms in secondary collisions. These secondary knock-on atoms can further displace atoms until their energy is dissipated. This sequence of collisions is called a collision cascade. Surface atoms receiving enough momentum in secondary collisions to overcome the surface binding energy are sputtered away from the surface. Otherwise they may form mobile ad-atoms which will soon be reincorporated into the surface. The average number of atoms sputtered away per incident ion is the sputtering yield Y [99]. The sputtering of surface atoms leads to the production of surface vacancies on crystalline surfaces.
For projectiles with low energies of the order of 1keV, the mean free path between two collisions is of the order of the interatomic distances. Then, the collision cascade becomes dense and after approximately1ps the energy distribution of the atoms can be described with the Maxwell-Boltzmann distribution [99]. The temperature reached in this thermal spikes is high enough to locally melt the target material. These thermal spikes are quenched in a few ps to the bulk temperature [103].
In metals the molten pockets recrystallize and only vacancies and interstitial atoms remain. In contrast in semiconductors, like Si and Ge, the molten pockets do not re- crystallize during the quenching of the thermal spike and amorphous pockets remain [103]. During ion bombardment the amorphous pockets from the impacts coalesce into an amorphous layer. Already fluences as low asF ≈3×10¹⁸ions/m2, which corresponds to≈0.4monolayer equivalents,1 amorphize Si(0 0 1)under2keV Kr+ bombardment [79].
At elevated sample temperature even semiconductors remain crystalline during ion bom- bardment [82, 107].
Ion beam mixing
On multi component targets the stochastic nature of the collision cascade leads to mix- ing of the components. If ions hit a surface composed of two target species A and B, the collision cascade will displace both species randomly with a probabilityρi(u) by dis- placement vector u. If the composition is inhomogeneous this leads to a mixing of both species. This mixing can be approximated by a sum of ballistic drift and diffusion [30]
∂tc|ballistic =−vdrift,i· ∇c+Dmix,i∇2c. (2.6) The drift velocity is given by
vdrift,i = ΦionNd,i
∫
uρi(u) d3u. (2.7)
1fluence divided by area density of atoms in one layer
2. Scientific background
Figure 2.2.: (a) Si rich part of Fe-Si phase diagram from ref. [114]. (b) Sketch of a plausible free energy curve for a homogeneous composition.
Usually the drift velocity is in direction of the ion beam. The diffusive part is described by the effective diffusivity of ion beam mixing
Dmix,i = ΦionNd,i 2
∫ |u|2ρi(u) d3u. (2.8)
The strength of ion beam mixing is proportional to the ion fluxΦion and the numberNd,i
of displaced atoms of species i [104].
2.2. Spinodal decomposition
Two-component systems often have thermodynamic stable phases with defined composi- tion in their phase diagrams. If the composition deviates from these stable phases the free energy is increased. As an example, the phase diagram of Fe and Si in the Si rich region is shown in figure 2.2(a) and a sketch of a plausible free energy curve is shown in figure 2.2(b). The free energy F of a homogeneous system with concentration c0 can be reduced by decomposing into regions with the stable concentrations. For a non ho- mogeneous system the concentration gradient costs free energy. According to Cahn and Hilliard [17], the free energy of the system can be obtained by integrating the free energy density f(c) of a homogeneous compound and the term κ(∇c)2 giving the free energy
6
2.3. Ion beam pattern formation of amorphous elemental semiconductors
cost of the concentration gradient F =
∫
V
f(c) +κ(∇c)2dV. (2.9)
Cahn [16] showed that the diffusion current for small concentration gradients is given by j =−M∇
(∂ f
∂c −2κ∇2c
)
(2.10) where M is the mobility. Inserting this current into the continuity equation yields the Cahn-Hillard equation
∂ c
∂t =−∇j =M∂2f
∂c2 ∇2c−2M κ∇4c (2.11)
The free energy density f(c) of a homogeneous system is propotional to the free energy of F(c) of a homogeneous system. Near the stable compositions the curvature ∂c2F of the free energy as function of the concentration is positive and phase separation happens by nucleation and growth of the nucleated clusters due to Fickian diffusion. For larger deviations from the stable compositions ∂c2F is negative. Then the diffusion current is in direction of the concentration gradient. This up-hill diffusion leads to spontaneous decomposition of the system as it is unstable against infinitesimal perturbations of the composition. This phase separation is called spinodal decomposition. Spinodal decom- position produces composition modulations with the wavelength
λ = 2π
√
− 2κ
∂2F/∂c2. (2.12)
2.3. Ion beam pattern formation of amorphous elemental semiconductors
Elemental semiconductor surfaces amorphize under ion beam irradiation at room tem- perature [79, 103]. This makes them ideal test cases for continuum models of ion beam pattern formation as the properties of the surface are isotropic and effects like step edge barriers [43, 122] can be ignored.
For a given ion species, energy, and substrate combination a sequence of patterns can be observed with increasing incidence angle2 ϑ. Figure 2.4 shows the dependence of the surface roughnessσ as a function of the incidence angleϑfor2keV Kr+ on Si(0 0 1). For incidence anglesϑfrom normal incidence up to a critical angleϑcthe surface remainsflat [81, 84, 131]. Light ions do not induce pattern formation [131]. The patterns reported
2The incidence angleϑis the angle between ion beam and global sample normal
2. Scientific background
(b) (c) (d)
(a)
Kr+
Figure 2.3.: 1µm×1µm STM topographs at (a)ϑ= 55° (z-scale 2nm), (b)ϑ= 63° (z-scale 5nm), (c) ϑ= 75° (z-scale 45nm), and (d) ϑ= 81° (z-scale 2.5nm). (a) and (d) are from ref. [79].
0 ° 1 0 ° 2 0 ° 3 0 ° 4 0 ° 5 0 ° 6 0 ° 7 0 ° 8 0 ° 9 0 ° 0
2 4 6 8
( d ) ( c ) ( b )
roughness (nm)
i n c i d e n c e a n g l e
( a )
Figure 2.4.: Dependence of surface roughness on incidence angle for 2keV Kr+ on Si(0 0 1) with a fluence F = 1×10²²ions/m2. The vertical lines indicate the borders of the angular ranges. ■: new data (see chapter 5),□□□: data from reference [79]
earlier for normal or near normal incidence low energy ion bombardment [85, 86, 151, 152] have been shown to be caused by simultaneous impurity co-deposition [31, 32, 81, 108, 109] or ions scattered at the sample holder [84]. For incidence angles larger than the critical angle ϑc a ripple pattern with a wave vector k parallel to the projection of the ion beam (projected ion beam) on the sample plane evolves. The critical angle is in the range from 50° to 65° depending on the ion–target combination for low energy ion bombardment [21, 79, 81, 84, 131]. With further increasing ϑ there is an angular range where the surface transforms into aroof-tile structure for sufficiently high fluences [79, 81, 131, 144]. For grazing incidence angles ϑ > 80° the surface develops grooves in the direction of the ion beam, i. e. the wave vector is perpendicular to the projected ion beam [81, 84, 131]. In this range the surface roughness is of the same magnitude as the initial roughness [81, 131]. For 2keV Kr+ ion bombardment with the fluence F = 1×10²¹ions/m2 the angular ranges are (a) flat surfaces for ϑ ≤ 55°, (b) ripple patterns for 58° ≤ ϑ ≤ 63°, (c) roof-tile patterns for 67° ≤ ϑ ≤ 79°, and (d) at grazing incidence ϑ ≥ 81° a flat surface with faint grooves in ion beam direction (compare ref. [79] figure 4.2 and [81] figure 1). Characteristic morphologies after the ion fluence F = 1×10²²ions/m2 are shown in figure 2.3 Figure 2.4 shows the dependence of the
8
2.3. Ion beam pattern formation of amorphous elemental semiconductors
0 1 2 3 4 5 6 7
θmax
0° 30° 60° 90°
sputteringyieldY
local incidence angleθ
Figure 2.5.: Sputtering yield of Si bombarded with 2keV Kr+ ions as function of the local incidence angleθ calculated with TRIM.SP.
ions θ ϑ α
Figure 2.6.: Definition of slope angleα, (global) incidence angle ϑ, and local incidence angle θ.
surface roughness σ on the ion incidence angle ϑ.
The fluence dependence of low energy ion beam patterning has been investigated for different ion species, energies, and incidence angles on Si [3, 21, 71, 86, 144] and Ge [131].
In the following, theoretical models for ion beam pattern formation of amorphous or amorphized elemental semiconductors will be discussed. In the coordinate system used the unperturbed surface is parallel to the x-y plane and the ion beam is parallel to the x-z plane.
Slope dependence of erosion
The sputtering yield Y(θ) (figure 2.5) depends on the local incidence angle θ (see fig- ure 2.6).
The dependence of the sputtering yield on the local ion incidence angle θ leads to a dependence of the erosion rate on the local slope angleα. The height change due to the slope dependence of the sputtering yield is
∂th|slope =−jY(θ) cosθ
cosα (2.13)
which can be approximated for small slopes by
∂th|slope ≈ −jY(ϑ) cosϑ+j(∂θY(ϑ) cosϑ−Y(ϑ) sinϑ)∂xh. (2.14)
2. Scientific background
Carter, Colligon, and Nobes [19] showed that the local incidence anglesθ = 0°, θmax,90°
are the only local incidence angles on a steady state surface if one take only the slope dependence of the sputtering yield into account.
Curvature dependent erosion
Bradley and Harper proposed a model for ion beam pattern formation combining the curvature dependence of the sputtering yield as the roughening mechanism and surface diffusion as the smoothening mechanism [14]. The curvature dependence of the sputtering is derived by assuming the number of sputtered atoms being proportional to the energy deposited there by neighboring impacts and the distribution of the deposited energy being ellipsoidal as in the model of Sigmund [126]. For small slopes and amplitudes the height evolution is given by
∂th|BH=SxBH(ϑ)∂x2h+SyBH(ϑ)∂y2h−D∇4h, (2.15) where the coefficientsSxBH(ϑ), SyBH(ϑ)include the dependence of the curvature dependent sputtering on the incidence angleϑ andDthe relaxation by surface diffusion. IfSxBH<0 or SyBH < 0 there is an instability for height modulations with wave vectors in x or y direction, respectively. Wether the direction of the wave vector of the ripple pattern is parallel or perpendicular to the projection of the ion beam onto the sample plane depends on the relative strength ofSxBHand SyBH. If −SxBH>−SyBH the wave vector is parallel to the projected ion beam direction and perpendicular if−SyBH >−SxBH. For all incidence angles ϑ < ϑcrit the surface is unstable in x direction in this model, i. e. SxBH < 0; for larger ϑ the surface is stable in x direction, i. e. SxBH > 0, while the surface is always unstable inydirection, i. e. SyBH<0for allϑ, the instability inxdirection is stronger for ϑ < ϑcrit. A rotation of the ripple direction from a wave vector parallel to the projected ion beam for small incidence angles to a wave vector perpendicular to the ion beam for large incidence angles is predicted.
Surface relaxation
In the original model of Bradley and Harper [14] thermal Herring-Mullins type diffusion is the smoothing mechanism behind D∇4h. Depending on the actual conditions other mechanisms contribute to the smoothing: (1) Herring–Mullins type diffusion [14, 26, 61, 97, 98], (2) radiation enhanced viscous flow in the thin amorphous top layer of the surface [135], and (3) dependence of the erosion rate on higher derivatives of the surface height (“effective surface diffusion”) [87]. The relaxation mechanisms (1) and (2) are connected with mass transport along the surface. The driving force is the reduction of
10
2.3. Ion beam pattern formation of amorphous elemental semiconductors
the surface free energy. The surface currents of diffusion are given by jS =−DSnSV γ
kBT ∇κ, (2.16)
where κ is the surface curvature, nS is the density of the mobile species which can be drastically above the equilibrium density by ion beam induced defects, V the atomic volume, γ is the surface tension, andDS ∝exp(−ED/(kBT)) with the activation energy ED of surface diffusion [61, 97, 98]. For low temperatures the surface diffusivity is dominated by radiation enhanced diffusion and for higher temperatures the thermal diffusion becomes important The height change is then in the linear limit (κ≈ −∇2h)
∂th=−V∇ ·jS =−D∇4h, (2.17)
where the relaxation constant D is the sum of all contributions. The change in surface height due to radiation enhanced viscous flow is given by
∂th=−γd3
η ∇4h=−DVF∇4h (2.18)
in the shallow water approximation d≪λ [135]. The “effective surface diffusion” (3) is not connected with any mass transport. It originates from the dependence of the erosion rate on higher derivatives of the surface height [87].
Ballistic mass drift
Ions hitting a solid surface do not only sputter atoms but also displace atoms in the near surface layer. The momentum transfered from the impinging ion to the recoil atoms leads to a net mass drift in direction of the ion beam. Carter and Vishnyakov [20] derived an approximation for the ballistic surface atom flux
jCV=jcos(θ)Nd(E)drecsin(θ) (2.19)
where j is the ion flux density3, θ=ϑ−arcsin(∂h/∂x) the local incidence angle, Nd(E) the number of recoils generated by an ion impact, and drec is the average distance the recoils travel in direction of the ion beam. In linear approximation, this leads to a change in the surface height of
∂th|CV=SxCV∂x2h=−j
nNd(E)dreccos(2ϑ)∂x2h (2.20) which is smoothing forϑ <45° and destabilizing forϑ >45°. This model predicts ripples with wave vector parallel to the ion beam direction for ϑ >45°.
3ions per unit time and area
2. Scientific background
Crater functions
An approach to unify the contributions from erosion like the curvature dependent erosion rate and the ballistic mass drift in one theory is to use crater functions ∆h(x, y) which describe the average height change due to an ion impact. Norris et al. [105, 106] derived the height change due to ion impacts
∂th|CF =SxCF(ϑ)∂x2h+SyCF(ϑ)∂y2h (2.21) where SxCF(ϑ), SyCF(ϑ) depend on the first moment Mx(1)(ϑ) =∫∫ ∆h(x, y)x dx dy of the crater functions
SxCF(ϑ) =j d dϑ
[
Mx(1)(ϑ) cosϑ] SyCF(ϑ) =jMx(1)(ϑ) cosϑcotϑ
(2.22)
Hydrodynamic model
Combining the ideas of roughening by ballistic mass drift and relaxation by ion induced viscous flow leads to the idea of describing the surface evolution as a highly viscous incompressible fluid film of thicknessd [22]:
∇ ·v = 0, (2.23)
where v is the velocity field. The conservation of momentum can be expressed by the Stokes equation
0 =∇ ·T=−∇P +η∇2v+∇ ·Ts (2.24)
with
Tij =−P δij +η
(∂vj
∂xi + ∂vi
∂xj
)
+Tijs. (2.25)
The hydrostatic pressure P, the visous stress η(∂v∂xj
i + ∂x∂vi
j
) and the ion beam induced stressTS contribute to the stress tensorT. The ion beam induced stress can be described by an “effective body force”b=∇ ·Ts pointing into the direction of the ion beam. The magnitude of the body force |b| = fEΨ(θ) depends on the local incidence angle θ of the ions. By solving the Stokes equation taking into account the surface tension γ at the surface and a no-slip condition at the interface between the amorphous layer and the crystalline substrate, Castro and Cuerno [22] showed that a small height modulation h(x, t = 0) = hkexp(ikx) grows/diminishes exponentially in the linear approximation
12
![Figure 2.2.: (a) Si rich part of Fe-Si phase diagram from ref. [114]. (b) Sketch of a plausible free energy curve for a homogeneous composition.](https://thumb-eu.123doks.com/thumbv2/1library_info/3699154.1505937/20.892.192.685.160.487/figure-phase-diagram-sketch-plausible-energy-homogeneous-composition.webp)