of S-layer proteins from the bacterial isolates Lysinibacillus sphaericus JG-B53 and Lysinibacillus sphaericus JG-A12
Dissertation
zur
Erlangung des akademischen Grades doctor rerum naturalium
der Mathematisch-Naturwissenschaftlichen Fakultät der Universität Rostock
vorgelegt von
Franziska Linda Lederer aus Weißig
geb. am 09.09.1983 in Stollberg (Erzgebirge)
Dresden, August 2012
Gutachter: Professor Dr. Hubert Bahl, Universität Rostock Professor Dr. Erika Kothe, Universität Jena
Wissenschaftliches Kolloquium: 21.01.2013
Teilergebnisse aus dieser Arbeit wurden in folgenden Beiträgen vorab veröffentlicht:
Publikationen
Lederer FL, Günther TJ, Flemming K, Raff J, Fahmy K, Springer A, Pollmann K. 2010.
Heterologous expression of the surface-layer-like protein SllB induces the formation of long filaments of Escherichia coli consisting of protein-stabilized outer membrane. Microbiology 156:3584-3595.
Lederer FL, Günther TJ, Raff J, Pollmann K. 2011. E. coli filament formation induced by heterologous S-layer expression. Bioeng Bugs 2(3):178-181.
Lederer FL, Günther TJ, Weinert U, Raff J, Pollmann K. 2012. Development of functionalised polyelectrolyte capsules using filamentous Escherichia coli cells. Microb Cell Fact 11:163.
Tagungsbeiträge
Lederer F, Günther T, Raff J, Pollmann K. 2010. Heterologous expression of a surface layer-like protein in E. coli causes a drastic morphological change of the cell. Vortrag auf der Jahrestagung der Vereinigung für Allgemeine und Angewandte Mikrobiologie (VAAM) in Hannover.
Lederer F, Günther T, Raff J, Pollmann K. 2010. Filamentous E. coli induced by heterologous expression of surface layer proteins. Poster auf der Gordon Research Konferenz Bacterial Cell Surfaces in New London, NH, USA
Lederer F, Günther T, Raff J, Pollmann K. 2011. Recombinant S-layer production induces disordered cell division in E. coli filaments. Poster auf der Jahrestagung der Vereinigung für Allgemeine und Angewandte Mikrobiologie (VAAM) in Karlsruhe.
Lederer F, Günther T, Raff J, Pollmann K. 2011. Recombinant S-layer production induces disordered cell division in E. coli filaments. Poster auf der Jahrestagung der Federation of European Microbiological Societies (FEMS) in Genf, Schweiz.
Lederer FL, Kutschke S, Pollmann K. 2012. Recombinant production of genetically modified S- layer proteins in different expression systems. Poster auf der Jahrestagung der Vereinigung für Allgemeine und Angewandte Mikrobiologie (VAAM) in Tübingen.
Patente
Pollmann K, Lederer F, Raff J. 2011. P0904 - E. coli-Sekretionssystem auf der Basis von S-Layer- Proteinen. DE102009032645B3 - 17.03.2011; EP 22700033 A1 - 05.01.2011
Pollmann K, Raff J, Lederer F. 2011. P0903 - Mikroröhren, umfassend Bestandteile der äußeren Membran von E. coli Zellen und rekombinant exprimierte S-Layer-Proteine, Verfahren zu ihrer Herstellung und Verwendung. DE102009032645B3 - 17.03.2011; EP 22700033 A1 - 05.01.2011
Table of contents
Liste der Vorabveröffentlichungen
Abbreviations ... iv
1 Introduction ... 1
1.1 Survival of microorganisms in heavy metal polluted environments ... 1
1.2 Surface layer proteins – the outer cell envelope ... 3
1.3 Heterologous protein expression in Escherichia coli ... 7
1.4 Material design based on polyelectrolytes using biocomponents as template ... 9
1.5 Aims of the thesis... 10
2 Materials and Methods ... 12
2.1 Organisms, mutants and vectors ... 12
2.2 Cultivation of microorganisms ... 13
2.2.1 Cultivation of Escherichia coli cells ... 13
2.2.2 Cultivation of Bacillus strains ... 13
2.3 Standard methods for nucleic acid treatment ... 13
2.3.1 Nucleic acid analytic methods ... 13
2.3.1.1 Photometric quantitation of concentration and purity of nucleic acids ... 13
2.3.1.2 Agarose gel electrophoresis for quantitation of concentration and purity of nucleic acids ... 14
2.3.2 Isolation and purification of nucleic acids ... 14
2.3.2.1 Isolation of genomic DNA of Bacillus sp. JG-B53 and Lysinibacillus sphaericus JG-A12... 14
2.3.2.2 Isolation of total RNA of Bacillus sp. JG-B53 ... 15
2.3.2.3 Plasmid mini preparation of E. coli ... 15
2.3.2.4 DNA purification by Ethanol-Acetate precipitation ... 16
2.3.3 Enzymatic modification of DNA ... 16
2.3.3.1 Cleavage with restriction enzymes ... 16
2.3.3.2 Dephosphorylation of DNA fragments (Sambrook et al., 1989) ... 16
2.3.3.3 Ligation of DNA fragments ... 17
2.3.4 Reverse transcription of total RNA... 17
2.3.5 Amplification and analyses of DNA fragments ... 18
2.3.5.1 In vitro amplification of DNA fragments by Polymerase chain reaction
(PCR) ... 18
2.3.5.2 Purification of PCR products ... 19
2.3.5.3 Sequencing of DNA ... 20
2.3.5.4 Ethanol Acetate precipitation of sequencing products ... 20
2.4 Genome sequencing and bioinformatics ... 21
2.4.1 Sequencing of whole bacterial genomes ... 21
2.4.2 Bioinformatic analyses of whole genome sequences ... 21
2.5 Cloning of DNA ... 22
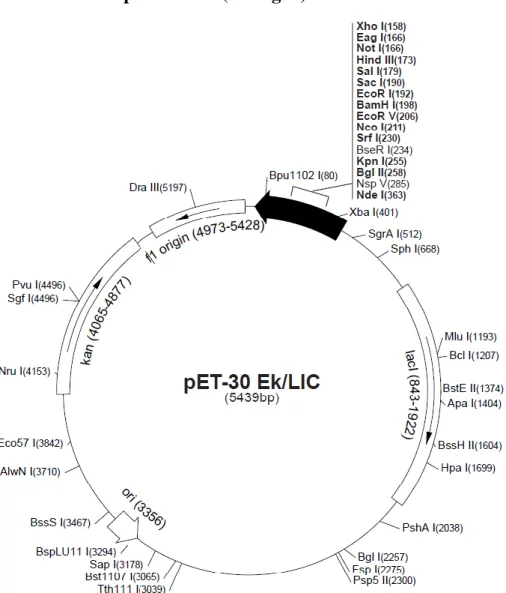
2.5.1 The Ek/LIC vector system ... 22
2.5.2 T4-DNA-polymerase treatment of PCR products... 23
2.5.3 Ligation of pET-30 Ek/LIC vector and insert ... 23
2.5.4 Production of CaCl2 competent E. coli cells ... 23
2.5.5 Transformation of cloning products ... 24
2.5.6 Colony screening ... 24
2.5.7 Long term storage of bacteria ... 25
2.6 Expression of recombinant proteins... 25
2.6.1 Heterologous expression of S-layer variants ... 25
2.6.2 Isolation of cell components ... 26
2.6.2.1 Purification of native S-layer proteins ... 26
2.6.2.2 Preparation of cell protein fractions ... 26
2.6.2.3 Preparation of cell membranes ... 27
2.6.2.4 Preparation of cell enclosing tubes ... 28
2.6.2.5 Total lipid extraction of tubes ... 28
2.6.3 Protein analysis methods... 29
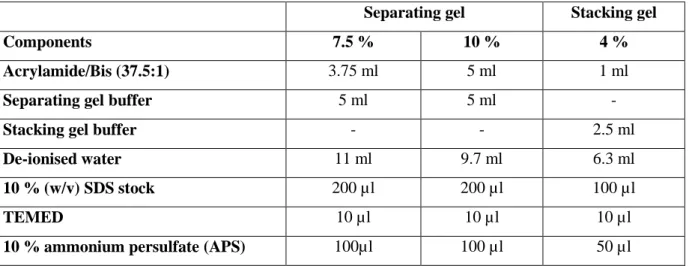
2.6.3.1 SDS-PAGE (Laemmli, 1970) mod. ... 29
2.6.3.2 Quantitation of proteins with Bradford assay ... 30
2.6.3.3 Quantitation of proteins with SYPRO Ruby ... 30
2.6.3.4 N-terminal sequencing of proteins ... 31
2.6.3.5 Detection of proteins with immune assay ... 31
2.6.3.6 ß-galactosidase assay ... 32
2.7 Staining methods of filamentous E. coli cells ... 33
2.7.1 Live/Dead stain ... 33
2.7.2 Staining of DNA by DAPI ... 33
2.7.3 Staining of membranes ... 34
2.8 Microscopic and spectroscopic methods ... 34
2.8.1 Light and Fluorescence microscopy ... 34
2.8.2 Atomic force microscopy ... 34
2.8.3 Transmission electron microscopy ... 35
2.8.4 Scanning electron microscopy and Energy dispersive X-ray spectroscopy 35 2.8.5 IR-spectroscopy ... 35
2.9 Development of applications for filamentous E. coli ... 36
2.9.1 Preparation of polyelectrolyte capsules ... 36
2.9.2 Linking of fluorescence dye to S-layer proteins ... 37
2.9.3 Coating of polyelectrolyte capsules with surface layer proteins ... 37
2.9.4 Synthesis of Pd(0) nanoparticles ... 37
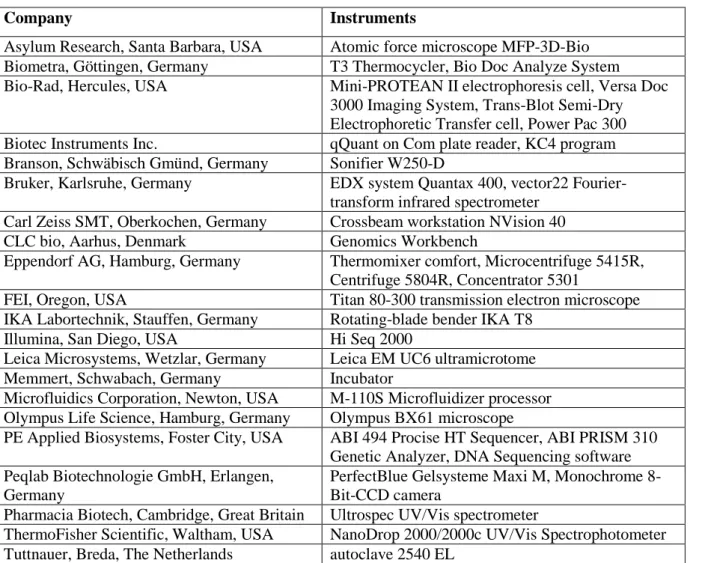
2.10 Sources of supply ... 38
3 Experiments, Results and Discussion ... 40
3.1 Identification of multiple putative S-layer genes partly expressed by Lysinibacillus sphaericus JG-B53 ... 40
3.2 Heterologous expression of the surface-layer-like protein SllB induces the formation of long filaments of Escherichia coli consisting of protein- stabilized outer membrane ... 41
3.3 E. coli filament formation induced by heterologous S-layer expression ... 42
3.4 Development of functionalised polyelectrolyte capsules using filamentous Escherichia coli cells ... 43
4 Conclusion ... 44
5 References ... 46
6 Attachments ... 53
Danksagung...………..75
Selbständigkeitserklärung ………...76
Abbreviations
A. Aquaspirillum N amino terminus
A Adenine, Attachment NB Nutrient broth
aa Amino acids NGS Next Generation Sequencing
AFM Atomic force microscopy Nt nucleotide
APS Ammonium persulfate NTD N-terminal domain
B. Bacillus OD Optical density
BDT Big Dye Terminator OM Outer membrane
bp Base pairs OMV Outer membrane vesicle
BSA Bovine serum albumine ONPG o-nitrophenyl-ß-D- galactopyranoside C Cytosine, carboxy terminus,
cytoplasm
ORF Open reading frame
CD Central domain P Pellet, periplasm
cDNA complementary DNA PAGE Polyacrylamide gelelectrophoresis
CTD C-terminal domain PAH Poly(allyamine hydrochloride)
cyt cytosol PBS Phosphate buffered saline
D Dimensional, Discussion PCR Polymerase chain reaction
Da Dalton PE polyelectrolyte
DAPI 4’,6-diamidino-2-phenylindole PEI Poly(ethylenimine) dATP Deoxyadenosin triphosphate PF
reads
purified filtered sequence reads
DEPC diethylpyrocarbonate PG Peptidoglycan
DNA Deoxyribonucleic acid pI Isoelectric point
dNTP Deoxyribonucleoside triphosphate pos position
ds double strand Pp Periplasm
DTT dithiothreitol PSS sodium poly (styrenesulfonate)
E Experiments and Results PVDF Polyvinylidene fluoride
E. Escherichia R reverse
EDC 1-Ethyl-3-(3-
dimethylaminopropyl)carbodiimid
RNA Ribonucleic acid
EDX Energy dispersive X-ray RCA Radio corporation of america
spectroscopy
fts Filamenting temperature sensitive rpm rotation per minute
F forward S supernatant
G Guanine s second
g gravitation SAP Shrimp alkaline phosphatase
GFP Green fluorescent protein SCWP Secondary cell wall polymer
h hour SEM Scanning electron microscopy
HBSS Hank’s buffered salt solution SDS Sodium dodecyl sulfate HGT Horizontal gene transfer S-layer Surface layer
I Introduction SLH S-layer homologous
IgG Immunoglobulin G SllB S-layer like protein B
IM Inner membrane SP Signal peptide
IPTG Isopropyl-ß-D-
thiogalactopyranoside
sp species
IR Infrared SRP Signal recognition protein
JG Johanngeorgenstadt T Thymine, time
L. Lysinibacillus TAT Twin-arginine transport
L Ladder TBE Tris-borate-EDTA
LB Luria Bertani TBS Tris buffered saline
LDF Linear discriminant function TE Tris-EDTA
LIC Ligation independent cloning TEM Transmission electron microscopy
LPS Lipopolysaccaride TEMED Tetramethylethylendiamine
M Marker, molar, Materials and Methods
Tris tris(hydroxymethyl)aminomethane
Mbp Million bases pairs trunc. truncated
MCS Multiple cloning site u unit
MES 2-(N-morpholino)ethanesulfonic acid
v/v volume per volume
min minute Vol. volume
mRNA messenger RNA w/v mass per volume
MW Molecular weight wh whole
Abbreviations for amino acids
A Ala Alanine M Met Methionine
C Cys Cysteine N Asn Asparagine
D Asp Asparatic acid P Pro Proline
E Glu Glutamic acid Q Gln Glutamine
F Phe Phenylalanine R Arg Arginine
G Gly Glycine S Ser Serine
H His Histidine T Thr Threonine
I Ile Isoleucine V Val Valine
K Lys Lysine W Trp Tryptophan
L Leu Leucine Y Tyr Tyrosine
1 Introduction
1.1 Survival of microorganisms in heavy metal polluted environments
The largest environmental sources of heavy metals are probably volcanic emissions, forest fires, deep-sea vents, and geysers (Janssen et al., 2010). Another source of heavy metals that affect the environment is mining with its following processing steps. The uranium mining in eastern Germany, which started in the beginning of the 19th century, produced up to 3000 waste piles and 20 tailings that were contaminated with heavy metals. The area of 168 km2 is classified as more or less contaminated (Beleites, 1992). Radionuclides were mobilised as result of mining and processing activity. Their mobility is influenced by the interaction with ions, minerals and microorganisms (Merroun, 2006). From the uranium mining waste pile Haberland that is located near Johanngeorgenstadt several soil samples were taken from the acidic sediment (pH 4.5) (Selenska-Pobell et al., 1999). Bacteria that were recovered from these samples were analysed regarding their interactions with uranium and other heavy metals (Merroun et al., 2005; Raff and Selenska-Pobell, 2003).
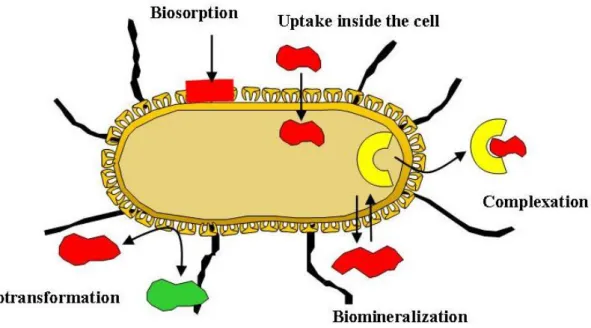
Generally, cell surface properties and diverse metabolic activities influence the interaction of bacteria with metal ions in their environment (Douglas and Beveridge, 1998). Bacteria, living in extreme environments, may interact efficiently with these inorganic contaminants (heavy metals) through different mechanisms such as intracellular accumulation (Merroun et al., 2003), precipitation (Jroundi et al., 2007; Nedelkova et al., 2007), or biosorption at the cell surface (Merroun et al., 2005) (Figure I1). Biosorption and biomineralisation are natural mechanisms that are widely used for bioremediation (Merroun et al., 2011). Biosorption is effected by the bioavailability of metal binding sites (Macaskie, 1990). In contrast, biomineralisation mechanisms are less limited and are regarded as a promising technology for metal removal from highly diluted solutions that takes place under aerobic conditions (Merroun et al., 2011). The metal immobilisation results from sorption of metal ions or complexes to cell components or exopolymers (Leung et al., 2001) or from precipitation as insoluble organic or inorganic compounds (Boswell et al., 2001; Renninger et al., 2001). On the other hand, bacterial mobilisation of radionuclides and metals is caused by autotrophic or heterotrophic leaching as well as chelation by microbial metabolites and siderophores, and methylation (Leung et al., 2001; Merroun et al., 2005).
Remediation of heavy metal polluted environments is essential to protect living organisms from their toxic influences. Usually remediation is a cost efficient process which may
generate subsequent secondary environmental pollutions. Therefore bioremediation of toxic metal contaminated sites by using bacteria is getting more and more attractive as an alternative technology because of its efficient, affordable and environmentally friendly advantages (He et al., 2011).
Figure I1. Schematic illustration of microbial interactions with radionuclides.
(Allocated by J. Raff)
The Gram positive bacteria that were isolated from the uranium mining waste pile Haberland were in most cases members of the order of Bacillales and assigned to the families Bacillaceae and Paenibacillaceae by 16S-analyses (Selenska-Pobell et al., 1999). Most of these isolated rod-shaped endospore producers’ possess surface layer (S-layer) proteins as outermost cell envelope. Generally, these S-layers were found to contribute to heavy metal tolerance of the cells. The strains Lysinibacillus sphaericus JG-A12 and Bacillus sp. JG-B53 that were investigated in the present work were assigned to the genus Bacillus. Members of the genus Bacillus are facultative anaerobic and in most cases saprophytic, using a range of naturally occurring substrates (Maiden et al., 1992).
Bacteria are able to respond quickly to changing environmental conditions. Horizontal gene transfer is a method that equips microorganisms with a multiplicity of genes that support the microbial survival and proliferation (Martinez et al., 2006). The genes were transferred with mobile genetic elements like plasmids, insertion sequences, phages, transposons and integrons between microorganisms (Canchaya et al., 2003; Frost et al., 2005; Mahillon and Chandler, 1998; Nemergut et al., 2004; Pearson et al., 1996). Genes encoding proteins for the
development of the cell envelope were the second most transferred genes. The bacterial cell envelopes belong to the most important cell attributes that interact directly with the environment and it is essential to equip cells with multiple cell surfaces genes that enable rapid response to changing environmental conditions (Nakamura et al., 2004). So, in some cases, different S-layer variants were found to be encoded by the same bacterial strain. These copies enable the organism to select between different versions, thus offering the possibility to react adequate to different stressors (Jakava-Viljanen et al., 2002; Kuen et al., 1997;
Mignot et al., 2001; Mignot et al., 2002). For example, increasing oxygen pressure causes the expression of another S-layer variant instead of the wild-type S-layer of Geobacillus stearothermophilus (formally Bacillus stearothermophilus) during controlled growth in a fermenter (Sára and Sleytr, 1994). One strategy to alter microbial surface properties is the programmed DNA-rearrangement which affects the variation of protein expression (Borst and Greaves, 1987). DNA rearrangements are induced by different mechanisms. Lactobacillus acidophilus ATCC 4356 for example exhibits two S-layer protein genes, the actively transcribed slpA gene and the silent slpB gene, which are located in a distance of 3 kb from each other at the chromosome in a reverse orientation relative to each other. Through inversion of a chromosomal segment the slpA gene is interchanged with the slpB gene. This chromosomal rearrangement results in the placement of the formerly silent gene behind the promoter (Boot et al., 1996a; Boot and Pouwels, 1996c). Coevally the regulation of the protein expression of different S-layer protein genes is an efficient method to deal with changing environmental conditions.
Up to now S-layer protein genes have been found within more than 539 species of all important taxa of bacteria and archaea and some species like Paenibacillus sp. JDR-2 encode more than 50 different S-layer proteins within their genome (NCBI database).
1.2 Surface layer proteins – the outer cell envelope
Surface layer proteins, so called S-layer proteins, are distributed in almost all phylogenetic branches of bacteria and archaea (Engelhardt and Peters, 1998). These proteins are one typical characteristic of nearly all archaea and many bacteria use S-layer proteins as additional cell envelope (Sleytr and Beveridge, 1999; Sleytr and Messner, 1988). These proteins are probably the basic and oldest form of bacterial cell envelope. Houwink discovered these protein structures while analysing Spirillum serpens using the electron microscope (Houwink, 1953). S-layer proteins are characterised by high stability and resistance to adverse conditions
like extreme pH, high temperatures, exogenous proteases, mechanical stress, attacks from phages and predation from foreign organisms (Engelhardt and Peters, 1998).
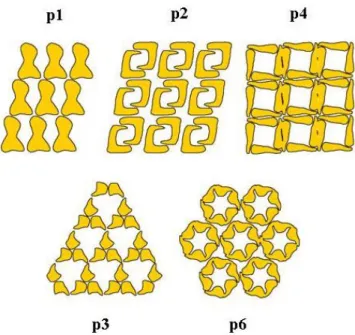
The monomolecular protein layer is a result of secretion and subsequent crystallisation of single protein molecules (Boot and Pouwels, 1996c) which are glycosylated or phosphorylated in some cases (Messner and Sleytr, 1992). The identical protein or glycoprotein subunits of S-layer proteins form two-dimensional paracrystalline structures which cover the whole cell within all stages of bacterial growth (Bahl et al., 1997; Pum and Sleytr, 1994; Pum et al., 1993; Sleytr and Sára, 1997). Purified S-layer proteins recrystallise to characteristic sheets and tubes in 2D structures (Sleytr and Messner, 1983; Sleytr et al., 1997a). The bacterial S-layer proteins form morphological units with centre-to-centre distances which vary between 2.5-35 nm. The lattice symmetry of S-layer proteins of archaea is often hexagonal (p3, p6), while bacteria seem to exhibit preferentially oblique (p1, p2) or tetragonal (p4) lattices (König, 1988; Messner and Sleytr, 1992; Sleytr et al., 1996) (Figure I2). S-layer protein lattices of bacteria contain pores of identical size between 2-8 nm and layer thicknesses between 5-25 nm (Sleytr et al., 2001).
Figure I2. Schematic illustration of possible S-layer lattice symmetries.
(Allocated by J. Raff)
S-layer proteins possess characteristic amino acid compositions with 10 mol% lysine, 8- 12 mol% threonine, 15 mol% glutamic acid and aspartic acid and 40-60 mol% hydrophobic amino acids (Engelhardt, 1988; Messner and Sleytr, 1992; Sára and Sleytr, 2000; Sleytr, 1997b). However, low content or absence of cysteine and methionine is characteristic for
bacterial S-layer proteins while S-layer proteins of archaea typically contain sulphur- containing amino acids (Akca et al., 2002; Claus et al., 2002). Therefore in case of archaea the S-layer protein subunits are supposed to be linked by covalent bonding (Beveridge and Graham, 1991; König, 1988). On the other hand, S-layer protein subunits of bacteria are linked by weak, non-covalent bonding forces like, e.g. salt-bridging, ionic bonding and hydrogen-bonding (Beveridge and Graham, 1991; König, 1988; Messner and Sleytr, 1992).
About 40 % of the S-layer amino acids are organised as ß-sheets and 10-20 % as α-helices (Claus et al., 2005). The S-layer envelope is characterised by an uncharged, in most cases plane outer face with variable structure and amino acid composition as well as by a negatively charged structured inner face with conserved amino acid composition (Engelhardt, 1988). S- layer proteins are weakly acidic in most cases, but some are basic like those of Methanothermus (pI = 8.4) and lactobacilli (pI > 9.5) (Sleytr, 1997b). The molecular mass of S-layer proteins ranges between 40-200 kDa (Sleytr, 1997b). Up to 15 % of the total proteins produced by the cells are S-layer proteins, thus being the major protein species in S-layer expressing organisms (Kuen et al., 1994). Posttranslational modifications like glycosylation, phosphorylation, sulphurylation, lipid transfer and proteolytic cleavage of N- and C-terminal fragments control sizes and molecular features of translated prokaryotic S-layer proteins (Boot and Pouwels, 1996c; Eichler, 2003). S-layer proteins are secreted by either conserved general pathway SEC or the ATP binding cassette transporter (Fernández and Berenguer, 2000; Kawai et al., 1998; Sára and Sleytr, 2000). Signal peptides which are essential for S- layer protein secretion are in average 30 aa in length and exhibit a positively charged N- terminus, a hydrophobic core and a C-terminal recognition site for cleavage specific signal peptidases (Bendtsen et al., 2004).
The linking between S-layer subunits of bacteria and the underlying cell envelope is generally effected by non-covalent bonds (Pavkov et al., 2008). The cell anchoring of S-layer proteins is mediated in many S-layer expressing organism by S-layer homologous (SLH) domains (Lemaire et al., 1995; Lupas et al., 1994). The SLH domain has a conserved sequence of about 55 aa and is located at the N terminus or C terminus of S-layer proteins and several cell envelope proteins (Engelhardt and Peters, 1998). Generally, SLH motif exhibiting S-layer proteins possess 1-3 SLH domains. The amino acid composition of SLH domains exhibit strong similarities to carbohydrate-binding proteins such as lectins (Jarosch et al., 2000). SLH domains bind not directly to the peptidoglycan but to wall-associated polymers (Ilk et al., 1999; Mesnage et al., 1999; Ries et al., 1997; Sára et al., 1996). Many S-layer expressing organism possess S-layer proteins with functional S-layer homologous domains that recognise
pyruvylated SCWPs (Cava et al., 2004; Mader et al., 2004; Mesnage et al., 2000) as proper anchoring structures (Brechtel and Bahl, 1999; Chauvaux et al., 1999; Huber et al., 2005; Ilk et al., 1999). As result of their location in the N-terminal part of S-layer proteins and in the C- terminal part of cell-associated exoproteins and enzymes of Gram positive and Gram negative bacteria SLH motifs were divided into three main groups with specific properties: I: S-layer proteins II: extracellular enzymes and protein involved in polysaccharide degradation, III:
outer membrane proteins including Omp α (Engelhardt and Peters, 1998). SLH domains were found in cell surface proteins of many Gram negative and Gram positive bacteria such as Bacillaceae, but not all S-layer proteins possess SLH domains (Archibald et al., 1993), such in the case of Geobacillus stearothermophilus (Claus et al., 2005). The binding mechanism between the S-layer proteins SbsC of Geobacillus stearothermophilus strain ATCC 12980 that possess no SLH domains and SCWPs occurs between a highly conserved positively charged N-terminal region of the S-layer protein and the negatively charged SCWPs (Pavkov et al., 2008; Schäffer et al., 1999).
The ubiquitous occurrence of S-layer proteins in the biosphere points to a broad spectrum of functions which are defined for S-layer proteins (Sára and Sleytr, 2000). Remarkable S-layer characteristics are their strong resistance to extreme environmental conditions such as high ionic strength, low pH and high temperatures (Claus et al., 2002; Engelhardt and Peters, 1998) suggesting that they contribute to the stabilisation and protection of the cells (Claus et al., 2005). In particular, archaea need the surface layer proteins as universal attribute for shape forming and stabilisation (Wildhaber and Baumeister, 1987). The occurrence of S-layer proteins in pathogenic organisms suggests their function as virulence factor (Blaser et al., 1987; Kay and Trust, 1991). The S-layer proteins of for instance Aeromonas salmonidica, Campylobacter fetus and Bacillus anthracis play a protective role against humoral and cellular immune defence and support the pathogenicity of these microorganisms (Etienne- Toumelin et al., 1995; Mesnage et al., 1997). However, Lactobacillus acidophilus strains which are essential for eupepsia exhibit S-layer proteins that mediate the adhesion to mammalian gut epithelial cells (Schneitz et al., 1993). Other S-layer proteins, for example of Geobacillus stearothermophilus, work as adhesion sites for cell-associated exoenzymes (Sára and Sleytr, 2000). Furthermore, S-layer work as molecular sieve, molecule and ion trap and have in particular the ability to bind selectively heavy metal ions. The uranium mining waste pile soil isolate Lysinibacillus sphaericus JG-A12 is able to selectively bind high amounts of uranium, thus protecting the inner of the cell from toxic uranium effects (Merroun et al., 2005; Raff, 2002).
S-layer lattices form with their strict modular construction the basis for many applications (Ilk et al., 2002; Schäffer and Messner, 2004; Sleytr et al., 1999; Sleytr et al., 2001). They can potentially be used as ultrafiltration membranes (Sára and Sleytr, 1987), drug microcontainers (Schuster et al., 2008), filter materials (Raff et al., 2003) or patterning structures in nanotechnology (Fahmy et al., 2006). These applications require an efficient, inexpensive and reproducible synthesis of S-layer proteins, ideally permitted by heterologous expression.
In the present work the strains Lysinibacillus sphaericus JG-A12 and Bacillus sp. JG-B53 were used. The uranium mining waste pile isolate Lysinibacillus sphaericus JG-A12 exhibits the S-layer protein SlfB, which covers the cells with subunits of square lattice symmetry (p4) and possesses a lattice constant of 12.5 nm (Raff, 2002). SlfB is composed of 1238 aa and possesses a molecular weight of 129.4 kDa and a theoretical isoelectric point of 5.23. SlfB is phosphorylated but not glycosylated and exhibits three N-terminal located SLH domains.
Cells of Lysinibacillus sphaericus JG-A12 are able to bind selectively and reversible high amounts of metals such as uranium, lead, copper, aluminium, gallium and cadmium.
However, the purified, recrystallised S-layer proteins of L. sphaericus bind high amounts of uranium in a strain-specific way (Pollmann et al., 2005; Raff, 2002).
Bacillus sp. JG-B53 is an isolate from the uranium mining waste pile Haberland which expresses an S-layer protein with square lattice symmetry and a predicted molecular weight, determined by SDS-PAGE, of 150 kDa. Similar to L. sphaericus JG-A12, Bacillus sp. JG- B53 cells bind selectively and reversible high amounts of heavy metals. In comparison to SlfB, the purification of Bacillus sp. JG-B53 S-layer proteins was found to be more efficient than the purification of SlfB and the purified B53 S-layer proteins exhibit excellent recrystallisation characteristics at multiple surfaces (personal communication with J. Raff).
1.3 Heterologous protein expression in Escherichia coli
The heterologous expression of bacterial surface layer (S-layer) proteins has failed in many cases (Boot et al., 1993; Bowditch et al., 1989; Kuen et al., 1995). The cost-efficient and large scale production of recombinant proteins is of great interest because of the high application potential of bacterial S-layers (Raff et al., 2003; Sára et al., 2005). The S-layer protein SbsA of the Geobacillus stearothermophilus has been successfully expressed in E. coli. Following expression, sheet-like intracellular structures have been monitored, indicating the self- assembly of recombinant S-layer proteins in the cytosol (Kuen et al., 1995). Expression of the S-layer protein SlfB of the Lysinibacillus sphaericus JG-A12 has also been successful
(Pollmann and Matys, 2007), but structural changes in S-layer proteins have been found after subsequent purification.
The silent plasmid-located S-layer protein gene sllB of Lysinibacillus sphaericus JG-A12 has been successfully expressed in E. coli BL21(DE3) (Lederer, 2008). E. coli BL21(DE3) growing at room temperature and expressing the silent S-layer protein gene variant exhibited morphological changes. Filamentous cell structures with dimensions of 1-2 µm x 50-100 µm were formed within the exponential growth phase and in reaching the stationary growth phase E. coli single cells started to leave former cell filament enclosing tube-like structures (Lederer, 2008).
Escherichia coli are bacteria which naturally colonise the colon of mammalians. These rod- shaped Gram negative peritrich flagellated enterobacteria have dimensions of 1.1-1.5 µm x 2.0-6.0 µm (Orskov, 1984) and are non-sporulating and facultative anaerobe. Under aerobic conditions E. coli generate energy with the help of the respiratory chain and mixed acid fermentation at anaerobic conditions. The optimal growth temperature is 37 °C, thus enabling a cleavage growth rate of 20 minutes when living conditions are in the optimum. E. coli is used amongst others as an indicator for contamination of water with excretes. Within the colon of mammalians Escherichia coli produce vitamin K2 and are pathogenic in some cases.
Escherichia coli are one of the scientifically best analysed organisms, working as tool in the molecular microbiology and biotechnology. The relatively small E. coli genome of 4.65 x 10⁶ base pairs was one of the first completely identified genomes at all.
E. coli B 834 is a genetically modified strain that is used in basic research as a model organism in the investigation of bacterial genetics, physiology and molecular biology. E. coli BL21(DE3), an E. coli strain derived from the B 834 strain, is widely used as host for heterologous expression of proteins of interest. However, misfolding of the expressed recombinant proteins frequently occurs in E. coli, causing the formation of inclusion bodies and often complicating their preparation. The Sec-dependent translocation in Escherichia coli is the favoured transport mechanism of large proteins, which finds application in the secretion of several recombinant proteins, too. However, the secretion capacity of the E. coli transport machinery is limited. The excess of expressed recombinant proteins favours their accumulation in inclusion bodies (Mergulhao et al., 2005; Mergulhao and Monteiro, 2004).
Filamentous forms similar to those monitored and investigated in the present work have been described only in a few studies and occur only under special culture conditions or in genetically modified strains (Koch et al., 1987; Painbeni et al., 1997; Parker et al., 1992;
Preusser, 1959). In particular in connection with temperature sensitive mutants the observation of filamentous Escherichia coli cells was described several times. Investigations with these mutants identified filamenting temperature sensitive (fts) genes that are essential components of the bacterial cell division machinery (Lutkenhaus and Addinall, 1997). So, several reports described the induced filament formation of E. coli cells by inhibition of genes that exhibit essential properties for cell division processes (Bi and Lutkenhaus, 1990;
Goehring and Beckwith, 2005; Jacobs and Shapiro, 1999; Lutkenhaus and Addinall, 1997;
Romberg and Levin, 2003). Additionally, the inhibition of chromosome separation is reported to interrupt cell division processes (Kaimer et al., 2008). The construction of the filaments described in this study and the underlying mechanisms of their formation have not been investigated yet and are part of the present work.
1.4 Material design based on polyelectrolytes using biocomponents as template
Filamentous Escherichia coli cells, which were developed by heterologous expression of the silent surface layer like protein gene sllB of the uranium mining was pile isolate Lysinibacillus sphaericus JG-A12, were discussed as interesting biotemplate, e.g. for the production of catalytic active composites or metal microwires.
The production of polyelectrolyte capsules using cells of different organisms such as erythrocytes, bacteria and spores as biotemplates has been described several times (Balkundi et al., 2009; Franz et al., 2010; Georgieva et al., 2004). The stepwise polyelectrolyte adsorption at different materials such as cells or polymer particles is a useful way to create polymer multilayer films with defined chemical and physical properties. Decher and co- workers proposed this technique originally for the combination of linear polycations and polyanions (Decher, 1997; Decher et al., 1992). The combination of multilayer systems with proteins was described later (Lvov et al., 1995). The starting material for this method is a solid substrate with a negatively charged planar surface. The formation of the first polyelectrolyte layer is started by addition and adsorption of cationic polyelectrolytes to the substrates. The adsorption is carried out at relatively high polyelectrolyte concentrations. A number of ionic groups remain exposed to the interface towards the solution that affects the effectively reserved surface charge. Substrate rinsing in pure water is followed by incubation of the substrate in an anionic polyelectrolyte solution. Multilayer assemblies are obtained by repeating these steps. Additionally, organic molecules and biocomponents such as proteins,
particles, biopolymers and surfactants can be incorporated in these films, thus realising a multifunctionalisation of these layers (Onda et al., 1996).
In the present study the design of biofunctionalised polyelectrolyte capsules by using filamentous E. coli as biotemplate for the assembly of polyelectrolytes was described. The tubes were coated with bacterial S-layer proteins. The polyelectrolyte tubes were used as template for the bio-inspired synthesis of palladium nanoparticles. Nanoparticles are very attractive for the development of new materials since their properties usually differ significantly from those of the bulk material. In particular, their physical behaviour can be drastically changed and the catalytic activity can be significantly enhanced due to the altered volume/surface ratio. The development of cluster-assembled materials with discrete, size- selected nanoparticles is of great interest to enable the fine-tuning of the properties of the nanoparticles. Especially the design of bio-nanohybrid materials by the combination of biomolecules with nanoparticles is an emerging topic at the border of Biology, Material Sciences, and Nanotechnology (Ruiz-Hitzky et al., 2008).
This work investigated the potential of the use of the S-layer induced filamentous cell structures for the construction of functional metallic wires that can be used for electronic devices or new catalysts. The possibility to combine such inorganic structures with biological functions opens up new perspectives for multifunctional hybrid materials.
1.5 Aims of the thesis
During a former diploma study the heterologous expression of the silent S-layer protein gene sllB of the uranium mining waste pile soil isolate Lysinibacillus sphaericus JG-A12 in Escherichia coli BL21(DE3) caused the formation of filamentous E. coli cells accompanied by extraordinary cell stability (Lederer, 2008). Aim of the diploma study was the comparison of SllB after cloning, expression and purification with the still heterologously expressed functional S-layer protein SlfB of L. sphaericus JG-A12 (Pollmann and Matys, 2007).
However, morphological modification of the expression strain E. coli BL21(DE3) were observed exclusive in SllB expressing E. coli cells (Lederer, 2008). The main goal of this study was to verify these results of the diploma study. The unusual cellular modification induced by heterologous expression of SllB should be analysed more detailed using different microscopic methods like AFM, TEM or light microscopy. In order to get more detailed information to the composition of the filamentous cells, they should be stained with cell component specific stains like membrane or DNA stain. The assumption, that the SllB S-layer
proteins are responsible for cellular modifications, should be verified by the coupling of S- layer protein genes with a GFP-fusion protein gene. In order to localise the recombinant proteins within the filamentous cells protein samples need to be taken and should be analysed using enzyme assays. The cell enclosing tubes should be analysed in order to localise the recombinant S-layer proteins and to identify the tube composition using different microscopic, spectroscopic and protein analytic methods. The mechanisms which might be responsible for the filamentous E. coli cells should be discussed in detail. The stable filamentous Escherichia coli cells and tubes seem to be quite interesting for diverse applications. The filamentous structures should be modified in order to prepare their usage for various applications. The design of filamentous polyelectrolyte tubes combined with native S- layer proteins and synthesised nanoparticles should be done to develop catalytic active filamentous structures. New designed structures should be analysed using different spectroscopic and microscopic methods like TEM, SEM and EDX.
The sequencing of several genomes of bacterial soil isolates which were taken from the uranium mining waste pile Haberland and the characterisation of S-layer protein genes within the genomes was a further aim of this study. The identified S-layer protein genes from Bacillus sp. JG-B53 should be analysed in order to characterise the genes and proteins regarding their potential for heterologous expression, their S-layer homologous domains, and analogies to other known S-layer proteins of different microorganisms. Microbial strategies that enable the bacterial survival in uranium contaminated environments should be analysed and discussed in relation to the genome data. The potential role of horizontal gene transfer for bacterial survival strategies by equipping bacteria with different gene variants should be discussed. For these analyses the genome data should be analysed with the bioinformatic program CLC bio Genomics Workbench, further gene and protein specific programs and finally verified with RNA specific methods.
2 Materials and Methods
2.1 Organisms, mutants and vectors
Table M1. Organisms.
Organism Medium Characteristic Origin
E. coli NovaBlue GigaSingles
LB, SOC Plasmid production strain. Genotype:
endAl hsdR17 (rK12-mK12+) supE44 thi-l recAl gyrA96 relAl lac [F’ pro
A+B+lacIqZ∆M15::Tn10(TcR)]
Novagen
E. coli BL21(DE3) LB, SOC Protein expression strain. Genotype:
F- ompT hsdSB (rB-mB-) gal dcm (DE3)
Novagen
Lysinibacillus sphaericus JG-A12
NB S-layer expressing environmental isolate Laboratory strain collection Bacillus sp. JG-B53 NB S-layer expressing environmental isolate Laboratory strain
collection
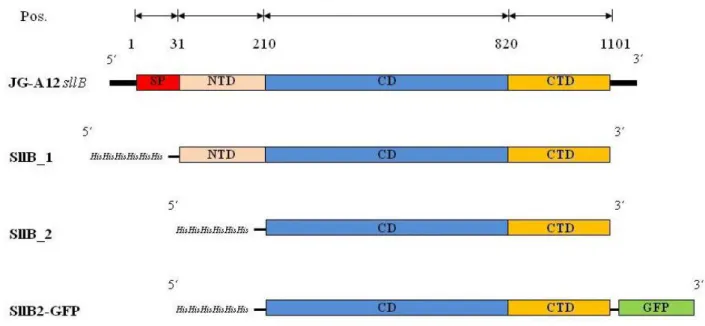
Table M2. Mutants.
Name Origin Vector Resistance Strain Insert size (bp)
Primer pair
Number
SllB_1 L. sphaericus JG-A12 sllB
pET30 Ek/LIC
Kanamycin E. coli BL21(DE3)
3210 Lic93f Lic_PlHis
KP31
SllB_2 L. sphaericus JG-A12 sllB
pET30 Ek/LIC
Kanamycin E. coli BL21(DE3)
2599 Lic704f Lic_PlHis
KP87a
SllB2- GFP
L. sphaericus JG-A12 sllB and pGFP
pET30 Ek/LIC
Kanamycin E. coli BL21(DE3)
3315 Lic704f Lic_Pl- GFP
KP115
pGFP pGFP pGFP Ampicillin E. coli BL21(DE3)
716 - KP72
Table M3. Vectors.
Vector Length (bp) Characteristics Origin Resistance gen
pET-30 Ek/LIC 5439 linear Novagen Kanamycin
pGFP 3344 coiled Clontech Ampicillin
2.2 Cultivation of microorganisms
2.2.1 Cultivation of Escherichia coli cells
Escherichia coli cells (Table M1) were routinely grown at 37 °C or room temperature in Luria Bertani (LB) medium containing 1 % (w/v) of Bacto tryptone, 0.5 % (w/v) of yeast extract and 1 % (w/v) of NaCl (pH 7.0). Escherichia coli mutant cells (Table M2) were grown in LB- medium supplemented with 35 µg ml-1 Kanamycin or with 100 µg ml-1 Ampicillin.
2.2.2 Cultivation of Bacillus strains
The Bacillus strains Lysinibacillus sphaericus JG-A12 and Bacillus sp. JG-B53 (Table M1), which were isolated from the uranium mining waste pile Haberland located near the town Johanngeorgenstadt, were routinely grown at 30 °C in nutrient broth (NB) medium containing 0.5 % (w/v) of Bacto peptone and 0.3 % (w/v) of meat extract (pH 7.0).
2.3 Standard methods for nucleic acid treatment
To avoid contaminations with bacteria and DNA restriction enzymes, all heat stabile solutions and materials were treated under high pressure saturated steam at 121 °C heat for 15- 20 minutes in the autoclave 2540 EL (Tuttnauer). Heat labile materials were treated with 70 % Ethanol for at least 20 minutes and dried afterwards. Solutions which were heat labile were sterile filtered with the syringe filter Filtropur S with a pore size of 0.2 µm (Sarstedt).
2.3.1 Nucleic acid analytic methods
2.3.1.1 Photometric quantitation of concentration and purity of nucleic acids
Concentration and purity of nucleic acids were determined with the NanoDrop 2000/2000c UV/Vis Spectrophotometer (Thermo Scientific). The nucleic acid concentrations were analysed by measuring the absorbance at a wavelength of 260 nm (OD260) in the Micro- Volume Pedestal. An OD260 value of 1 was defined as a concentration of 50 µg ml-1 of double-stranded DNA, while an OD260 value of 1 was defined as a concentration of 40 µg ml-1 of RNA (Sambrook et al., 1989).
A sample volume of 2 µl was analysed without dilution. The purity of nucleic acid samples was evaluated by determination of the ratio of the absorbance at 260 nm to the absorbance at 280 nm. Pure DNA shows a value of 1.8, while pure RNA shows a value of 2.0 (Sambrook et
al., 1989). In addition to photometric nucleic acid quantitations the samples were analysed by agarose gel electrophoresis (2.3.1.2).
2.3.1.2 Agarose gel electrophoresis for quantitation of concentration and purity of nucleic acids
The nucleic acid samples were analysed by agarose gel electrophoresis to control the results of the photometric measurements with the NanoDrop 2000/2000c (2.3.1.1). The horizontal agarose gel electrophoresis is used for the analytic and preparative separation of DNA and RNA fragments ranging from 50 base pairs/bases to several mega base pairs/bases to control quantity and quality of nucleic acid samples. Nucleic acid fragments with sizes between 1000- 4000 base pairs/bases were analysed in 1.2 % agarose gels. The gels were prepared with agarose (Invitrogen) and 0.5 % Tris-Borat-EDTA (TBE) buffer containing 44.5 mM Tris, 44.5 mM boric acid and 1 mM Na2-EDTA in a PerfectBlue Gelsysteme Maxi M (Peqlab).
The gel was loaded with 3 µl nucleic acid sample mixed with 0.3 µl Midori Green Direct (Biozym) which contains loading dye and staining solution. To control the size of nucleic acid fragments a DNA ladder was mixed with 0.5 µl Midori Green Direct. The electrophoresis worked at constant voltage of 130 V (PowerPac 300). The Midori-Green pre-stained nucleic acids were analysed with the Bio Doc Analyze System (Biometra).
2.3.2 Isolation and purification of nucleic acids
2.3.2.1 Isolation of genomic DNA of Bacillus sp. JG-B53 and Lysinibacillus sphaericus JG-A12
The DNA of Bacillus sp. JG-B53 and L. sphaericus JG-A12 was purified using the MasterPure Gram positive DNA Purification Kit (Epicentre). The purification started by harvesting 1 ml of an overnight Gram positive bacterial cell culture by centrifugation at 5,000 x g for 5 minutes. The cell pellet was solved in 150 µl TE buffer containing 10 mM Tris-HCl and 1 mM EDTA at pH 8.0. In order to pre-lyse the bacteria 1 µl Ready-Lyse Lysozyme was added to the cell sample and the mixture was incubated for 30 minutes at 37 °C. Lysozyme cleaves ß-1.4-glycosidic bonds between the alternating amino sugars N- acetylglucosamine and N-acetylmuramic acid of the peptidoglycan lattice of the Gram positive bacterial cell wall. Afterwards 150 µl of the Gram Positive Cell Lysis Solution supplemented with 1 µl Proteinase K (50 µg µl-1) was added to the sample, mixed thoroughly and incubated at 65 °C for 15 minutes at 600 rpm for total lysis of the cells digestion all proteins. The resulting sample product was placed on ice for 5 minutes. Protein precipitation
was started by the addition of 175 µl of MPC Protein Precipitation Reagent to 300 µl of the lysed sample. The sample was mixed for 10 seconds and the debris was collected by centrifugation at 4 °C at 12,000 x g for 10 minutes in the microcentrifuge 5415R (Eppendorf).
The supernatant, which contained the nucleic acids, was transferred to a sterile microcentrifuge tube, while the pellet containing the remaining cell debris was discarded. To remove RNA of the nucleic acid sample 1 µl RNase A (5 µg µl-1) was added to the sample, mixed thoroughly and incubated at 37 °C for 30 minutes. For precipitation of the genomic DNA 500 µl isopropanol was added to the recovered supernatant which was mixed with the sample by inverting the tubes 40 times. The precipitated DNA was collected by centrifugation at 4 °C at 12,000 x g for 10 minutes in the microcentrifuge. The remaining supernatant was removed and the DNA pellet was washed twice with 70 % ethanol. Finally the genomic DNA pellet was dried with the vacuum centrifuge Concentrator 5301 (Eppendorf) and solubilised in 25 µl ultra pure water (LiChrosolv, Merck Millipore).The quantitation of purity and concentration of the DNA was analysed with the NanoDrop 2000/2000c (2.3.1.1) and agarose gel electrophoresis (2.3.1.2).
2.3.2.2 Isolation of total RNA of Bacillus sp. JG-B53
Analyses with RNA need more intense treatments of solutions and materials to ensure RNase free working. All materials and surfaces were treated with RNase away solution (Roth), all solutions were prepared with 0.1 % DEPC (diethyl pyrocarbonate, Roth) water and all steps were performed on ice. Total RNA of Bacillus sp. JG-B53 was isolated from a bacterial culture in the mid-exponential growth phase. Ten millilitres of the bacterial suspension were harvested by centrifugation at 5,000 x g for 5 min. Afterwards the cell pellet was resuspended in 100 µl TE buffer containing 10 mM Tris-HCl and 1 mM EDTA at pH 8.0. After addition of 6 µl Lysozym (50 mg ml-1) the Gram positive bacteria were incubated at 30 °C for 30 minutes to pre-lyse the cells. Afterwards the total RNA-isolation was performed with the InnuPrep RNA Mini Kit (Analytic Jena). The isolated RNA was dissolved in 30 µl RNase free water and treated with DNase I (Biozym) to remove remaining DNA. The OD260 value was determined spectrophotometrically for the total RNA concentration and purity with the NanoDrop 2000/2000c UV/Vis Spectrophotometer (Thermo Scientific) (2.3.1.1). The total RNA purification was analysed additionally with agarose gel electrophoresis (2.3.1.2).
2.3.2.3 Plasmid mini preparation of E. coli
E. coli clones (Table M2) containing plasmids with the correct insert length were identified by colony screening (2.5.6). One colony of bacteria was used to spike 5 ml LB medium
supplemented with the appropriate antibiotic and was incubated at 37 °C at 250 rpm over night. The plasmid mini preparation of 2 ml of the overnight culture was performed with the Wizard® Plus SV Minipreps DNA purification system (Promega). The purified plasmid DNA was eluted from the cleaning column by the addition of 30 µl ultra pure water (LiChrosolv).
The purified plasmids were analysed with agarose gel electrophoresis (2.3.1.2), polymerase chain reaction (2.3.5.1), DNA sequencing (2.3.5.3) and were transformed to the protein expression strain E. coli BL21(DE3) (2.5.5).
2.3.2.4 DNA purification by Ethanol-Acetate precipitation
The DNA precipitation started with the addition of 0.1 vol. 3 M sodium acetate (pH 4.6) and 2.5 vol. 99.8 % ethanol to the DNA sample. The sample was inverted 4 times and afterwards incubated for 15 minutes in the dark. The high amounts of monovalent cat ions effect that the DNA molecules exceed their solubility product. The DNA was collected as a pellet by centrifugation at 4 °C and 12,000 x g for 20 minutes in the microcentrifuge 5415R (Eppendorf). The supernatant was removed and the pellet was washed with 3.5 vol. 70 % ethanol without destructing the DNA pellet. The sample was collected by centrifugation at 4 °C and 12,000 x g for 15 minutes, the supernatant was removed and the DNA pellet was dried with the vacuum centrifuge Concentrator 5301 (Eppendorf) and solubilised in 25 µl ultra pure water (LiChrosolv).
2.3.3 Enzymatic modification of DNA
2.3.3.1 Cleavage with restriction enzymes
Sequence specific cleavage of DNA with restriction enzymes created linear vectors with defined ends. The cleavage of plasmids and PCR products started by the combination of 10xFastDigest buffer, FastDigest enzymes (Fermentas), ultra pure water (LiChrosolv) and purified DNA product. The mix was incubated at 37 °C for 20 minutes to 6 hours and was stopped at 80 °C for 5 minutes. Cleaved plasmid DNA was treated with a dephosphorylation step to avoid self-ligation of the vector DNA (2.3.3.2).
2.3.3.2 Dephosphorylation of DNA fragments (Sambrook et al., 1989)
Linear vector DNA was dephosphorylated to avoid self-ligation of the DNA. Therefore the 5’-DNA ends were dephosphorylated by the direct addition of 3 U Shrimp Alkaline Phosphatase (SAP) (Boehringer) and SAP buffer to the cleaved DNA and incubated at 37 °C for 2 hours. The advantage of SAP is the possibility to inactivate its enzymatic activity
completely by the incubation at 65 °C for 15 minutes. The cleaved, dephosphorylated DNA product was purified by ethanol-acetate precipitation (2.3.2.4).
2.3.3.3 Ligation of DNA fragments
The ligation of cleaved purified PCR products and cleaved, dephosphorylated and purified plasmid DNA was performed using the T4-DNA Ligase (Fermentas). The ligation contained 50 ng linear plasmid and adequate amounts of insert in a ratio of 1:3 of vector and insert. The reaction mix was completed by the addition of 0.1 U T4-DNA ligase, 1 x T4-DNA ligase buffer and ultra pure water to a final volume of 20 µl. The ligation reaction was incubated at 16 °C over night, checked by agarose gel electrophoresis (2.3.1.2) and different amount of ligation products were transformed into competent E. coli cells (2.5.5).
2.3.4 Reverse transcription of total RNA
The reverse transcription of mRNA to cDNA was performed using the innuScript Reverse Transcriptase (Analytic Jena) and started by the combination of 3 µg RNA with 13 µl RNase free water and 1 µl reverse gene specific primer (100 ng µl-1). The used primer pairs that were designed specifically for the amplification of Bacillus sp. JG-B53 putative S-layer protein genes and the 16S primer pair, which was used in positive and negative PCR control reactions, are presented in table M6. Each sample was incubated at 65°C for 5 minutes followed by a 10 minutes lasting cooling step at room temperature to allow the primers annealing to the RNA. Afterwards 1x Reverse Transcriptase buffer, 1 mM dNTP mix and 1.25 U of Reverse Transcriptase (Analytic Jena) were combined with the RNA-primer mix and mixed gently. The samples were incubated for 5 minutes at 42 °C and another 55 minutes at primer specific temperatures (up to 55°C) using the T3 thermocycler (Biometra). The reactions were stopped at 70 °C for 15 minutes. The resulting cDNA samples were placed on ice until their usage in PCR reactions. The PCR amplifications were performed as described previously (2.3.5.1) using the primer pairs that are shown in table M6. As positive control cDNA was amplified with 16S primers while as negative control in order to check DNA contaminations RNA was used as template and incubated with 16S primers. As another positive control PCR was performed using S-layer specific primers and genomic Bacillus sp.
JG-B53 DNA as nucleic acid template (2.3.5.1).
2.3.5 Amplification and analyses of DNA fragments
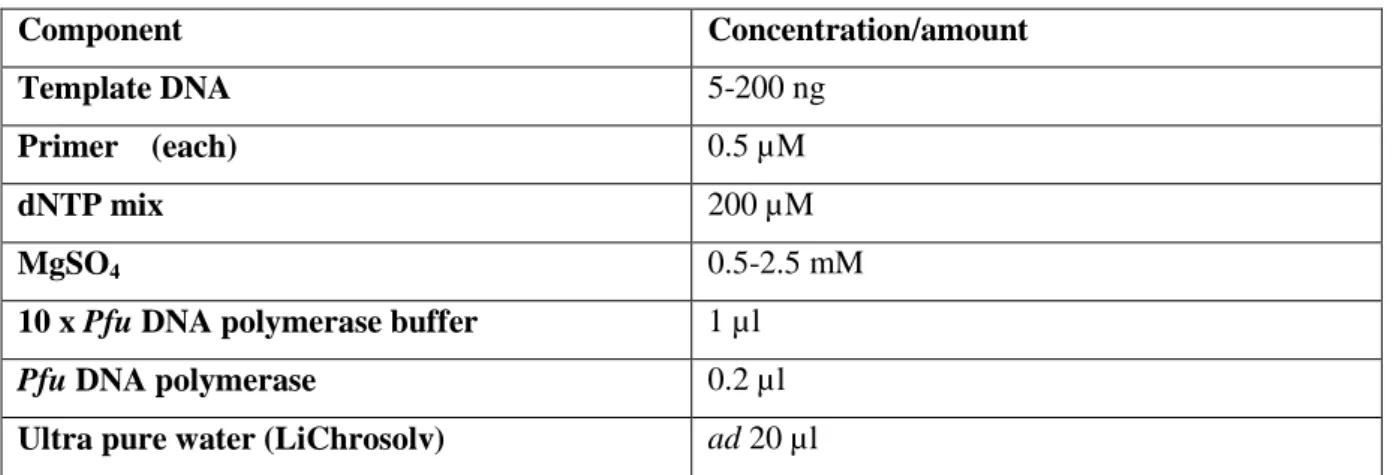
2.3.5.1 In vitro amplification of DNA fragments by Polymerase chain reaction (PCR) The selective amplification of DNA fragments was performed with the Pfu DNA polymerase (Fermentas) which was isolated from the hyperthermophilic archaeum Pyrococcus furiosus.
The enzyme catalyses the template-dependent polymerisation of nucleotides into double- stranded DNA in the 5’3’ direction and exhibits additional 3’5’ exonuclease activity that enables the polymerase to correct nucleotide incorporation errors. The resulting error rate of Pfu DNA polymerase is 2.6x10⁻⁶ (Fermentas). The PCR reaction mix was composed as described in table M4 and the used primers are listed in table M6. The polymerase chain reaction was performed in the T3 thermocycler (Biometra) with the program described in table M5. The amplification of DNA fragments was analysed with agarose gel electrophoresis (2.3.1.2).
Table M4. PCR components.
Component Concentration/amount
Template DNA 5-200 ng
Primer (each) 0.5 µM
dNTP mix 200 µM
MgSO4 0.5-2.5 mM
10 x Pfu DNA polymerase buffer 1 µl
Pfu DNA polymerase 0.2 µl
Ultra pure water (LiChrosolv) ad 20 µl
Table M5. PCR program.
Step Temperature Time Repeat
Initial denaturising 95 °C 2 min
Denaturizing 95 °C 1 min
30 x
Annealing 50-60 °C 1 min
Elongation 72 °C 2 min/kbp fragment
Final elongation 72 °C 10-20 min
Storage 4 °C ∞
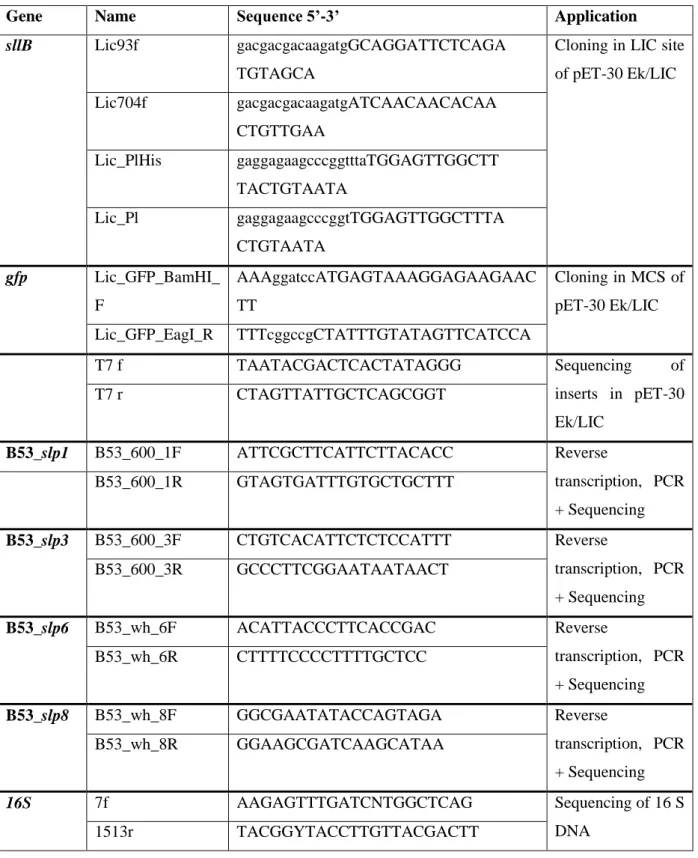
Table M6. PCR oligo-nucleotides.
Gene Name Sequence 5’-3’ Application
sllB Lic93f gacgacgacaagatgGCAGGATTCTCAGA
TGTAGCA
Cloning in LIC site of pET-30 Ek/LIC Lic704f gacgacgacaagatgATCAACAACACAA
CTGTTGAA
Lic_PlHis gaggagaagcccggtttaTGGAGTTGGCTT TACTGTAATA
Lic_Pl gaggagaagcccggtTGGAGTTGGCTTTA CTGTAATA
gfp Lic_GFP_BamHI_
F
AAAggatccATGAGTAAAGGAGAAGAAC TT
Cloning in MCS of pET-30 Ek/LIC Lic_GFP_EagI_R TTTcggccgCTATTTGTATAGTTCATCCA
T7 f TAATACGACTCACTATAGGG Sequencing of
inserts in pET-30 Ek/LIC
T7 r CTAGTTATTGCTCAGCGGT
B53_slp1 B53_600_1F ATTCGCTTCATTCTTACACC Reverse
transcription, PCR + Sequencing
B53_600_1R GTAGTGATTTGTGCTGCTTT
B53_slp3 B53_600_3F CTGTCACATTCTCTCCATTT Reverse
transcription, PCR + Sequencing
B53_600_3R GCCCTTCGGAATAATAACT
B53_slp6 B53_wh_6F ACATTACCCTTCACCGAC Reverse
transcription, PCR + Sequencing
B53_wh_6R CTTTTCCCCTTTTGCTCC
B53_slp8 B53_wh_8F GGCGAATATACCAGTAGA Reverse
transcription, PCR + Sequencing
B53_wh_8R GGAAGCGATCAAGCATAA
16S 7f AAGAGTTTGATCNTGGCTCAG Sequencing of 16 S
1513r TACGGYTACCTTGTTACGACTT DNA
2.3.5.2 Purification of PCR products
PCR products, which were used in following sequencing or cloning steps, were purified with the Quick StepTM 2 PCR Purification Kit (EdgeBio). A minimal sample volume of 20 µl was mixed with 4 µl purification resin and incubated at room temperature for 3 minutes. A special
purification column, which was stored in buffer, was centrifuged in the microcentrifuge 5415R (Eppendorf) at 700 x g for 3 minutes to remove spare buffer. The column was placed in a new microcentrifuge tube and the sample was placed in the middle of the column. The pure PCR product was collected by centrifugation at 700 x g for 2 minutes in the microcentrifuge tube. The column was removed.
2.3.5.3 Sequencing of DNA
The sequencing of PCR products was performed using the method which was described by Sanger (Sanger et al., 1977). The purified PCR products were used as template DNA for the sequencing reaction in the T3 thermocycler (Biometra). For the sequencing reaction mix 2- 4 µl purified PCR product, 1 µl sequencing primer (3.2 µM), 1 x BDT buffer and 1.5 µl BDT- mix (BigDye® Terminator v1.1 Cycle Sequencing Kit, Applied Biosystems) were combined with ultra pure water (LiChrosolv) to a final volume of 10 µl. The sequencing reaction was performed with the program described in table M7. The finished sequencing reaction was purified by ethanol-acetate precipitation (2.3.5.4). The analysis of the sequencing reaction was performed with the ABI PRISM 310 Genetic Analyzer (Applied Biosystems) and the data were evaluated with the DNA Sequencing software (Applied Biosystems).
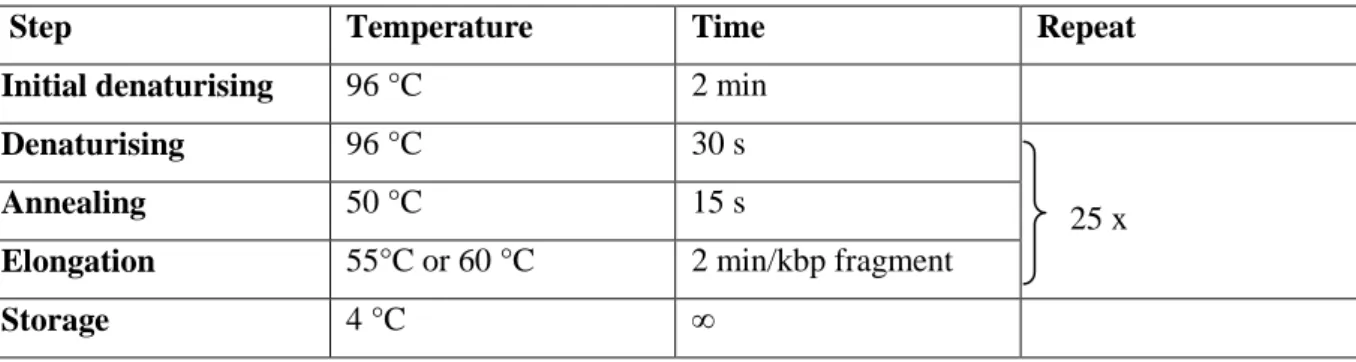
Table M7: Sequencing program.
Step Temperature Time Repeat
Initial denaturising 96 °C 2 min
Denaturising 96 °C 30 s
25 x
Annealing 50 °C 15 s
Elongation 55°C or 60 °C 2 min/kbp fragment
Storage 4 °C ∞
2.3.5.4 Ethanol Acetate precipitation of sequencing products
The precipitation of sequencing products was performed as previously described (2.3.2.4). In the first step 0.1 vol. 125 mM Na2-EDTA were additionally added to the sequencing product.
The resulting DNA pellet was solubilised in 25 µl HiDi®-Formamid (Applied Biosystems).
2.4 Genome sequencing and bioinformatics
2.4.1 Sequencing of whole bacterial genomes
The sequencing of whole genomes of Bacillus sp. JG-B53, Lysinibacillus sphaericus JG-A12 and other in house bacteria strains, which were isolated from a uranium mining waste pile, was performed by the Next Generation Sequencing technology with the Illumina Hi Seq 2000 by AROS Applied Biotechnology A/S. The Next Generation Sequencing (NGS) technology produces with DNA amounts of at least 1.2 µg dsDNA a huge amount of data. The used Illumina Hi-Seq 2000 technology provides read lengths of 2 x 100 base pairs for the whole genome within a run time of 8 days. Therefore the fragmentation of genomic DNA was performed by nebulisation or shearing. The DNA fragments were amplified on a surface via bridge PCR. Bridge PCR is a method for in vitro clonal amplification where fragments are amplified upon primers attached to solid surfaces forming clonal colonies. The generated clusters were sequenced by synthesis using a technique called cyclic reversible termination.
Four types of reversible dye-terminator bases were added and non-incorporated nucleotides were washed away. The DNA extended one nucleotide at a time. Using a camera, images of the fluorescently labelled nucleotides were taken. Afterwards the dye along with the terminal 3’ blocker were chemically removed from the DNA fragment, to allow the next cycle (Mardis, 2008).
2.4.2 Bioinformatic analyses of whole genome sequences
Bioinformatic analyses were realised with the Genomics Workbench (CLC bio). Therefore the sequenced genome information, which were generated in a fastq format of 200 bases lengths per sequence fragment, were imported to the Genomics Workbench and assembled with all imported data. Resulting contigs, which are the assembling products with a length of 200-500,000 bases, were afterwards extracted, the open reading frames were identified and the contigs were transformed to proteins.
Sequences comparisons for S-layer proteins were obtained using the NCBI database (http://www.ncbi.nlm.nih.gov/). Using parts of these sequences within the motif search tool of the Genomics Workbench, several proteins with identical or similar sequences were checked using BLAST database (http://blast.ncbi.nlm.nih.gov/). Identified surface layer proteins were analysed with Bioedit in order to identify size and amino acid composition of the proteins.
ExPASy program (http://web.expasy.org/protparam/) was used in order to calculate the theoretical isoelectric point while the signalP 4.0 program (www.cbs.dtu.dk/services/SignalP/)