© 2017 European Association of Geochemistry
The heterogeneous nature of Fe delivery from melting icebergs
M.J. Hopwood1*, C. Cantoni2, J.S. Clarke1, S. Cozzi2, E.P. Achterberg1
Abstract doi: 10.7185/geochemlet.1723 The micronutrient iron (Fe) can be transported from marine terminating glaciers to the ocean by icebergs. There are however few observations of iceberg Fe content, and the flux of Fe from icebergs to the offshore surface ocean is poorly constrained. Here we report the dissolved Fe (DFe), total dissolvable Fe (TdFe) and ascorbic acid extractable Fe (FeAsc) sediment content of icebergs from Kongsfjorden, Svalbard. The concentrations of DFe (range 0.63 nM – 536 nM, mean 37 nM, median 6.5 nM) and TdFe (range 46 nM – 57 µM, mean 3.6 µM, median 144 nM) both demonstrated highly heterogeneous distributions and there was no significant correla- tion between these two fractions. FeAsc (range 0.0042 to 0.12 wt. %) was low compared to both previous measurements in Kongsfjorden and to current estimates of the global mean.
FeAsc content per volume ice did however, as expected, show a significant relationship with sediment loading (which ranged from < 0.1 – 234 g L-1 of meltwater). In the Arctic, icebergs lose their sediment load faster than ice volume due to the rapid loss of basal ice after calving.
We therefore suggest that the loss of basal ice is a potent mechanism for the reduction of mean TdFe and FeAsc per volume of iceberg. Delivery of TdFe and FeAsc to the ocean is thereby biased towards coastal waters where, in Kongsfjorden, DFe (18 ± 17 nM) and TdFe (mean 8.1 µM, median 3.7 µM) concentrations were already elevated.
Received 27 September 2016 | Accepted 25 April 2017 | Published 7 June 2017
Introduction
Icebergs contain higher Fe concentrations than seawater, both in the dissolved (<0.2 µm) (Martin et al., 1990; De Baar et al., 1995; Loscher et al., 1997) and parti- culate (>0.2 µm) phases (Hart, 1934; Lin et al., 2011; Shaw et al., 2011). Icebergs should thus constitute a source of the micronutrient Fe to offshore polar waters (Raiswell et al., 2008). As the rate of iceberg calving in polar seas oscillates on glacial to inter-glacial timescales (Bond et al., 1992), and recent climate change has
1. GEOMAR, Helmholtz Centre for Ocean Research, 24148 Kiel, Germany
* Corresponding author (email: mhopwood@geomar.de) 2. CNR-ISMAR, Marine Science Institute, 34149 Trieste, Italy
increased the discharge of calved ice volume from both the Antarctic (Paolo et al., 2015) and Greenlandic (Bamber et al., 2012) ice sheets, Fe delivery from icebergs may also change. Particularly in the Southern Ocean, where DFe deficiency extensively limits primary production (Martin et al., 1990, 1991; Moore et al., 2013), and icebergs cause chemical and biological enrichment of surrounding waters (Smith Jr. et al., 2007; Schwarz and Schodlok, 2009; Smith et al., 2011), a change in iceberg Fe supply could significantly affect marine primary produc- tivity. Yet there remain large uncertainties concerning the magnitude of iceberg Fe supply and its effect(s) on marine ecosystems. For example, calculated phyto- plankton Fe utilisation is considerably less than present estimates of iceberg Fe supply to the Weddell Sea (Boyd et al., 2012). The reason for this is unclear, yet it demonstrates the difficulty in isolating the contribution of icebergs to the marine Fe cycle.
Observations of DFe concentrations in iceberg meltwater are sparse, but the available data does suggest a heterogeneous distribution, with DFe ranging 4–600 nM in Antarctic (Lin et al., 2011) and 3–300 nM in Greenlandic (Hopwood et al., 2016) iceberg melt. The distribution of particulate Fe (which includes FeAsc) is also expected to be heterogeneous due to the presence of embedded sediment- rich layers that account for only a small fraction of total iceberg volume (Lin et al., 2011; Raiswell, 2011; Raiswell et al., 2016). Whilst TdFe data for icebergs is sparse, iceberg FeAsc content has previously been estimated in multiple catchments worldwide (Raiswell et al., 2016) producing a mean global content of 2.7–17 µM.
However, FeAsc content and offshore iceberg FeAsc fluxes are normally calcu- lated using a mean sediment loading (0.5 g L-1 is widely used as outlined in Raiswell et al. (2016)) with considerable uncertainty generally acknowledged in this value. Here we combine the analysis of DFe, TdFe, FeAsc and iceberg sedi- ment load in order to provide a well constrained assessment of iceberg-Fe content within a single catchment.
Methods
A FeAsc dataset was compiled for icebergs in Kongsfjorden with visible embedded or surface sediment sampled from small boats in July 2015 and August 2016.
Sediment from pro-glacial streambeds in the catchment, embedded sediment from Kongsvegen glacier surface, and embedded sediment ~100 m inside an ice crevasse (on Midtre Lovénbreen glacier) was also collected (Fig. 1) for compara- tive purposes. FeAsc leaches were conducted on wet sediment as per Raiswell et al. (2010), with leached Fe determined by measuring absorbance (λ = 562 nm) before and after the addition of ferrozine (as detailed in Supplementary Informa- tion Methods).
Separately, ice samples (1–2 kg) were randomly collected from small boats (July 2015). The meltwater was acidified to pH < 2. After storage for 12 months, DFe and TdFe were measured by inductively coupled plasma mass spectroscopy (further details in Supplementary Information Methods).
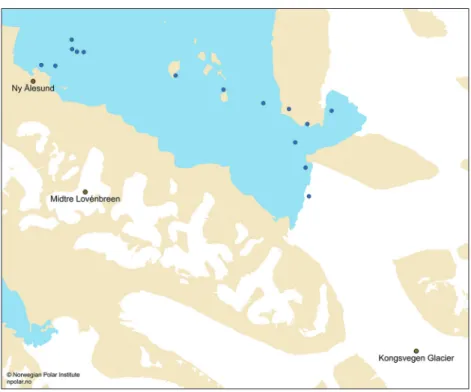
Figure 1 Surface fjord sample locations in Kongsfjorden.
Results
The FeAsc concentration is reported for 116 different sediment samples (Table S-2) including 58 iceberg samples collected from ice with visible embedded sedi- ment. FeAsc ranged from 0.0042 to 0.12 wt. % in iceberg embedded sediment (Fig. 2). Ice sediment content ranged from <0.1 to 234 g L-1 of meltwater, close to the 0.2–200 g L-1 range previously reported in Svalbard by Dowdeswell and Dowdeswell (1989). Combining FeAsc (wt. %) and sediment load (g L-1 of melted ice) produced a median FeAsc ice content of 2.5 µM. Given that our sampling strategy was to target sediment-rich ice, this should thereby be an over-estimate of median iceberg FeAsc content (L-1 of melted ice) in Kongsfjorden.
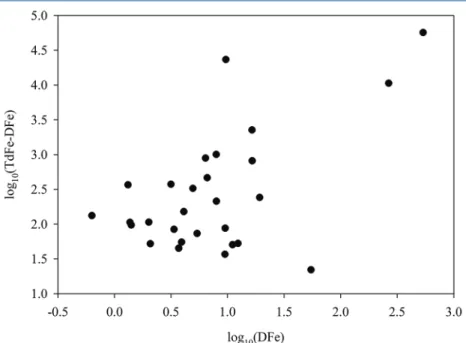
The DFe and TdFe concentrations are reported in parallel for 28 randomly collected iceberg samples (Table S-4). TdFe ranged from 46 nM to 57 µM (mean 3.6 µM, median 144 nM) and the range of 0.63 nM – 536 nM for DFe was simi- larly broad (mean 37 nM, median 6.5 nM). There was no significant correlation between particulate Fe (TdFe minus DFe) and DFe in these samples (Fig. 3),
suggesting that DFe was not specifically associated with sediment laden ice. For comparison, DFe in surface fjord waters averaged 18 ± 17 nM (15 surface stations, Fig. 1) and TdFe ranged widely from 1.1 to 52 µM (mean 8.1 µM, median 3.7 µM) (Table S-3).
Figure 2 Median FeAsc (wt. %) with 25/75th (boxes) and 10/90th (whiskers) percentiles (outliers also shown) for iceberg embedded (n = 34) and iceberg surface (n = 20) sediment.
Discussion
As has been demonstrated in this study and elsewhere (e.g., Markussen et al., 2016), surface waters in stratified, glaciated fjords can exhibit extremely high TdFe concentrations due to the presence of glacially derived particle plumes.
TdFe concentrations in surface waters of Kongsfjorden (mean 8.1 µM, median 3.7 µM) exceeded those in icebergs (3.6 µM and 144 nM, respectively). In the Arctic, a large fraction of iceberg melt occurs in these inshore, high TdFe waters before icebergs are able to deliver Fe to the offshore environment. Accounting for this near-shore loss in flux calculations for iceberg derived Fe supply to the open ocean is difficult. In two Greenlandic catchments, Ilulissat Fjord and Sermilik Fjord, overall in-fjord iceberg volume losses were estimated to be >50 % (Enderlin et al., 2016), tentatively supporting the 50 % inshore iceberg volume loss used to estimate offshore FeAsc fluxes by Raiswell et al. (2016). However this assumes that changes in total iceberg Fe content are directly proportional to changes in total ice volume.
All measured Fe phases (DFe, TdFe and FeAsc) in Kongsfjorden were very heterogeneously distributed within the ice. For TdFe and FeAsc (but not DFe, Fig. 3), this can specifically be attributed to the heterogeneous distribution of ice embedded sediment. In the Arctic, iceberg-borne sediment is known to be lost from icebergs faster than ice volume (Mugford and Dowdeswell, 2010) due to its association with basal ice. Thus we expect that the mean TdFe content per volume of an iceberg should decline with time after calving. A model for Kangerdlugssuaq Fjord (Greenland) shows that whilst icebergs lose 20–30 % ice volume within this fjord, the corresponding in-fjord sediment loss is 70–85
% (Mugford and Dowdeswell, 2010). Only a relatively small iceberg volume loss (<20 %) is thereby likely required for the majority of TdFe content to be lost from icebergs. In Kongsfjorden, where summer melting of calved ice is quite rapid due to relatively warm surface seawater (4–5 °C throughout July-August 2016), the post-calving age of an iceberg is therefore likely a critical factor in determining its TdFe content. Sediment loss should also affect mean FeAsc content in the same way, however FeAsc losses may be offset from TdFe losses if significant processing of surface sediment occurs on the timescale of iceberg Fe delivery (Raiswell et al., 2016).
Figure 3 DFe and TdFe (both nM, plotted as log10, TdFe shown minus DFe) for 28 discrete iceberg samples showed no clear relationship.
In Kongsfjorden, Raiswell et al. (2016) reported a FeAsc range of 0.016–0.37 wt. % (n = 14), with a mean of 0.14 wt. % and median of 0.092 wt. %;
equivalent to 1.4–33 µM, 12 µM and 8.2 µM, respectively when using the suggested mean sediment loading of 0.5 g L-1. Comparing our data both as wt. % and as a µM concentration (calculated using measured sediment loading for each sample, range 0.1–234 g L-1, Table S-2), our FeAsc (wt. %) is consistently lower. Yet our mean FeAsc per volume is much higher (51 µM), because our measured sediment loadings were often greater than the assumed mean of 0.5 g L-1. These differences generally highlight the very high spatial variability in iceberg sediment load and thus TdFe and FeAsc content even within a single fjord.
Table 1 Comparing data for Kongsfjorden from this and prior work suggests a critical dif- ference in both FeAsc (wt. %) and in the scaling of FeAsc to iceberg sediment load (g L-1 of ice melt). *The suggested 0.5 g L-1 sediment loading is used for data from Raiswell et al. (2016).
** For our study, measured sediment loadings were used for each sample. As sediment-rich ice was specifically targeted, the calculated mean/median should be over-estimates.
a This study b Raiswell et al. (2016) a/b %
FeAsc / wt. % Mean 0.021 0.14 16
Median 0.015 0.092 17
FeAsc / µM (per litre
of ice melt)* Mean <59 ** 12 480
Median <2.5 ** 8.2 31
Some methodological differences between this study and previous work could be important for the difference in FeAsc (wt. %) (Table 1). In our study, the sediment was not sieved to remove anomalous large particles. Yet a relatively large sub-sample mass was used with good reproducibility demonstrated. For glacial flour particles of <1 mm, it has previously been demonstrated that the change in FeAsc (wt. %) with particle size is not pronounced (Hopwood et al., 2014; Raiswell et al., 2016), but this may not be the case for larger particles.
Moreover, in this study sediment was processed in Svalbard with no prolonged storage between collection and analysis. Whilst dried sediment exhibits a rapid decline in FeAsc wt. % (Raiswell et al., 2010), it is not clear how storage of ice or wet sediments affects FeAsc.
Furthermore, there are the critical issues of heterogeneity and of the non- linearity between iceberg sediment and iceberg volume losses. In-fjord iceberg volume loss should correspond to a disproportionately high loss of iceberg embedded sediment (Mugford and Dowdeswell, 2010), and thereby also FeAsc and TdFe. There are no quantitative measures of iceberg age or volume loss for our dataset and the residence time of ice in Kongsfjorden is strongly affected by meteorological conditions and thus subject to high short-term variability. None- theless, a difference in the post-calving age of ice sampled between different datasets could correspond to large shifts in iceberg FeAsc and TdFe content.
Increased iceberg age would be expected to correspond to lower mean sedi- ment load, and thereby lower TdFe and FeAsc per volume. A reduction in basal
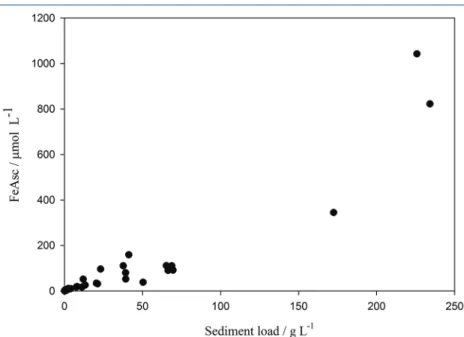
sediment load could also explain a difference in FeAsc (wt. %) content if FeAsc (wt. %) is enriched in basal ice compared to non-basal ice. FeAsc (µmol L-1) is correlated with sediment load (Fig. 4), but assessing whether changes in sediment load affect FeAsc (wt. %) is complicated by the lack of any parameter to account for the post-calving age of ice and by the highly variable bedrock composition across Kongsfjorden (see for example Hjelle, 1993).
Figure 4 FeAsc (µmol L-1 melted ice) increased with sediment load (g L-1 melted ice), but it is unclear if the relationship remains linear at high (>50 g L-1) loadings.
Conclusions
Whilst median DFe (6.5 nM) and TdFe (144 nM) concentrations in Kongsfjorden were within the range of concentrations reported elsewhere globally, the median FeAsc concentration (2.5 µM) measured was considerably lower than that reported previously in Kongsfjorden, and compared to present estimates of the global mean, despite the very high sediment loadings observed (<0.1 – 234 g L-1).
Generally in the Arctic, a sharp decline in the mean FeAsc and TdFe per volume of meltwater from icebergs with time after calving would be expected due to the preferential loss of iceberg basal ice, as modelled by Mugford and Dowdeswell (2010). Iceberg derived fluxes of TdFe and FeAsc are thereby biased towards delivery in near-shore waters and offshore fluxes are likely much less than if TdFe and FeAsc were homogeneously distributed throughout icebergs.
Glossary
‘Fe’ refers to all iron phases.
‘DFe’, dissolved Fe, refers to all Fe phases <0.2 µm.
‘FeAsc’ is the ferrihydrite content of sediment, defined by Raiswell et al. (2010).
‘TdFe’ is all Fe soluble at pH < 2, inclusive of DFe and should also include any FeAsc present in unfiltered meltwater.
Acknowledgements
Financial aid from the European Commission (OCEAN-CERTAIN, FP7- ENV-2013-6.1-1; no: 603773) is gratefully acknowledged. 2016 fieldwork was conducted during the CNR Dirigibilite Italia hosted project ‘pH in Svalbard’.
Editor: Liane G. Benning
Additional Information
Supplementary Information accompanies this letter at www.geochemicalperspectivesletters.org/article1723
This work is distributed under the Creative Commons Attri- bution 4.0 License, which permits unrestricted use, distribu- tion, and reproduction in any medium, provided the original author and source are credited. Additional information is available at http://www.
geochemicalperspectivesletters.org/copyright-and-permissions.
Cite this letter as: Hopwood, M.J., Cantoni, C., Clarke, J.S., Cozzi, S., Achterberg, E.P. (2017) The heterogeneous nature of Fe delivery from melting icebergs.
Geochem. Persp. Let. 3, 200–209.
References
BamBer, J., vanden Broeke, m., ettema, J., Lenaerts, J., rignot, e. (2012) Recent large increases in freshwater fluxes from Greenland into the North Atlantic. Geophysical Research Letters 39, L19501, doi:10.1029/2012gl052552.
Bond, g., HeinricH, H., Broecker, W.s., LaBeyrie, L., mcmanus, J.F., andreWs, J.t., Huon, s., JantscHik, r., cLasen, s., simet, c., tedesco, k., kLas, m., Bonani, g., ivy, s.
(1992) Evidence for massive discharges of icebergs into the North Atlantic ocean during the last glacial period, Nature 360, 245–249.
Boyd, P.W., arrigo, k.r., strzePek, r., van diJken, g.L. (2012) Mapping phytoplankton iron utilization: Insights into Southern Ocean supply mechanisms. Journal Geophysical Research:
Oceans 117, doi:10.1029/2011JC007726.
de Baar, H.J.W., de Jong, J.t.m., Bakker, d.c.e., LoscHer, B.m., vetH, c., BatHmann, u., smetacek, v. (1995) Importance of iron for plankton blooms and carbon dioxide drawdown in the Southern Ocean. Nature 373, 412–415.
doWdesWeLL, J.a., doWdesWeLL, e.k. (1989) Debris in Icebergs and Rates of Glaci-Marine Sedi- mentation: Observations from Spitsbergen and a Simple Model. The Journal of Geology 97, 221–231.
enderLin, e.m., HamiLton, g.s., straneo, F., sutHerLand, d.a. (2016) Iceberg meltwater fluxes dominate the freshwater budget in Greenland’s iceberg-congested glacial fjords. Geophys- ical Research Letters 43, 11287–11294.
Hart, t.J. (1934) Discovery Reports. Discovery Reports 8, 1–268.
HJeLLe, a. (1993) The geology of Svalbard: Oslo. Polarhåndbok nr. 6. Norsk Polarinstitutt, Oslo.
HoPWood, m.J., statHam, P.J., tranter, m., WadHam, J.L. (2014) Glacial flours as a potential source of Fe(II) and Fe(III) to polar waters. Biogeochemistry 118, 443–452.
HoPWood, m.J., conneLLy, d.P., arendt, k.e., JuuL-Pedersen, t., stincHcomBe, m., meire, L., esPosito, m., krisHna, r. (2016) Seasonal changes in Fe along a glaciated Greenlandic fjord. Frontiers in Earth Sciences 4, doi:10.3389/feart.2016.00015.
Lin, H., rauscHenBerg, s., HexeL, c.r., sHaW, t.J., tWining, B.s. (2011) Free-drifting icebergs as sources of iron to the Weddell Sea. Deep Sea Research Part II: Topical Studies in Oceanography 58, 1392–1406.
LoscHer, B.m., de Baar, H.J.W., de Jong, J.t.m., vetH, c., deHairs, F. (1997) The distribu- tion of Fe in the Antarctic Circumpolar Current. Deep Sea Research Part II: Topical Studies in Oceanography 44, 143–187.
markussen, t.n., eLBerLing, B., Winter, c., andersen, t.J. (2016) Flocculated meltwater particles control Arctic land-sea fluxes of labile iron. Scientific Reports 6, 24033.
martin, J.H., gordon, r.m., FitzWater, s.e. (1990) Iron in Antarctic waters. Nature 345, 156–158.
martin, J.H., gordon, r.m., FitzWater, s.e. (1991) The case for iron. Limnology and Oceanog- raphy 36, 1793–1802.
moore, c.m., miLLs, m.m., arrigo, k.r., Berman-Frank, i., BoPP, L., Boyd, P.W., gaLBraitH, e.d., geider, r.J., guieu, c., Jaccard, s.L., JickeLLs, t.d., La rocHe, J., Lenton, t.m., maHoWaLd, n.m., maranon, e., marinov, i., moore, J.k., nakat-
suka, t., oscHLies, a., saito, m.a., tHingstad, t.F., tsuda, a., uLLoa, o. (2013) Processes and patterns of oceanic nutrient limitation. Nature Geoscience 6, 701–710.
mugFord, r.i., doWdesWeLL, J.a. (2010) Modeling iceberg-rafted sedimentation in high-latitude fjord environments. Journal of Geophysical Research: Earth Surface 115, doi:10.1029/2009JF001564.
PaoLo, F.s., Fricker, H.a., Padman, L. (2015) Volume loss from Antarctic ice shelves is acceler- ating. Science 348, 327–331.
raisWeLL, r. (2011) Iceberg-hosted nanoparticulate Fe in the Southern Ocean: Mineralogy, origin, dissolution kinetics and source of bioavailable Fe. Deep Sea Research Part II: Topical Studies in Oceanography 58, 1364–1375.
raisWeLL, r., Benning, L.g., tranter, m., tuLaczyk, s. (2008) Bioavailable iron in the Southern Ocean: the significance of the iceberg conveyor belt. Geochemical Transactions 9, doi:10.1186/1467-4866-9-7.
raisWeLL, r., vu, H.P., Brinza, L., Benning, L.g. (2010) The determination of labile Fe in ferri- hydrite by ascorbic acid extraction: Methodology, dissolution kinetics and loss of solubility with age and de-watering. Chemical Geology 278, 70–79.
raisWeLL, r., HaWkings, J.r., Benning, L.g., Baker, a.r., deatH, r., aLBani, s., maHoWaLd, n., krom, m.d., PouLton, s.W., WadHam, J., tranter, m. (2016) Potentially bioavail- able iron delivery by iceberg-hosted sediments and atmospheric dust to the polar oceans.
Biogeosciences 13, 3887–3900.
scHWarz, J.n., scHodLok, m.P. (2009) Impact of drifting icebergs on surface phytoplankton biomass in the Southern Ocean: Ocean colour remote sensing and in situ iceberg tracking.
Deep Sea Research Part I: Oceanographic Research Papers 56, 1727–1741.
sHaW, t.J., raisWeLL, r., HexeL, c.r., vu, H.P., moore, W.s., dudgeon, r., smitH Jr., k.L.
(2011) Input, composition, and potential impact of terrigenous material from free-drifting icebergs in the Weddell Sea. Deep Sea Research Part II: Topical Studies in Oceanography 58, 1376–1383.
smitH, k.L., sHerman, a.d., sHaW, t.J., murray, a.e., vernet, m., ceFareLLi, a.o. (2011) Carbon export associated with free-drifting icebergs in the Southern Ocean. Deep Sea Research Part II: Topical Studies in Oceanography 58, 1485–1496.
smitH Jr., k.L., roBison, B.H., HeLLy, J.J., kauFmann, r.s., ruHL, H.a., sHaW, t.J., tWining, B.s., vernet, m. (2007) Free-drifting icebergs: Hot spots of chemical and biological enrich- ment in the Weddell Sea. Science 317, 478–482.
then excess water was removed slowly (<5 mL min-1) by filtration (0.45 µm, poly- vinylidene fluoride, Millipore) to concentrate the sediment. All plastic vials and filtration equipment for sediment collection/handling was pre-cleaned (1 M HCl, 3 de-ionised water rinses) prior to use. FeAsc was determined as per Raiswell et al. (2010) but using larger (~100 mg) sediment samples without sieving. Leached Fe was determined by measuring absorbance (λ = 562 nm) before, and after, the addition of ferrozine (Stookey, 1970) using a 1 cm cell with a USB4000 Fiber-optic Spectrometer and a LS-1 tungsten halogen light source (Ocean Optics). Fe stan- dards were made by spiking DFe from an acidified (pH 2) 1 mM Fe stock solution into aliquots of ascorbic leaching solution producing a linear response (R2 > 0.99, derived molar adsorption coefficient 24,500 M-1 cm-1) over the absorbance range 0–0.6. Sample absorbance was then corrected for background absorbance and dilution by reagents.
A sub-sample of sediment was retained (except for sediment loadings
<0.1 g L-1 where this was not possible) and air dried to constant mass in order to calculate FeAsc content g-1 (of sediment) and L-1 (of meltwater). FeAsc measure- ments were duplicated for 11 randomly selected samples producing a relative standard deviation of 4.5 %. The propagated standard deviation for FeAsc L-1 of meltwater (obtained from combining sediment load with FeAsc wt. %) was approximately 15 %.
DFe and TdFe
125 mL LDPE bottles (Nalgene) were pre-cleaned in a 3 stage process with 3 de-ionised water rinses after each stage (detergent, 1.2 M HCl, 1.2 M HNO3).
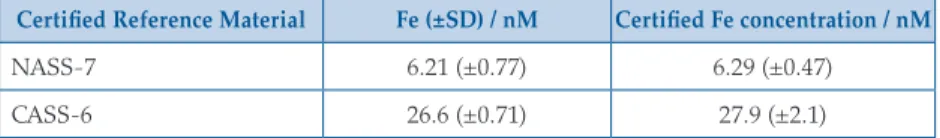
After melting ice in LDPE bags, as above, 125 mL meltwater was retained without filtration for TdFe, and 125 mL was syringe filtered for DFe analysis (0.20 µm, polyvinylidene fluoride, Millipore). TdFe and DFe samples were acidified (with HCl, UPA, ROMIL) to pH < 2.0 and subsequently stored for 12 months to ensure complete recovery of soluble Fe (Edwards and Sedwick, 2001). DFe and TdFe were analysed by ICP-MS (ELEMENT XR, ThermoFisherScientific) after dilution with 1 M HNO3 (distilled in house using a DST-1000, Savillex, from SPA grade HNO3, ROMIL) and calibrated by standard addition with a linear peak response from 0–1000 nM Fe (R2 > 0.99). The analytical blank (DFe and TdFe) was always <0.6 nM Fe. To verify that the dilution technique yielded reproducible and accurate DFe results, NASS-7 and CASS-6 Certified Reference Materials (CRMs, National Research Council Canada) were analysed for Fe. Both CRMs yielded reproducible Fe concentrations within the certified ranges (Table S-1).
Table S-1 Analysis of Certified Reference Materials for Fe concentration (± standard deviation of at least 6 measurements).
Certified Reference Material Fe (±SD) / nM Certified Fe concentration / nM
NASS-7 6.21 (±0.77) 6.29 (±0.47)
CASS-6 26.6 (±0.71) 27.9 (±2.1)
The heterogeneous nature of Fe delivery from melting icebergs
M.J. Hopwood1*, C. Cantoni2, J.S. Clarke1, S. Cozzi2, E.P. Achterberg1
Supplementary Information The Supplementary Information includes:
➣ Supplementary Methods
➣ Supplementary Material
➣ Supplementary Information References
➣ Tables S-1 to S-4
Supplementary Methods
Ice sample collection
All ice samples were collected from calved ice masses within Kongsfjorden east of 11.89° E. Sampled icebergs had a maximum length (visible above the waterline) of between 0.4 and 20 m, and a maximum height above the waterline of between 10 cm and 4 m. For FeAsc, icebergs with visible sediment layers (darkened layers approximately 0.5 to 5 cm thick) were targeted whereas sample collection for DFe/TdFe was random.
FeAsc
To measure FeAsc, 1–2 kg ice pieces were returned to the laboratory in insu- lated plastic boxes. As a precaution against contamination, ice was rinsed with de-ionised water (Milli-Q, Millipore, conductivity 18.2 MΩ cm-1). Ice was then melted in low density polyethylene (LDPE) bags with the first (1–2 hr later) melt- water discarded. After melting ice overnight, the total volume was recorded and
1. GEOMAR, Helmholtz Centre for Ocean Research, 24148 Kiel, Germany
* Corresponding author (email: mhopwood@geomar.de) 2. CNR-ISMAR, Marine Science Institute, 34149 Trieste, Italy
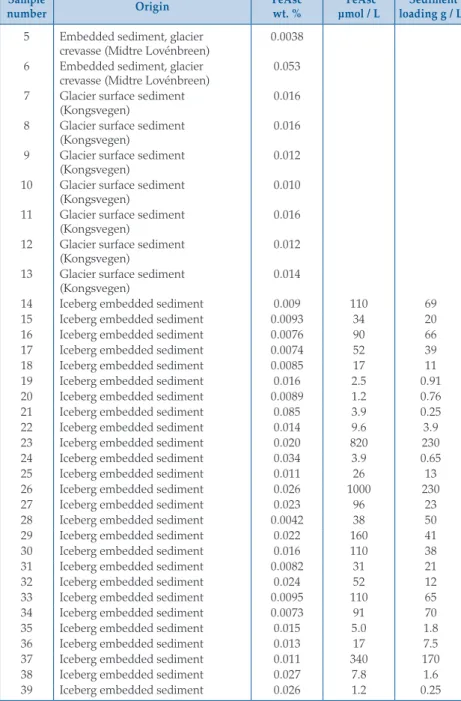
Sample
number Origin FeAsc
wt. % *FeAsc
µmol / L *Sediment loading g / L 5 Embedded sediment, glacier
crevasse (Midtre Lovénbreen) 0.0038 6 Embedded sediment, glacier
crevasse (Midtre Lovénbreen) 0.053 7 Glacier surface sediment
(Kongsvegen) 0.016
8 Glacier surface sediment (Kongsvegen)
0.016 9 Glacier surface sediment
(Kongsvegen) 0.012
10 Glacier surface sediment
(Kongsvegen) 0.010
11 Glacier surface sediment (Kongsvegen)
0.016 12 Glacier surface sediment
(Kongsvegen) 0.012
13 Glacier surface sediment
(Kongsvegen) 0.014
14 Iceberg embedded sediment 0.009 110 69
15 Iceberg embedded sediment 0.0093 34 20
16 Iceberg embedded sediment 0.0076 90 66
17 Iceberg embedded sediment 0.0074 52 39
18 Iceberg embedded sediment 0.0085 17 11
19 Iceberg embedded sediment 0.016 2.5 0.91
20 Iceberg embedded sediment 0.0089 1.2 0.76
21 Iceberg embedded sediment 0.085 3.9 0.25
22 Iceberg embedded sediment 0.014 9.6 3.9
23 Iceberg embedded sediment 0.020 820 230
24 Iceberg embedded sediment 0.034 3.9 0.65
25 Iceberg embedded sediment 0.011 26 13
26 Iceberg embedded sediment 0.026 1000 230
27 Iceberg embedded sediment 0.023 96 23
28 Iceberg embedded sediment 0.0042 38 50
29 Iceberg embedded sediment 0.022 160 41
30 Iceberg embedded sediment 0.016 110 38
31 Iceberg embedded sediment 0.0082 31 21
32 Iceberg embedded sediment 0.024 52 12
33 Iceberg embedded sediment 0.0095 110 65
34 Iceberg embedded sediment 0.0073 91 70
35 Iceberg embedded sediment 0.015 5.0 1.8
36 Iceberg embedded sediment 0.013 17 7.5
37 Iceberg embedded sediment 0.011 340 170
38 Iceberg embedded sediment 0.027 7.8 1.6
39 Iceberg embedded sediment 0.026 1.2 0.25
A linear plot of all paired DFe and TdFe minus DFe (n = 28) yielded R2 = 0.78. However, R2 declined to 0.01 when the 3 highest TdFe data were removed. A Spearman Rank Order Correlation suggested there was no significant relationship between DFe and TdFe minus DFe (P value 0.21). A linear plot of all FeAsc (mol L-1) data and corresponding ice sediment load (g L-1) yielded R2 = 0.88.
A Spearman Rank Order Correlation Coefficient of 0.95 (P value 2 × 10⁻⁷, n = 58) demonstrates that the relationship is significant and remains significant if the 3 highest sediment loadings are removed (Coefficient 0.94, P value 2 × 10⁻⁷, n = 55) – regardless of whether the sediment loads reported as <0.1 g L-1 are treated as 0.1 g L-1, 0.01 g L-1, or excluded. Statistics were performed in SigmaPlot 13.
Water column
In July 2015, 15 samples of fjord surface water (depth <0.2 m) were collected by hand upstream of a small boat (locations shown Fig. 1). As per ice samples for DFe and TdFe, 125 mL was retained without filtration and 125 mL was syringe filtered for DFe analysis (0.20 µm, polyvinylidene fluoride, Millipore). Analysis was conducted via ICP-MS after storage for 12 months at pH < 2, and dilution with 1 M HNO3 (as per melted ice, above). The temperature and salinity of surface fjord water were recorded using a LF 325 conductivity meter (WTW) which was calibrated before use with a KCl solution.
In July–August 2016 conductivity, temperature, depth profiles (CTDs) were acquired at 20 stations in the area of the fjord where ice was observed and collected (east of 11.89° E and proceeding to within approximately 400 m of each marine terminating glacier in Kongsfjorden, Fig. 1). Seawater temperature (recorded at 1 m depth) was consistently 4.0–5.0 °C. A broader range of surface temperatures were observed in July 2015 (2.6–8.8 °C at <0.2 m), but are not directly comparable because of the depth difference.
Supplementary Material
Table S-2 FeAsc concentration reported for various sediment samples collected around Kongsfjorden. For iceberg embedded sediment with sediment loadings >0.1 g L-1, FeAsc is reported both as wt. % and per volume of meltwater.
Sample
number Origin FeAsc
wt. %
*FeAsc µmol / L
*Sediment loading g / L 1 Embedded sediment, glacier
crevasse (Midtre Lovénbreen) 0.014 2 Embedded sediment, glacier
crevasse (Midtre Lovénbreen) 0.0057 3 Embedded sediment, glacier
crevasse (Midtre Lovénbreen)
0.17 4 Embedded sediment, glacier
crevasse (Midtre Lovénbreen) 0.023
Sample
number Origin FeAsc
wt. %
*FeAsc µmol / L
*Sediment loading g / L
40 Iceberg embedded sediment 0.025 11 2.4
41 Iceberg embedded sediment 0.12 3.0 0.14
42 Iceberg embedded sediment 0.028 2.5 0.51
43 Iceberg embedded sediment 0.013 19 8.1
44 Iceberg embedded sediment 0.011 80 39
45 Iceberg embedded sediment 0.020 3.6 0.99
46 Iceberg embedded sediment 0.026 1.2 0.26
47 Iceberg embedded sediment 0.012 2.1 1.0
48 Iceberg embedded sediment n/d 0.26 < 0.1
49 Iceberg embedded sediment n/d 0.26 < 0.1
50 Iceberg embedded sediment n/d 0.87 < 0.1
51 Iceberg embedded sediment n/d 0.65 < 0.1
52 Iceberg embedded sediment n/d 0.27 < 0.1
53 Iceberg embedded sediment n/d 0.50 < 0.1
54 Iceberg embedded sediment n/d 0.28 < 0.1
55 Iceberg embedded sediment n/d 0.63 < 0.1
56 Iceberg embedded sediment n/d 0.40 < 0.1
57 Iceberg embedded sediment n/d 0.69 < 0.1
58 Iceberg embedded sediment n/d 0.37 < 0.1
59 Iceberg embedded sediment n/d 0.43 < 0.1
60 Iceberg embedded sediment n/d 0.68 < 0.1
61 Iceberg embedded sediment n/d 0.87 < 0.1
62 Iceberg embedded sediment n/d 0.27 < 0.1
63 Iceberg embedded sediment n/d 0.39 < 0.1
64 Iceberg embedded sediment n/d 1.8 < 0.1
65 Iceberg embedded sediment n/d 0.40 < 0.1
66 Iceberg embedded sediment n/d 0.77 < 0.1
67 Iceberg embedded sediment n/d 0.35 < 0.1
68 Iceberg embedded sediment n/d 0.29 < 0.1
69 Iceberg embedded sediment n/d 0.32 < 0.1
70 Iceberg embedded sediment n/d 0.20 < 0.1
71 Iceberg embedded sediment n/d 0.15 < 0.1
72 Iceberg surface sediment 0.0065 73 Iceberg surface sediment 0.0068 74 Iceberg surface sediment 0.0091 75 Iceberg surface sediment 0.0072
76 Iceberg surface sediment 0.024
77 Iceberg surface sediment 0.0071
78 Iceberg surface sediment 0.032
79 Iceberg surface sediment 0.010
80 Iceberg surface sediment 0.012
81 Iceberg surface sediment 0.021
Sample
number Origin FeAsc
wt. % *FeAsc
µmol / L *Sediment loading g / L 82 Iceberg surface sediment 0.0093
83 Iceberg surface sediment 0.0077
84 Iceberg surface sediment 0.059
85 Iceberg surface sediment 0.0066 86 Iceberg surface sediment 0.0080 87 Iceberg surface sediment 0.0080
88 Iceberg surface sediment 0.029
89 Iceberg surface sediment 0.032
90 Iceberg surface sediment 0.0087 91 Iceberg surface sediment 0.0098 92 Pro-glacial stream, glacial flour 0.0090 93 Pro-glacial stream, glacial flour 0.0083 94 Pro-glacial stream, glacial flour 0.0063 95 Pro-glacial stream, glacial flour 0.0079 96 Pro-glacial stream, glacial flour 0.0072 97 Pro-glacial stream, glacial flour 0.0070 98 Pro-glacial stream, glacial flour 0.0073 99 Pro-glacial stream, glacial flour 0.019 100 Pro-glacial stream, glacial flour 0.031 101 Pro-glacial stream, glacial flour 0.010 102 Pro-glacial stream, glacial flour 0.0078 103 Pro-glacial stream, glacial flour 0.010 104 Pro-glacial stream, glacial flour 0.0066 105 Pro-glacial stream, glacial flour 0.0089 106 Pro-glacial stream, glacial flour 0.0096 107 Pro-glacial stream, glacial flour 0.0041 108 Pro-glacial stream, glacial flour 0.0032 109 Pro-glacial stream, glacial flour 0.0057 110 Pro-glacial stream, glacial flour 0.0079 111 Surface glacier (Kongsvegen)
embedded sediment 0.044
112 Surface glacier (Kongsvegen)
embedded sediment 0.071
113 Surface glacier (Kongsvegen)
embedded sediment 0.037
114 Surface glacier (Kongsvegen) embedded sediment
0.011 115 Surface glacier (Kongsvegen)
embedded sediment 0.061
116 Surface glacier (Kongsvegen)
embedded sediment 0.11
* Iceberg embedded sediment only
n/d not determined as dry mass insufficient (< 0.1 g) Table S-2 Cont.
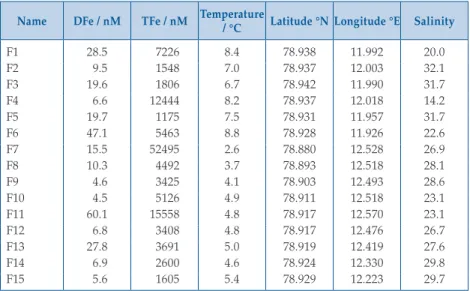
Table S-3 Dissolved (<0.2 µm) Fe and total dissolvable Fe for 15 surface water samples collected in Kongsfjorden (July 2015).
Name DFe / nM TFe / nM Temperature / °C Latitude °N Longitude °E Salinity
F1 28.5 7226 8.4 78.938 11.992 20.0
F2 9.5 1548 7.0 78.937 12.003 32.1
F3 19.6 1806 6.7 78.942 11.990 31.7
F4 6.6 12444 8.2 78.937 12.018 14.2
F5 19.7 1175 7.5 78.931 11.957 31.7
F6 47.1 5463 8.8 78.928 11.926 22.6
F7 15.5 52495 2.6 78.880 12.528 26.9
F8 10.3 4492 3.7 78.893 12.518 28.1
F9 4.6 3425 4.1 78.903 12.493 28.6
F10 4.5 5126 4.9 78.911 12.518 23.1
F11 60.1 15558 4.8 78.917 12.570 23.1
F12 6.8 3408 4.8 78.917 12.476 26.7
F13 27.8 3691 5.0 78.919 12.419 27.6
F14 6.9 2600 4.6 78.924 12.330 29.8
F15 5.6 1605 5.4 78.929 12.223 29.7
Table S-4 Dissolved (<0.2 µm) Fe and total dissolvable Fe for 28 randomly collected Kongsfjorden iceberg samples (July 2015).
Sample
label Origin Catchment DFe / nM TdFe / nM PFe (TdFe-DFe) /nM Ice 1 Ny Alesund, Svalbard,
Summer 2015 Kongsfjorden 19.2 261 242
Ice 2 Ny Alesund, Svalbard, Summer 2015
Kongsfjorden 9.5 97 87
Ice 3 Ny Alesund, Svalbard,
Summer 2015 Kongsfjorden 1.3 369 367
Ice 4 Ny Alesund, Svalbard, Summer 2015
Kongsfjorden 7.9 1013 1005
Ice 5 Ny Alesund, Svalbard,
Summer 2015 Kongsfjorden 4.9 331 326
Ice 6 Ny Alesund, Svalbard, Summer 2015
Kongsfjorden 0.6 133 133
Ice 7 Ny Alesund, Svalbard,
Summer 2015 Kongsfjorden 3.2 377 374
Ice 8 Ny Alesund, Svalbard, Summer 2015
Kongsfjorden 2.0 109 107
Ice 9 Ny Alesund, Svalbard,
Summer 2015 Kongsfjorden 2.1 54 52
Ice 10 Ny Alesund, Svalbard,
Summer 2015 Kongsfjorden 6.4 897 890
Sample
label Origin Catchment DFe / nM TdFe / nM PFe (TdFe-DFe) /nM Ice 11 Ny Alesund, Svalbard,
Summer 2015 Kongsfjorden 16.5 2274 2257
Ice 12 Ny Alesund, Svalbard,
Summer 2015 Kongsfjorden 6.6 470 464
Ice 13 Ny Alesund, Svalbard,
Summer 2015 Kongsfjorden 9.7 23259 23250
Ice 14 Ny Alesund, Svalbard,
Summer 2015 Kongsfjorden 8.8 221 213
Ice 15 Ny Alesund, Svalbard,
Summer 2015 Kongsfjorden 3.7 49 45
Ice 16 Ny Alesund, Svalbard,
Summer 2015 Kongsfjorden 3.9 59 55
Ice 17 Ny Alesund, Svalbard, Summer 2015
Kongsfjorden 11.1 62 51
Ice 18 Ny Alesund, Svalbard, Summer 2015
Kongsfjorden 9.5 46 37
Ice 19 Ny Alesund, Svalbard, Summer 2015
Kongsfjorden 12.4 65 53
Ice 20 Ny Alesund, Svalbard, Summer 2015
Kongsfjorden 5.4 79 73
Ice 21 Ny Alesund, Svalbard, Summer 2015
Kongsfjorden 536.3 57401 56864 Ice 22 Ny Alesund, Svalbard,
Summer 2015
Kongsfjorden 54.7 77 22
Ice 23 Ny Alesund, Svalbard, Summer 2015
Kongsfjorden 4.1 156 151
Ice 24 Ny Alesund, Svalbard, Summer 2015
Kongsfjorden 1.4 99 97
Ice 25 Ny Alesund, Svalbard, Summer 2015
Kongsfjorden 1.4 107 106
Ice 26 Ny Alesund, Svalbard, Summer 2015
Kongsfjorden 3.4 88 84
Ice 27 Ny Alesund, Svalbard,
Summer 2015 Kongsfjorden 16.5 830 814
Ice 28 Ny Alesund, Svalbard,
Summer 2015 Kongsfjorden 266.1 10876 10610
Supplementary Information References
edWards, r., sedWick, P. (2001) Iron in East Antarctic snow: Implications for atmospheric iron deposition and algal production in Antarctic waters. Geophysical Research Letters 28, 3907–3910.
raisWeLL, r., vu, H.P., Brinza, L., Benning, L.g. (2010) The determination of labile Fe in ferri- hydrite by ascorbic acid extraction: Methodology, dissolution kinetics and loss of solubility with age and de-watering. Chemical Geology 278, 70–79.
stookey, L.L. (1970) Ferrozine- a new spectrophotometric reagent for iron. Analytical Chemistry 42, 779–781.