Cognitive modelling reveals distinct electrophysiological markers of decision con fi dence and error monitoring
Manuel Rausch
a,*, Michael Zehetleitner
a, Marco Steinhauser
b, Martin E. Maier
baKatholische Universit€at Eichst€att-Ingolstadt, Fakult€at für Psychologie und P€adagogik, Professur für Allgemeine Psychologie II, Eichst€att, Germany
bKatholische Universit€at Eichst€att-Ingolstadt, Fakult€at für Psychologie und P€adagogik, Lehrstuhl für Allgemeine Psychologie, Eichst€att, Germany
A R T I C L E I N F O Keywords:
Metacognition Confidence
Event-related potentials Cognitive modelling ERN/Ne
Pe
A B S T R A C T
Is confidence in perceptual decisions generated by the same brain processes as decision itself, or does confidence require metacognitive processes following up on the decision? In a masked orientation task with varying stimulus- onset-asynchrony, we used EEG and cognitive modelling to trace the timing of the neural correlates of confidence.
Confidence reported by human observers increased with stimulus-onset-asynchrony in correct and to a lesser degree in incorrect trials, a pattern incompatible with established models of confidence. Electrophysiological activity was associated with confidence in two different time periods, namely 350–500 ms after stimulus onset and 250–350 ms after the response. Cognitive modelling revealed that only the activity following on the stimulus exhibited the same statistical regularities as confidence, while the statistical pattern of the activity following the response was incompatible with confidence. It is argued that electrophysiological markers of confidence and error awareness are at least in parts distinct.
1. Introduction
Decision confidence is a ubiquitous feature of human decision mak- ing: Whenever we make a choice, the decision is accompanied by a greater or smaller degree of confidence that the choice is correct. Con- fidence can be defined as an evaluation of one’s decision making, resulting in a degree of certainty that the decision is correct (Pouget et al., 2016). How does the brain give rise to confidence? Two conflicting views have been proposed: According to one view, confidence may be gener- ated directly by the very same brain processes that are involved in de- cision formation (Kepecs et al., 2008;Kiani and Shadlen, 2009;Rolls et al., 2010;Vickers, 1970). According to the second view, confidence is generated by a separate, metacognitive process that gives rise to both confidence and error awareness (Boldt and Yeung, 2015;Charles and Yeung, 2018). A common mechanism underlying error monitoring and decision confidence may be on-going accumulation of sensory evidence after the decision, allowing observers to reverse their belief about the stimulus (Pleskac and Busemeyer, 2010;Resulaj et al., 2009;Steinhauser et al., 2008;van den Berg et al., 2016).
The aim of the present study was to test if there are neural correlates of confidence in a perceptual decision already before the time of the behavioural response consistent with a common origin of confidence and
choice formation, or if these correlates do not emerge until the time of neural markers of error awareness following the response. For this pur- pose, the present study used cognitive modelling and electroencepha- lography to trace the timing of the neural correlates of confidence in perceptual decisions.
1.1. Event-related potential correlates of confidence
The present study examines three event-related potential (ERP) components that were previously proposed as correlates of confidence:
the P3 (Hillyard et al., 1971), the error-related negativity ERN (Scheffers and Coles, 2000), and the error-related positivity Pe (Boldt and Yeung, 2015). The P3 is an ERP component recorded over central and parietal electrodes peaking 300–500 ms after the presentation of a task-relevant stimulus. It is a natural candidate for a shared electrophysiological correlate of confidence and the decision because the parietal P3 was suggested as a marker of accumulated evidence in perceptual decision making tasks (O’Connell et al., 2012;Philiastides et al., 2014;Twomey et al., 2015). Previous studies showed that P3 amplitudes are correlated with confidence judgments (Eimer and Mazza, 2005; Hillyard et al., 1971). In addition, the P3 showed statistical properties expected from a Bayesian model of decision confidence in a vibrotactile forced-choice
* Corresponding author. Katholische Universit€at Eichst€att-Ingolstadt. Psychologie II, Ostenstraße 25, 85072, Eichst€att, Germany.
E-mail address:manuel.rausch@ku.de(M. Rausch).
Contents lists available atScienceDirect
NeuroImage
journal homepage:www.elsevier.com/locate/neuroimage
https://doi.org/10.1016/j.neuroimage.2020.116963
Received 13 January 2020; Received in revised form 5 May 2020; Accepted 14 May 2020 Available online 24 May 2020
1053-8119/©2020 The Authors. Published by Elsevier Inc. This is an open access article under the CC BY license (http://creativecommons.org/licenses/by/4.0/).
NeuroImage 218 (2020) 116963
task (Herding et al., 2019). However, a marker of accumulated evidence is by far not the only interpretation of the P3: According to a classical theory, the P3 reflects updating of working memory in response to task-relevant events (Donchin and Coles, 1988). Other theories include the global broadcast of visual contents within a neural global workspace (Sergent et al., 2005), the mobilization for action following motivation- ally significant stimuli (Nieuwenhuis et al., 2011), or a monitoring pro- cess if the decision is correctly transformed into an action (Verleger et al., 2005).
ERN and Pe are established makers of error processing: If one shared neurocognitive mechanism gives rise to both confidence and error monitoring, confidence should be associated with ERN and Pe. The ERN is an ERP component with frontocentral topography at the same time of shortly after incorrect responses (Falkenstein et al., 1991;Gehring et al., 1993). An equivalent yet smaller negativity referred to as CRN was observed after correct responses (Vidal et al., 2003). Previous studies suggested that the ERN was associated with participants’confidence judgments in aflanker task (Scheffers and Coles, 2000). However, the ERN failed to predict graded confidence judgments on a trial-to-trial basis in a visual discrimination task with brieflyflashed stimuli (Boldt and Yeung, 2015). Finally, the ERN can be dissociated from decision confi- dence by the relation with subjective visibility: In a masked number discrimination task, the ERN varied in an all-or-nothing way and was only present if there was a conscious percept of the stimulus, while confidence varied continuously and did not depend on a conscious percept of the stimulus (Charles et al., 2014,2013).
The Pe is a parietally focused positive deflection 200–500 ms after incorrect responses. The Pe is similar to the parietal P3 in terms of topography and latency although the Pe is locked to the response, and P3 to the stimulus (Overbeek et al., 2005). The Pe is a marker of conscious awareness of having committed an error (Nieuwenhuis et al., 2001) and can be dissociated from the ERN: In a study where participants responded to a masked target stimulus surrounded by visibleflanker stimuli, erro- neous responding to theflanker elicited only a Pe, but not an ERN (Di Gregorio et al., 2018). The Pe can be explained by the strength of accu- mulated evidence of having made an error (Steinhauser and Yeung, 2012,2010;Ullsperger et al., 2010;Wessel et al., 2011). Moreover, in a visual discrimination task, the Pe was associated with both confidence in correct responses as well as the subjective belief of having made an error in a gradual way (Boldt and Yeung, 2015). However, the timings of ERN and Pe are not immediately plausible for correlates of decision confi- dence. As it seems that confidence is experienced already at a point in time when no response has yet been made, correlates of confidence may naïvely be expected before the response, at the same time as the decision or shortly afterwards. And yet, ERN and Pe do not occur until after the response.
1.2. Statistical properties of decision confidence
How can hypothesized neural correlates of confidence be tested? If specific neural activity is a correlate of confidence, it must be associated with the same statistical regularities as confidence judgments (Kepecs et al., 2008;Sanders et al., 2016): By implication, if the statistical regu- larities of a specific ERP component are incompatible with those of confidence, that component is not a correlate of confidence. In the pre- sent study, we tracked the statistical regularities of confidence byfitting a series of cognitive models to the behavioural data. The model thatfitted the behaviour best was used to predict the neuronal data. Previous studies used the so-called folded X-pattern as a statistical marker of confidence (Braun et al., 2018;Fetsch et al., 2014;Herding et al., 2019;
Lak et al., 2017;Urai et al., 2017). The folded X-pattern is characterised by an increase of confidence with stimulus strength in correct trials and a decrease of confidence with stimulus strength in incorrect trials and was derived from Bayesian decision theory (Hangya et al., 2016;Sanders et al., 2016), but also follows from signal detection theory (Kepecs et al., 2008) or postdecisional accumulation models (Moran et al., 2015).
However, the folded X-pattern can be misleading about confidence because Bayesian decision theory is compatible with other statistical patterns, too (Adler and Ma, 2018;Rausch and Zehetleitner, 2019a). In addition, in some tasks, confidence empirically increased with stimulus strength in correct trials and to a lesser degree in incorrect trials (Kiani et al., 2014;Rausch et al., 2018;Stolyarova et al., 2019;van den Berg et al., 2016), a pattern we refer to as double increase pattern. The double increase pattern can be reproduced by a smaller number of mathematical models, including the weighted evidence and visibility (WEV) model (Rausch et al., 2018), the heuristic detection model (Maniscalco et al., 2016;Peters et al., 2017), and some Bayesian models (Adler and Ma, 2018; Rausch and Zehetleitner, 2019a). For these reasons, it is not legitimate to assume a specific statistical pattern a priori. However, irrespective of whether confidence follows the folded-X or double in- crease pattern in a specific task, a neural correlate of confidence should always show the same pattern as the one observed with confidence judgments. In addition, a cognitive modelfitted to confidence judgments should also be able to accurately predict the neural correlate of confidence.
1.3. Rationale of the present study
To assess the timing of the neural correlates of confidence in perceptual decisions, human observers performed a masked orientation discrimination task (seeFig. 1) while EEG was recorded. After each single response, observers reported their confidence on a scale with the cate- gories,“not at all”,“a little”,“nearly sure”, and“completely sure”. In case observers were aware of an incorrect response, observers were instructed to respond,“not at all”. We used a task where confidence followed the double increase pattern in previous studies (Rausch et al., 2018), because the double increase pattern can be explained by a smaller number of cognitive models. The strength of stimulation was manipulated by varying the stimulus-onset-asynchrony (SOA), i.e. the time between onset of the stimulus and the mask. Bayes factors were used for statistical inference, allowing us to quantify both the evidence for an effect as well as evidence against an effect (Rouder et al., 2009).
To trace the statistical regularities underlying confidence, wefitted nine previously proposed models of decision confidence to confidence judgements, including.
- SDT (Green and Swets, 1966; Macmillan and Creelman, 2005;
Wickens, 2002)
- SDT with noise superimposed on ratings (Maniscalco and Lau, 2016) - SDT model with postdecisional accumulation (Barrett et al., 2013) - the two-dimensional Bayesian model (Aitchison et al., 2015) - the noisy decay model (Maniscalco and Lau, 2016)
- the detection heuristic model (Peters et al., 2017) - the two high-threshold model (Kellen and Klauer, 2015) - the two channel model (Rausch and Zehetleitner, 2017) - the WEV-model (Rausch et al., 2018).
Because the objective of the present study was specifically confi- dence, we selected models from the literature that arefitted directly to confidence judgments, and not to reaction times. From the model pa- rameters thatfitted the behavioural data best, we generated a prediction about the ERP amplitudes.
The present study was designed to test the following predictions: With respect to confidence judgments, we expected that confidence increases as a function of the SOA both in correct as well as in incorrect trials, i.e.
confidence is characterised by the double increase pattern. Regarding proposed ERP correlates of confidence, as correct responses are commonly associated with more positive activity at the time of the P3 (Koivisto and Revonsuo, 2010), we hypothesized that confidence is positively associated with EEG activity at the time of the P3. As errors are known to cause negative shifts at the time of the ERN, again a positive association was expected between confidence and activity at the time of
the ERN (Scheffers and Coles, 2000). In contrast, as errors are known to cause positive shifts at the time of the Pe, we predicted a negative as- sociation between confidence and activity at the time of the Pe in line with previous research (Boldt and Yeung, 2015). Moreover, if P3, ERN, and Pe were indeed correlates of confidence, the statistical pattern as a function of SOA and choice accuracy should correspond to the statistical pattern observed in confidence judgments: This means that P3, ERN, and Pe should be characterised by the double increase pattern as well.
Regarding cognitive models, we expected that the bestfit to the behav- ioural data should be achieved by one of the models that is in principle able to accommodate the double increase pattern, i.e. the WEV-model, the heuristic detection model, or the noisy decay model. Finally, the models that provide an adequatefit to the behavioural data should also accurately predict the ERP correlates of confidence.
2. Material and methods 2.1. Participants
25 human participants (21 female, 4 male) took part in the experi- ment. The age of the participants ranged between 18 and 36 years (Md¼ 22). All participants reported normal or corrected-to-normal vision, no history of neuropsychological or psychiatric disorders and not to be on psycho-active medication. All participants gave written informed consent and received either course credits or€8 per hour for participation. The experimental protocol was approved by the ethics committee of the Catholic University of Eichst€att-Ingolstadt.
2.2. Apparatus and stimuli
The experiment was performed a sound-attenuated and electrically shielded cabin. The stimuli were presented on an Iiyama MS103DT monitor with screen diagonal of 51 cm, set at a resolution of 12801024 px and refresh rate of 60 Hz. The viewing distance, not enforced by constraints, was approximately 60 cm. The experiment was conducted using PsychoPy v. 1.83.04 (Peirce, 2009, 2007) on a Fujitsu Celsius W530 desktop computer with Windows 8.1. The target stimulus was a square (size 3 3), textured with a sinusoidal grating with one cycle per degree of visual angle (maximal luminance: 44 cd/m2; minimal luminance: 14 cd/m2). The mask consisted of a square (4 4) with a black (0 cd/m2) and white (60 cd/m2) chequered pattern consisting of 5 columns and rows. All stimuli were presented atfixation in front of a grey (29 cd/m2) background. The orientation of the grating varied randomly between horizontal or vertical. Participants reported the
orientation of the grating with their right hands by pressing the down key when the grating was vertical and the right key when the grating was horizontal. Likewise, participants reported their confidence in being correct with their left hands by pressing one, two, three, or four on the number keys in top row of the keyboard.
2.3. Experimental trial
Each trial began with the presentation of afixation cross for a dura- tion randomly chosen between 950, 1000, and 1050 ms, after which the target stimulus appeared. The duration of thefixation cross and thus the onset of the target stimulus was varied to minimize preparatory EEG activity before the onset of the target. Then the target stimulus was shown for a short period of time until it was replaced by the masking stimulus. There were four different possible SOAs, i.e. time periods be- tween target onset and mask onset: 16.7, 33.3, 66.7 and 133.3 ms. The mask was presented for 500 ms. When the mask had disappeared, an empty screen was shown. Participants then indicated whether the target had been horizontal or vertical. The question“How confident are you about your response?”with the four response options“not at all”,“a little”,“nearly sure”, and“completely sure”was displayed 500 ms after the response to ensure that the confidence scale did not interfere with ERN and Pe. Participants then pressed a key to indicate their degree of confidence that their orientation response was correct. If participants had indicated the incorrect orientation of the target, the worderrorwas dis- played for 1000 ms before the trial ended.
2.4. Design and procedure
Participants were instructed to report the orientation of the grating as accurately as possible without time pressure and to guess the orientation of the target if they had no idea about the orientation at all. In addition, they were instructed that they should report their degree of confidence that their orientation response had been correct, they should report their confidence as accurately as possible and that if they were aware that they had made an error, they should rate their degree of confidence as“not at all”.
The experiment consisted of one training block and 24 experimental blocks of 40 trials each. Each SOA featured 10 times in each block in random order. The orientation of the target stimulus varied randomly across trials. After each block, the percentage of errors was displayed to provide participants with feedback about their accuracy. The whole experimental session took approximately 1.5 h.
Fig. 1.Sequence of events during the Experiment. The target stimulus was a sinusoidal grating, oriented horizontally or vertically. After 16.7, 33.3, 66.7, 133.3 ms, the target was replaced by a chequered mask presented for 500 ms. Afterwards, observers reportedfirst the orientation of the target and then their degree of con- fidence in having made the correct orientation response. Observers were instructed that accuracy but not speed was critical for both responses.
2.5. EEG acquisition
The electroencephalogram (EEG) was recorded from 64 electrodes using a BIOSEMI Active-Two system (BioSemi, Amsterdam, Netherlands;
Ag/AgCl electrodes, channels Fp1, AF7, AF3, F1, F3, F5, F7, FT7, FC5, FC3, FC1, C1, C3, C5, T7, TP7, CP5, CP3, CP1, P1, P3, P5, P7, P9, PO7, PO3, O1, Iz, Oz, POz, Pz, CPz, Fpz, Fp2, AF8, AF4, AFz, Fz, F2, F4, F6, F8, FT8, FC6, FC4, FC2, FCz, Cz, C2, C4, C6, T8, TP8, CP6, CP4, CP2, P2, P4, P6, P8, P10, PO8, PO4, O2 as well as the left and right mastoid, relative to common mode sense CMS active electrode and driven right leg DR pas- sive electrode). Vertical and horizontal electrooculogram (EOG) was recorded from electrodes above and below the right eye and on the outer canthi of both eyes. All electrodes were off-line re-referenced to linked mastoids. EEG and EOG data were continuously recorded at a sampling rate of 512 Hz.
2.6. EEG analysis
The analysis of the EEG data was performed using MNE-Python v.
0.16.1 (Gramfort et al., 2014,2013). First, the data was re-referenced to the linked mastoids. Next, the signal was band-passfiltered between 0.5 and 40 Hz by windowedfinite impulse responsefiltering. The raw data was inspected visually to remove extreme noise events and artefact-contaminated electrodes. Then, we conducted an independent component analysis based on the fastica algorithm (Hyv€arinen, 1999), identifying components representing blinks and/or horizontal eye movements and removing these artefacts before back-projection of the residual components.
The continuous EEG was segmented into two different kinds of epochs, one of which locked to the onset of the target stimulus, and one locked to the orientation response. Stimulus-locked epochs started 200 ms before stimulus onset, ended 600 ms after stimulus onset and were baseline-corrected to the 200 ms pre-stimulus interval. Response-locked epochs started 200 ms before the orientation response, ended 600 ms after the response, and were baseline-corrected to the time range be- tween 150 and 50 ms before the response. The baseline for the response- locked time windows was chosen to avoid an overlap between baseline and ERN because sometimes ERN activity starts slightly prior to the completion of the motor response (Riesel et al., 2013). Epochs with amplitude changes greater than 100μV were excluded from analysis, the same exclusion criterion as in a previous study of EEG correlates of confidence (Boldt and Yeung, 2015). Finally, ERP waveforms were ob- tained by averaging across epochs (but not for the validation of the prediction by the cognitive models, see below). EEG activity in specific time windows was quantified by calculating mean amplitudes because mean amplitudes are robust to different numbers of trials across condi- tions (Luck, 2014). The time windows were 350–500 ms poststimulus at electrode Pz for the P3, -40–60 ms after the orientation discrimination response at electrode FCz for the ERN, and 250–350 ms after the orien- tation discrimination response at electrode Pz for the Pe, the same time windows as in a previous study of EEG correlates of confidence (Boldt and Yeung, 2015). The time window of 350–500 after stimulus onset excluded the point in time when participants responded to the orienta- tion of the stimulus (reaction time at the SOA of 133.3 ms:M¼624.6 ms, at the SOA of 16.7 ms:M¼1001.0 ms). As can be seen fromFig 5L, the Pe in the present study seemed to stretch over a more prolonged time window than 250–350 ms postresponse. For this reason, we repeated all analyses using a time window of 200–500 ms postresponse, which came to the same interpretation of the data. After artefact rejection, there were on average M ¼ 816.3 stimulus-locked epochs and M ¼ 800.0 response-locked epochs per participant. In the condition with the smallest number of trials (incorrect trials at the SOA of 133.3 ms), there were on average 10.1 trials. To create topographical maps, artefact-contaminated electrodes that were excluded in the beginning were interpolated using spherical splines (Perrin et al., 1989).
2.7. Model specification
Nine models werefitted to the combined distributions of orientation discrimination and confidence judgments, separately for each single participant.
i. SDT
ii. SDT with noise superimposed on ratings iii. Noisy decay model
iv. WEV-model v. Two channel model
vi. SDT model with postdecisional accumulation vii. Detection heuristic model
viii. Two-dimensional Bayesian model ix. Two high-threshold model
For all nine models, we assumed that the stimulation is comprised out of two experimental variables, the identity of the stimulusSidand the strength of the stimulusSs. Participants select a discrimination response Rid2 f0;1gabout the identity of the stimulusSid2 f0;1gand confidence judgment out of an ordered set of confidence categoriesC2 f1;2;3;4g.
Models (i)-(vi) were derived from SDT and assumed the same architec- ture for the choice about the identity of the stimulus. In contrast, models (vii)-(ix) were based on different decision architectures.
2.7.1. SDT derived models
Models (i) -(vi) assumed that a decision about the identity of the stimulus is made based on a comparison between a continuous decision variable for the discrimination judgment δid with the free criterion parameterθid. Participants respondedR¼0, whenδid<θid, andR¼1 if δid>θid.The decision variable for the discrimination judgmentδidwas modelled as a random sample from a Gaussian distributionN: δideNðμ¼ ðSid1=2Þ Ss;σ¼σidÞ (1)
The stimulus strengthSswas a free parameter specific to each SOA.
WhenSid ¼0, the distribution ofδidwas shifted to the left by the distance ofSs=2. WhenSid ¼1, the distribution is shifted by the same distance to the right. Thus,Ssdenotes the distance of the distributions generated by the two possible identities of the stimulus and is in this respect equivalent to the sensitivity parameter d’in standard SDT. Concerning the standard deviationσid, modelfitting was repeated using two different assumptions aboutσidto ensure that the results were robust. For thefirst set of ana- lyses,σidwasfixed at 1 for both identities of the stimulus, thus the free parameterSsfully accounted for each participant’s d’at each SOA. For the second set of analyses,σidcould vary depending onSid:An additional free parameterλcharacterised the relationship between the variability of δidassociated the two possible identities of the stimulus.
σid0¼λ
σid1¼1=λ (2)
A specific degree of confidence was determined by comparing the decision variable for confidenceδcagainst a set of three criteriaθc. Each criterion delineated between two adjacent categories of confidence, e.g.
participants selected the category 2 ifδc fell betweenθc1 (which sepa- rated category 1 and 2) andθc2(which separated category 2 and 3). To be consistent with standard SDT, wefitted three different criteria for each of the two response options. The different models were characterised by different ways howδcwas determined.
2.7.1.1. SDT rating model.According to model (i), the decision variables for identification and confidence were identical:
δc¼δid (3)
2.7.1.2. Noisy SDT model. According to model (ii),δcwas sampled from
a Gaussian distribution, with a mean equal to the decision variableδid
and the standard deviationσc, which was an additional free parameter:
δceNðμ¼δid;σ¼σcÞ (4)
2.7.1.3. Noisy decay model. According to model (iii), δc was also sampled from a Gaussian distribution with the standard deviationσc. Just as in the noisy SDT model, the mean ofδcdepended onδid. However, in contrast to the noisy SDT model, according to the noisy decay model, δidwas reduced by multiplication with a signal reduction parameterρS. The signal reduction parameterρSwas a separate free parameter for each SOA and was bounded between 0 and 1.
δceNðμ¼δidρs;σ¼σcÞ (5)
2.7.1.4. WEV model. The conceptual idea underlying the WEV-model is that the observer combine evidence about the choice-relevant feature of the stimulus with strength of evidence about choice-irrelevant features to select one out of several confidence categories (Rausch et al., 2018;
Rausch and Zehetleitner, 2019b). Evidence about choice-irrelevant fea- tures of the stimulus can improve confidence judgment because they allow the observer to estimate the reliability of the percept more pre- cisely. A possible neural mechanism may involve posterior parietal cortex and ventral striatum, which were found to track sensory reliability independently of the choice (Bang and Fleming, 2018).
The express this idea in formal terms, the WEV model assumed thatδc
was again sampled from a Gaussian distribution with the standard de- viationσc:
δceNðμ¼ ð1wÞ δidþw ð2Rid1Þ ðSsSsÞ;σ¼σcÞ (6) Formula (6)ensured that the centre of the distribution was shifted towards 0 when the strength of stimulationSswas low and away from 0 whenSswas high. The parameterw captured the degree to which participants relied on sensory evidence about the identity or on identity- irrelevant evidence when they determined their degree of confidence.
Whenw¼0, the model was identical to the noisy SDT model; whenw¼ 1,δconly depended on the strength of stimulationSs, but not on the decision variable for the identification judgmentδid. The term 2Rid1 ensured that strong stimuli tended to shift the location of the distribution in a way that high confidence was more likely, and likewise, weak stimuli tended to shift the location of the distribution in a way that the proba- bility of low confidence increased.Ssdenotes the mean ofSsacross the five SOAs and was added to the formulae to increase stability during parameterfitting. The standard deviationσc quantifies the amount of unsystematic variability contributing to confidence judgments but not to identification judgments. The unsystematic variability may stem from different sources, including the uncertainty in the estimate of stimulus strength or the noise inherent to metacognitive processes.
2.7.1.5. Two-channel model. The two-channel represents the idea that confidence is based on sensory evidence independent from the sensory evidence used for the decision. Thus, for the two-channel model,δcwas again sampled from a Gaussian distribution, but nowδc was sampled independently fromδid:
δceNðμ¼ ðSid1=2Þ Ssa; σ¼1Þ (7)
The free parameteraexpressed the fraction of signal available to the second channel relative to the signal available to thefirst channel.
2.7.1.6. SDT model with postdecisional evidence. According to model (vi), the,δcwas again sampled from a Gaussian distribution:
δceN
μ¼δidþ ð2Sid1Þ Ssb;σ¼pffiffiffib
(8) The free parameter b indicated the amount of postdecisional
accumulation, and the term 2Sid1 ensured that postdecisional accu- mulation tended to decreaseδcwhenSid ¼0, and to increaseδc when Sid ¼1.
2.7.2. Non-SDT models
Model (vii)-(ix) assumed a different decision architecture for the identification judgment than models (i)-(vi).
2.7.2.1. Detection heuristic model. According to model (vii), there were two separate decision variables for the identification judgment, each belonging to one possible identity of the stimulus:
δid0eNðμ¼ ð1SidÞ Ssb;σ¼σidÞ
δid1eNðμ¼SidSsþb;σ¼σidÞ (9)
The parameterbreflected the a priori bias in favour ofRid ¼1. Par- ticipants were assumed to respondRid ¼0, whenδid0>δid1, andRid¼1 if δid0<δid1. Confidence judgments were only based on the decision variable pertaining to the selected response: When Rid ¼ 0,δid0 was compared against a series of confidence criteriaθc0to select a specific degree of confidence; and whenRid ¼1, the comparison was based on δid1as well as a second set of criteriaθc1:The bias parameter b was not included in the original version of the model (Peters et al., 2017), but we included it here because there was strong evidence that the free bias parameter improved modelfit of the detection heuristic model.
2.7.2.2. 2-D Bayesian model. According to model (viii), there were again two separate decision variables,δid0 and δid1; referred to as ‘sensory signals’byAitchinson et al. (2015), each referring to one of the two possible identities of the stimulus:
δid0eNðμ¼ ð1SidÞ δt;σ¼sÞ
δid1eNðμ¼Sidδt;σ¼ sÞ (10)
Δt denotes the physical SOA in seconds and s is a free noise param- eter. The model assumed that the observer’s choices about the identity of the stimulus and about the visibility depended on the posterior proba- bility of the identity of the stimulus given the decision variables PðSidjδid0; δid1Þ:
PðSid¼1jδid0;δid1Þ ¼ P
tPðδid0jΔt¼t;s;Sid¼1ÞPðδid1jΔt¼t ;s; Sid¼1Þ P
t;iPðδid0jΔt¼t;s;Sid¼iÞPðδid1jΔt¼t;s; Sid¼iÞ (11) A specific identity and degree of visibility were chosen by comparing the posterior probability PðSid¼1jδid0;δid1Þagainst a set of criteriaθ. It was assumed that the possible identities and degrees of visibility formed an ordered set of decision options. Each criterion delineated two adjacent decision options, e.g. participants chose to respond that the identity was 1 and visibility was 1 if PðSid¼1jδid0;δid1Þwas smaller than the criterion associated with identity 1 and visibility 2, and at the same time PðSid¼1jδid0;δid1Þwas greater than the criterion for identity 0 and visi- bility 1. Finally, it was assumed that observers did not always give the same response as they intended to. When a lapse occurred, identification and visibility responses were assumed to be random with equal proba- bilities. The lapse rateλwas an additional free parameter.
2.7.2.3. Two high thresholds model. Model (ix), the two high thresholds model, assumed that the decision variable for the identification judgment δidwas not continuous, but categoricalδid2 f0;0:5;1g: Observer could either detect the identity of the stimulus and choose the response accordinglyRid ¼0ifδid ¼0, andRid¼1ifδid¼1. Alternatively, ob- servers could be in a state of uncertainty,δid ¼0:5, in which no infor- mation about the identity was available, and observers responded by random guessing. The probability to detect the identity of the stimulus depended on thefive SOAs as well as on the identity of the stimulus, resulting in a total of ten detection parameters pðδid¼ SidjSs;SidÞ. A guessing parametergdetermined the probability with which observers
respondedRid¼1 when they were in the state of uncertainty. A specific degree of confidence was sampled randomly depending on the three possible states ofδidand the responseRid:As the response wasfixed when observers detected the identity, there were four different sets of proba- bilities to determine confidence judgmentspðC¼cjδid¼0Þ,pðC¼cjδid¼ 1),pðC¼cjδid¼0:5;Rid¼0Þ, andpðC¼cjδid¼0:5;Rid¼1Þ. Allpðδid¼ SidjSs;SidÞ,pðC¼cjδid;RidÞandgwere free parameters.
2.8. Modelfitting
The nine models werefitted to the combined distributions of orien- tation discrimination and confidence judgments separately for each sin- gle participant. First, the frequency of each confidence category was counted for each orientation of the stimulus and each orientation response. Then, for each model, the set of parameters was determined that minimized the negative log-likelihood. For models (i)-(vii) and (ix), the likelihood was calculated analytically (seeSupplementary Tables S1 and S2). Only for the 2-D Bayesian model, the likelihood was approxi- mated by simulation. Minimization was performed using a general SIMPLEX minimization routine (Nelder and Mead, 1965). To quantify the goodness-offit of the nine models, we calculated BIC (Schwarz, 1978) and AICc (Burnham and Anderson, 2002), a variant of the Akaike in- formation criterion (Akaike, 1974) using the negative likelihood of each modelfit with respect to each single participant and the trial number.
2.9. Predictions of ERP amplitudes
Predictions about mean ERP amplitudes in the time windows of P3, ERN, and Pe were generated from model fits using the following computational steps:
- First, the statistical models were used to calculate the probabilities of all four confidence categories depending on SOA and choice accuracy separately for each participant using the parameter sets obtained during modelfitting of the behavioural data and the formulae in Supplementary Table S1.
- Then, an optimization procedure was used to obtain a transformation to convert each confidence category into an EEG amplitude separately for each participant (see below for details). As result, one specific value of EEG amplitude was assigned to each confidence category.
- The statistical models provided us with probabilities of each confi- dence category given SOA and accuracy.To obtain an estimate of mean ERP amplitude on the level of single trials, the expected ERP amplitude was calculated by averaging EEG amplitudes assigned to the four different confidence categories weighted by the probability of each confidence category as a function of SOA and accuracy.
- Finally, the correlations across trials between predicted and observed ERP amplitudes were assessed separately for each participant.
Concerning the transformation of confidence into EEG amplitudes, simplex minimization of sum-of-squares with respect to single-trial ERP amplitudes was used to determine the parameters of the transformation.
There were to two separate runs of the analysis, one of which assumed a linear transformation and one a monotonous transformation. The linear transformation involved two free parameters, intercept and slope. The monotonous transformation involved four free parameters, one for each confidence categories, each parameter specifying the expected ERP amplitude. These four parameters were constraint by the optimization algorithm to ensure that the expected ERP amplitude was either monotonously increasing or decreasing with confidence.
2.10. Statistical analysis
All statistical tests were based on Bayes factors (Rouder et al., 2009), as implemented in the R packageBayesFactor(Morey and Rouder, 2015).
To test if an ERP component was related to confidence or SOA, we used a
Bayesian linear mixed regression model with confidence or SOA asfixed effect and a random effect of participant on the intercept, using default mixture-of-variance priors and a scale parameter of r¼1/2 (Rouder and Morey, 2012). Conceptually, the prior represents the a priori belief that smaller regression slopes are more plausible than large slopes, while even very large slopes were not deemed impossible. Each Bayes factor repre- sents a comparison between the full regression model and a regression model with only the random effect of participant. To comparefits be- tween models of confidence, the Bayesian equivalent of a pairedt-test was used, assuming a Cauchy distribution with a scale parameter of 1 as prior for the standardized effect sizeδ, a choice recommended as default (Rouder et al., 2009). The strength of statistical evidence was interpreted according to an established guideline (Lee and Wagenmakers, 2013). In addition, we constructed 95% HDI intervals of the regression slopes or mean differences by 106samples from the posterior distribution using the same models and priors as for Bayes factors.
Concerningfigures, error bars and ribbons were based on within- subject standard errors of mean corrected for the number of within- subject conditions (Morey, 2008).
2.11. Data and code availability
The computer programme for the experiment, the behavioural and EEG data, and all analysis scripts to reproduce all results reported in the present paper are freely available at the Open Science Framework web- site (https://osf.io/93weg).
3. Results
3.1. Behavioural results
Discrimination performance of the orientation ranged between chance at the shortest SOA (M¼50.8%,SD¼2.6) and close-to-ceiling at the longest SOA (M¼94.8%,SD¼8.5, seeFig. 2A). Confidence ranged betweenM¼1.6 (SD¼0.6) on a four-point scale at the shortest SOA and M¼3.7 (SD¼0.4) at the longest SOA.Fig. 2B shows that confidence was characterised by an increase with SOA in correct as well as in incorrect trials. The evidence for the increase with SOA was extremely strong for correct trials, 95% HDI [0.016 0.020] scale steps/ms,BF10¼1.3∙1024, and strong for incorrect trials, 95% HDI [0.002 0.007] scale points/ms, BF10¼23.7.Supplementary Fig. S1shows that at the shortest SOA, the two larger confidence categories represented only a small fraction of trials, while at the longest SOA, there was only small fraction of trials with the two smaller confidence categories.
3.2. ERP results
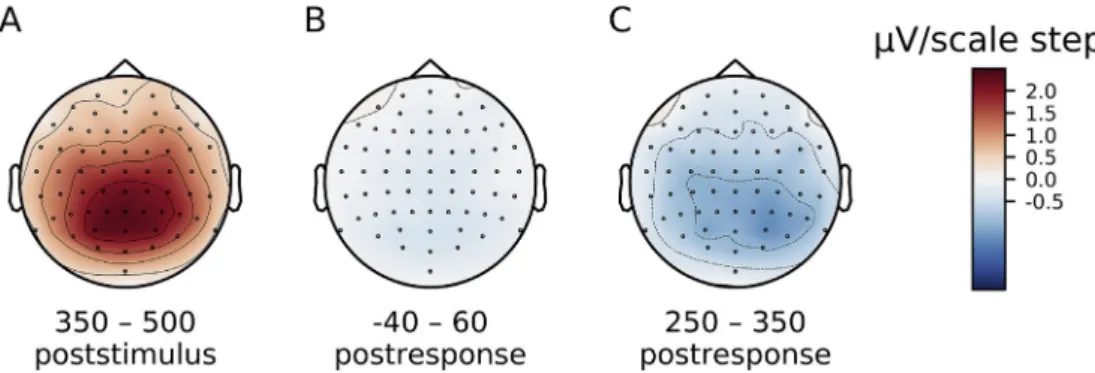
The effects of confidence were examined in correct trials during the time windows of the three candidate correlates of confidence: P3, ERN, and Pe. Consistent with our prediction, there was extremely strong evi- dence that EEG activity in the P3 time range (350–500 ms after onset of the target stimulus, recorded at the parietal electrode Pz) increased with confidence, 95% HDI [1.8 2.9] μV/scale step, BF10 ¼ 3.6∙1010 (see Fig. 3A).Fig. 4A shows that the association between ERPs and confidence in correct trials during the P3 time window had a centroparietal distri- bution over the scalp, consistent with known topographies of the P3 in difficult perceptual discrimination tasks (Koivisto and Revonsuo, 2010).
The analyses if confidence judgments predict EEG activity at the time of the P3 separately for each SOA were not conclusive about an effect of confidence for three out of four SOAs, 1.01<BF10<2.53, and there was moderate evidence against an effect at the SOA of 66.7 ms, BF10¼0.30.
Fig. 3B shows the effect of confidence in correct trials during the ERN time window (-40–60 ms after the orientation response, at the fronto- central electrode FCz). The evidence for an effect of confidence was not conclusive, 95% HDI [-0.6 0.1]μV/scale step,BF10¼0.45. However, although a positive relation between confidence and ERN would have
been expected, the trend was in the opposite direction. As shown by Fig. 4B, no clear effect of confidence emerged anywhere over the scalp at the time of the ERN. Finally,Fig. 3C shows the effect of confidence in correct trials during the Pe time window (250–350 ms after the orien- tation response, at Pz). In line with our prediction, there was strong ev- idence that confidence was negatively associated with the ERP at the time of the Pe, 95% HDI [-1.8–0.5]μV/scale step,BF10¼60.6. As can be seen fromFig. 4C, the association between ERPs and confidence in cor- rect trials during the Pe time window had a posterior parietal distribution over the scalp, consistent with known topographies of the Pe (Boldt and Yeung, 2015).
Next, we tested if P3, ERN and Pe are markers of confidence by comparing the effects of SOA on confidence judgments and on ERPs, separately for correct and incorrect trials. Consistent with the pattern of confidence judgments, there was extremely strong evidence that the ERP in the P3 range increased with SOA in correct trials, 95% HDI [0.08 0.10]
μV/ms,BF10¼1.8∙1025, as well as in incorrect trials, 95% HDI [0.04 0.08]μV/ms,BF10¼1.2∙107(seeFig. 5A–D, see alsoFigs. 7 and 8). In the ERN range,Fig. 5H shows that the strongest effect at the time of the ERN was a negative shift in incorrect trials at the longest SOA. The effect of SOA in incorrect trials was in the opposite direction as the pattern of confidence judgments: the evidence was extremely strong for a negative, Fig. 2.(A) Accuracy in the orientation discrimination task depending on stimulus-onset-asynchrony. B): Decision confidence as a function of stimulus-onset- asynchrony in correct (blue symbols) and incorrect trials (red). Bars and symbols indicate observed means. Error bars indicate 1 within-subjectSEM.
Fig. 3.Event-related potentials in correct trials as a function of confidence judgments. (A) Activity at the parietal electrode Pz locked to the onset of the target stimulus. The box highlights the range of the P3 time window. The ERP is locked to the onset of the target stimulus. (B) Activity at the frontocentral electrode FCz locked to the orientation response. The box highlights the time range of the ERN. (C) Activity at Pz locked to the orientation response. The box highlights the time range of the Pe. Colours indicate the degree of confidence reported by the observers. Ribbons indicate1 within-subjectSEMaround the mean.
not positive shift, 95% HDI [-0.04–0.01] μV/ms,BF10 ¼ 164.5. The evidence with respect to an effect on correct trials was not conclusive, Fig. 4.Distribution of the association between ERPs and confidence in correct trials across the scalp. Maps are based on regression slopes with ERP amplitudes as a function of confidence (A) Time window 350–500 ms after target stimulus onset. (B) Time window between 40 ms before the orientation response and 60 ms after the response. (C) Time window 250–350 ms after the response.
Fig. 5. Event-related potentials as a function of stimulus-onset-asynchrony (different columns) and accuracy of the orientation response (blue: correct responses; red:
incorrect responses). (A–D) ERP activity locked to target stimulus onset, recorded at Pz. The box highlights the time window of the P3 (350–500 ms poststimulus).
(E–H) ERP activity locked to the orientation response, recorded at FCz. The box highlights the time window of the ERN (-40–60 ms postresponse). (I–L) ERP activity locked to the orientation response, recorded at Pz. The box highlights the time window of the Pe (250–350 ms postresponse). Ribbons indicate1 within-subjectSEM around the mean.
95% HDI [-0.01 0.00]μV/ms,BF10¼2.9.Fig. 5I-L shows that the EEG activities in correct and incorrect trials at the time of the Pe seemed to diverge from each other with increasing SOA, i.e. the Pe seemed to follow the folded X-pattern. This is inconsistent with double increase pattern of confidence judgments, as confidence had increased with SOA in both correct and incorrect trials. As EEG activity at the time of the Pe is negatively associated with confidence, the pattern of confidence judg- ments implied a negative shift with SOA in both correct and incorrect trials. In accordance with the pattern of confidence judgments, there was extremely strong evidence for the negative shift with increasing SOA in correct trials, 95% HDI [-0.05–0.03]μV/ms,BF10¼7.6∙107. However, although the pattern of confidence judgments implied a negative shift with increasing SOA in incorrect trials as well, there was moderate evi- dence against a relationship between SOA and ERPs in incorrect trials at the time of the Pe, 95% HDI [-0.01 0.03]μV/ms,BF10¼0.29.
3.3. Cognitive modelling
3.3.1. Modelling confidence judgments
Fig. 6shows confidence judgments as a function of SOA and choice accuracy compared to the model prediction based on parameter sets identified duringfitting. The WEV-model, the noisy decay model, the detection heuristic model and the 2-D Bayesian model correctly pre- dicted that confidence in incorrect trials increases with SOA,BF1092.4 (Fig. 6, A, E, H, I). The SDT-model, the SDT-model with postdecisional evidence, the noisy SDT model, and the two-channel model produced a decreasing relationship instead (Fig. 6B, C, D, G),BF103.31015. For the two high-threshold model, the relationship between SOA and pre- dicted confidence in incorrect trials appeared to beflat, but the evidence was not conclusive,BF10¼0.39.
Quantifying modelfit using the Akaike information criterion (AICc) and the Bayes information criterion (BIC) showed that the bestfit to the data was obtained by the WEV-model, followed by the noisy decay model (Fig. 7). Regarding AICc, the evidence if the WEV model performed better than the noisy decay model was not conclusive,MΔAIC¼8.9, 95% HDI [-4.9, 21.6],BF10¼0.35, but there was very strong evidence that the WEV-model performed better than the two-high-thresholds-model, MΔAIC ¼99.4, 95% HDI [42.7.146.7], BF10¼ 43.4, and extreme evi- dence that the WEV-model performed better than each of the other models,MΔAIC34.2,BF10101.3. Regarding BIC, there was moderate evidence that the WEV-model performed better than the detection heu- ristic model,MΔBIC¼24.6, 95% HDI [7.1, 39.4],BF10¼6.8, strong ev- idence that the WEV-model was better than the noisy decay model,MΔBIC
¼23.3, 95% HDI [8.5, 35.8],BF10¼16.5, and extreme evidence that the WEV model was better than each of the otherfive models,MΔAIC34.2, BF10 101.3. These results were essentially the same when it was assumed that the variances of the decision variable differed between horizontal or vertical stimuli. Summary statistics of thefitted parameters of the WEV model can be found in theSupplementary Table S3.
3.3.2. Model classification analysis
To investigate if one of the other models could have been mis- classified as WEV-model, a simulation was performed based on the second-best and the third-best performing model, i.e. the noisy decay model and the heuristic detection model. For each participant, we used the parameter sets determined based on the empirical data to simulate the same number of trials as in the real experiment. Then, both the known generative model and the WEV model werefitted to the simulated data of each participant and compared using AICcand BIC. When model fits of the WEV model were compared withfits of the detection heuristic
Fig. 6.Mean confidence judgments depending on stimulus-onset-asynchrony (x-Axis) and accuracy of the orientation response. Different panels show the prediction of the different models based on the sets of parameters identified during modelfitting, assuming constant variances of the decision variable. Blue lines indicate the prediction for correct trials, red lines for incorrect trials. Ribbons indicate1 within-subjectSEMsaround the predicted mean confidence. Circles indicate observed confidence judgments in correct trials, and triangles in incorrect trials. Error bars¼1 within-subjectSEM.
model based on data that conforms to the detection heuristic model, AICc-differences indicated the correct model for 83.3% of the simulated data sets, while BIC-differences indicated the correct model for each single data set (seeSupplementary Fig. S2). When modelfits of the WEV model were compared withfits of the noisy decay model based on data
generated according to the noisy decay model, AICc-differences indicated the correct model for 95.8% of the data sets, while BIC-differences indicated the correct model for 75.0% data sets. It should be noted that the present study compared AICc and BIC differences averaged across participants, which is why it is not necessary that model classification is Fig. 7.Formal model comparisons. The different panels depict the frequency of AICc- and BIC differences when the WEV model was compared to each of the seven other models, assuming constant variances of the decision variable. AICc and BIC differences were assorted into categories based on established guidelines for interpretation.
100%, it is merely required that model classification accuracy is mark- edly above 50%.
3.3.3. Predicting ERPs from modelfits
Based on parameter sets of the WEV-model obtained byfitting the behavioural data, we determined expected ERP amplitudes at the time of P3, ERN, and Pe as a function of SOA and choice accuracy. First, a simple linear transformation was applied to confidence with parameters of the transformation determined based on the EEG data.Fig. 8A shows that the linear transformation of predicted confidence resulted in a reasonably accurate prediction regarding ERP amplitude in the P3 window. Conse- quently, there was a medium-sized correlation between predicted and observed single-trial amplitudes at the time of the P3,M¼0.33, 95% HDI [0.29 0.37]. In contrast, as can be seen fromFig. 8B, the predicted EEG in the ERN time window did not reproduce the large negative shift specif- ically in incorrect trials at the longest SOA. Therefore, the correlation between predicted and observed single-trial amplitudes at the time of the ERN was small,M¼0.09, 95% HDI [0.06 0.11]. Likewise,Fig. 8C shows that longer SOAs were associated with a positive shift in incorrect trials during the Pe time window, which was just opposite to the pattern observed with confidence judgments (cf.Fig. 2B) and therefore was not reproduced by the prediction. The correlation between predicted and observed single-trial amplitudes at the time of the Pe was also smallM¼ 0.16, 95% HDI [0.12 0.20]. The same results were obtained when we repeated this analysis with the noisy decay model and the detection heuristic model (see Supplementary Fig. S3). Finally, an exploratory analysis was performed to assess when in quasi-continuous time the EEG activity was associated with predicted confidence according to the WEV- model. For this purpose, we used a series of multivariate regression an- alyses performed separately for 10 ms time windows with confidence predicted by the WEV-model as outcome variable and all sensors as predictors (see Supplementary Fig. S4). The analysis suggested that stimulus-locked EEG activity strongly predicted confidence according to the WEV-model with peaks around 150 ms, 250 ms, and 400 ms post- stimulus. The third peak coincided with the P3. For response-locked ERPs, only a small portion of the variance of confidence according to the WEV-model could be explained by EEG at the time of the response, and a moderate portion during a broad time window between 200 and 500 ms postresponse.
The relationship between confidence and ERP amplitudes of course does not need to be linear. For this reason, wefitted non-linear trans- formations to the data from each subject by assigning the voltage that minimized the prediction error with respect to ERP amplitude to each level of confidence. The only restriction of the transformation was that the relationship between confidence and ERP amplitudes was assumed to be monotonous. Nevertheless, the predictions based on these specifically adapted transformations were only consistent with amplitudes at the time of the P3, but not with ERN or Pe (seeSupplementary Fig. S5).
4. Discussion
The present study was consistent with an EEG correlate of decision confidence 350–500 ms after onset of the stimulus, at the time of the P3 component: First, ERP amplitudes at the time of the P3 were associated with observers’ confidence judgments, although the data were not conclusive if the correlation between confidence and EEG activity at the time of the P3 can be explained by the correlation between confidence and SOA. Second, the amplitude at the time of the P3 varied as a function of SOA and choice accuracy in the same way as confidence judgments did. Finally, P3 amplitude could be accurately predicted by the weighted evidence and visibility (WEV) model, which at the same time provided the best account of confidence judgments. In contrast, EEG activity at the time of the ERN component, an established marker of error detection, as well as at the time of the Pe, a marker of error awareness, did not follow the same statistical pattern as decision confidence as a function of SOA and accuracy, despite the fact that a correlation between amplitude and
confidence was detected at the time of the Pe. Moreover, there were only weak correlations between the prediction derived from the WEV-model and ERP amplitude at the time of ERN and Pe.
4.1. Role of the P3
The P3 was the only one of the three previously proposed ERP cor- relates of decision confidence that was consistent with the present data.
Although the present study was not conclusive about an effect of confi- dence on EEG activity over and above task difficulty, a previous study using only one difficulty level of a different perceptual task observed that confidence was associated with EEG activity at the time of the P3 (Boldt and Yeung, 2015). Nevertheless, it cannot be ruled out that the observed correlation between decision confidence and P3 is due to a common cause. One potential alternative explanation is that the P3 reflects sub- jective visibility (Lamy et al., 2008;Sergent et al., 2005;Tagliabue et al., 2019), which is correlated to decision confidence but may not necessarily reflect the same process (Jachs et al., 2015;Rausch and Zehetleitner, 2016;Zehetleitner and Rausch, 2013). A second possibility is that the P3 reflects processes involved in discrimination performance. Recent studies showed that stimulus properties can be experimentally varied to change confidence without changing discrimination performance (Koizumi et al., 2015;Odegaard et al., 2018;Samaha et al., 2016). Experimental manipulations of the stimulus that influence confidence but not accuracy seem promising for future studies to elucidate if the P3 reflects confi- dence or discrimination performance.
How could an association between P3 and decision confidence be reconciled with the various other roles of the P3 that have been proposed in the literature? An explanation may be given in terms of probabilistic models of perception, according to which observers take into account knowledge of the uncertainty associated with the observations (Ma, 2012). One possible interpretation is that the P3 directly reflects cer- tainty within the decision process (Herding et al., 2019). In line with this interpretation, the P3 showed the statistical pattern referred to as folded-X pattern in a vibrotactile task (Herding et al., 2019), meaning both statistical patterns associated with decision confidence in different tasks, the folded X-pattern and the double increase pattern, have been detected in P3 amplitudes. Moreover, the P3 is related to the accumu- lation of sensory evidence within the decision process (O’Connell et al., 2012;Twomey et al., 2015). Finally, the P3 is suppressed in highly visible stimuli if observers are not required to make a perceptual decision (Pitts et al., 2014). Thesefindings converge with a line of research suggesting that decision confidence may emerge directly from the decision process.
For example, neurons in parietal cortex of rhesus monkeys represented both formation of the direction decision and the degree of certainty (Kiani and Shadlen, 2009). Likewise, human EEG correlates of decision formation and confidence coincided in time and in reconstructed sources in a face vs. car discrimination task (Gherman and Philiastides, 2015). In contrast, for at least one brain area implicated in decision making, the superior colliculus, it was shown that it reflects decision making, not decision confidence (Odegaard et al., 2018).
A second interpretation in terms of probabilistic models is that the P3 reflects sensory representations that include the reliability of the percept (Kopp et al., 2016). This second view is consistent with classical in- terpretations of the P3 as update of working memory in response to task-relevant events (Donchin and Coles, 1988) or global broadcast of information within a neural global workspace (Sergent et al., 2005).
These updated or broadcast representations may encompass the reli- ability of the percept (Shea and Frith, 2019), which is why the P3 should be correlated with confidence judgments. In line with this interpretation, the WEV-model assumes that confidence is determined by the perceived strength or reliability of the percept based on evidence about choice-relevant and choice-irrelevant features. This means that the inferred computational principles underlying decision confidence include a representation of the reliability of the percept as well.
Finally, it should be noted that the observation that decision
confidence and P3 share their statistical patterns in the present study does not imply that decision confidence and P3 necessary share their statistical patterns across all possible experiments. The statistical patterns associated with confidence vary across different tasks (e.g.Kiani et al., 2014;Moran et al., 2015;Rausch et al., 2018;Sanders et al., 2016;van den Berg et al., 2016). If the P3 were indeed a neural marker of decision confidence, confidence and P3 should be associated with the same sta- tistical patterns in all tasks. The present study and Herding et al. are not sufficient to make this conclusion. Future studies are necessary to test if the P3 is a general marker of decision confidence, or if the present results are specific to the present task.
4.2. Role of ERN
In the present study, EEG activity in the ERN time window can be interpreted as specifically error detection, but not as decision confidence.
EEG activity at the time of the ERN does not reflect confidence because the effects of SOA were opposite to what was expected from observed confidence judgments. At least in the present study, the ERN may not be related to postdecisional sensory evidence, because sensory evidence in correct trials is expected to increase with SOA (Hangya et al., 2016), but at the time of the ERN, the only reliable effect was large negative shift specifically in incorrect trials at the longest SOA. The absence of an ERN at shorter SOAs is in line with a previous study showing that the elici- tation of a ERN requires participants to know which response is the correct one (Di Gregorio et al., 2018). Likewise, in the present study, observers also did not know for sure which response had been correct at shorter SOAs because the mask impeded perception of the target. These findings are also consistent with a previous study showing that the ERN occur only when observers make erroneous responses to stimuli rated as
“visible” (Charles et al., 2014, 2013). Although we did not measure conscious awareness in the present study, we can extrapolate from other studies using the same task that observers’conscious percepts of the stimuli were degraded in shorter SOAs (Rausch and Zehetleitner, 2019b;
Zehetleitner and Rausch, 2013); possibly, weakly conscious stimuli are not sufficient to trigger an ERN.
4.3. Role of Pe
A possible interpretation for the role of the Pe in the present study is
as accumulation of postdecisional sensory evidence. At least in the pre- sent study, the Pe does not reflect decision confidence because their statistical patterns as functions of SOA and choice accuracy are not compatible. In addition, the Pe does not exclusively reflect error awareness, because EEG activity at the time of the Pe was correlated with confidence in correct trials. However, the pattern of the Pe as a function of SOA and choice accuracy matches the diverging pattern between correct and incorrect responses expected from postdecisional accumu- lation of sensory evidence (Moran et al., 2015). The contribution of postdecisional sensory evidence to confidence varies across tasks (Bar- anski and Petrusic, 1994). In the present paradigm, it may be relatively small, because the mask prevents ongoing accumulation of evidence from sensory memory. In line with this interpretation, cognitive modelling showed that the WEV modelfitted confidence much better than the SDT model with postdecisional evidence. If the Pe reflects postdecisional accumulation of evidence, this explains effects at the time of the Pe seemed to be limited to high confidence trials why in the present study.
The efficiency of the mask varies across trials, and presumably the mask had been relatively ineffective in trials when observers reported high degrees of confidence. Moreover, if the Pe represents postdecisional sensory evidence, it can be explained why a previous study detected an association between the Pe and all degrees of confidence (Boldt and Yeung, 2015). As stimuli in that study were not masked, postdecisional accumulation of sensory evidence may have been more effective than in the present study. Finally, the Pe may not only be sensitive to postdeci- sional sensory evidence, but may reflect also other sources of informa- tion, including response conflict, efference copy, proprioception, perception of action effects, and interoception (Ullsperger et al., 2010;
Wessel et al., 2011).
4.4. Statistical signatures of confidence?
The present study demonstrates that statistical patterns of confidence can provide a strong test for identifying correlates of confidence, although it is crucial to validate statistical signatures of confidence empirically by behavioural measures of confidence. It has been argued that if confidence is determined objectively as the posterior probability of being correct, the pattern referred to as folded X-pattern is the statistical signature of confidence (Hangya et al., 2016; Sanders et al., 2016).
Therefore, a substantial number of recent studies have searched for the Fig. 8. Comparison between predicted and observed amplitudes (A) in the P3 time window, (B) in the ERN time window, and (C) in the Pe time window, depending on stimulus-onset-asynchrony (x-Axis) and accuracy of the orientation response (colours and symbols). Symbols: observed data. Lines: Prediction based on the pa- rameters of the WEV-modelfitted to confidence judgments as well as a linear transformation of confidence. Error bars¼1 within-subjectSEM. Ribbons¼1 within- subjectSEM.