https://doi.org/10.5194/acp-20-10493-2020
© Author(s) 2020. This work is distributed under the Creative Commons Attribution 4.0 License.
Moisture origin as a driver of temporal variabilities of the water vapour isotopic composition in the Lena River Delta, Siberia
Jean-Louis Bonne1, Hanno Meyer2, Melanie Behrens1, Julia Boike2,3, Sepp Kipfstuhl1, Benjamin Rabe1, Toni Schmidt2, Lutz Schönicke2, Hans Christian Steen-Larsen4,5, and Martin Werner1
1Alfred-Wegener-Institut Helmholtz-Zentrum für Polar- und Meeresforschung, 27515 Bremerhaven, Germany
2Alfred-Wegener-Institut Helmholtz-Zentrum für Polar- und Meeresforschung, 14401 Potsdam, Germany
3Geography Department, Humboldt-Universität zu Berlin, 10099 Berlin, Germany
4Geophysical Institute, University of Bergen, 5020 Bergen, Norway
5Bjerknes Centre for Climate Research, 5020 Bergen, Norway
Correspondence:Jean-Louis Bonne (jean-louis.bonne@awi.de) and Martin Werner (martin.werner@awi.de) Received: 15 October 2019 – Discussion started: 6 January 2020
Revised: 28 May 2020 – Accepted: 5 July 2020 – Published: 9 September 2020
Abstract. In the context of the Arctic amplification of cli- mate change affecting the regional atmospheric hydrological cycle, it is crucial to characterize the present-day moisture sources of the Arctic. The isotopic composition is an impor- tant tool to enhance our understanding of the drivers of the hydrological cycle due to the different molecular characteris- tics of water stable isotopes during phase change. This study introduces 2 years of continuous in situ water vapour and pre- cipitation isotopic observations conducted since July 2015 in the eastern Siberian Lena delta at the research station on Samoylov Island. The vapour isotopic signals are dominated by variations at seasonal and synoptic timescales. Diurnal variations of the vapour isotopic signals are masked by syn- optic variations, indicating low variations of the amplitude of local sources at the diurnal scale in winter, summer and autumn. Low-amplitude diurnal variations in spring may in- dicate exchange of moisture between the atmosphere and the snow-covered surface. Moisture source diagnostics based on semi-Lagrangian backward trajectories reveal that different air mass origins have contrasting contributions to the mois- ture budget of the Lena delta region. At the seasonal scale, the distance from the net moisture sources to the arrival site strongly varies. During the coldest months, no contribution from local secondary evaporation is observed. Variations of the vapour isotopic composition during the cold season on the synoptic timescale are strongly related to moisture source regions and variations in atmospheric transport: warm and isotopically enriched moist air is linked to fast transport from
the Atlantic sector, while dry and cold air with isotopically depleted moisture is generally associated with air masses moving slowly over northern Eurasia.
1 Introduction
The amplitude of climate change in Arctic regions is likely to affect the atmospheric hydrological cycle, as sea ice is re- treating and the temperatures are increasing, modifying the sources of evaporation and the saturation vapour pressure of the atmosphere. However, changes in the evapotranspiration of Arctic regions during recent decades are poorly known so far (Vihma et al., 2015).
Isotopic concentrations are commonly reported as δ18O andδ2H, representing for the relative abundances of H182 O and H2H16O, respectively, compared to the most abundant isotopologue H162 O. As isotope fractionation occurs during phase changes in water, isotopes are largely used as tracers of the hydrological processes in the atmosphere and can be in- terpreted as proxies for past temperature variations in differ- ent types of climatic archives, such as ice cores, speleothems or ice wedges, which are specific ground ice features found in permafrost environments.
Theδ18O andδ2H of precipitation and vapour at the global scale are primarily determined by the cooling-induced equi- librium distillation of the moisture from the source towards the measuring site. To the first order, this distillation affects
both H182 O and H2H16O similarly, causing a global linear dis- tribution ofδ2H versusδ18O with a slope close to 8 (Craig, 1961). Additional phase change processes occurring during non-equilibrium, namely kinetic fractionation processes such as fast evaporation from the ocean surface or snow crys- tal formation, are visible in deviations from this relationship (Dansgaard, 1964; Jouzel and Merlivat, 1984; Merlivat and Jouzel, 1979). To study the impacts of kinetic fractionation, the second-order parameter deuterium excess, hereafter d- excess, has been defined as the deviation from this δ2H to δ18O relationship (Dansgaard, 1964).
Present-day observations of vapour and precipitation events refine the understanding of various phases of the at- mospheric water cycle and their imprint on water isotopic compositions (Galewsky et al., 2016). Such studies focus on exchange processes between the atmosphere and the Earth’s surface over open oceans (Benetti et al., 2014, 2017; Bonne et al., 2019; Zannoni et al., 2019), ice sheets (Madsen et al., 2019; Steen-Larsen et al., 2014), sea ice surfaces (Bonne et al., 2019) or continents (Bastrikov et al., 2014). Other studies focus on the atmospheric transport of moisture and show that typical vapour isotopic signals can be associated with dis- tinct patterns of moisture origins (Bonne et al., 2014, 2015;
Guilpart et al., 2017; Kopec et al., 2014; Steen-Larsen et al., 2013, 2015). However, the systematic relationship between water isotopes and atmospheric moisture transport remains uncertain in many conditions and locations. Recently, water vapour isotopic observations have also been showing great potential when used to benchmark the simulations of the hy- drological cycle in general circulation models equipped with water isotopes (Steen-Larsen et al., 2017).
In the eastern Arctic region, water isotopic measurements of precipitation samples have been conducted at a land sta- tion along the Lena River (Zhigansk; 66.8◦N, 123.4◦E;
92 m a.s.l.) during multiple years (2004–2008) and have been combined with water vapour isotopic observations based on discrete samples during a ship campaign in the eastern Arctic Ocean for a period extending from before the sea ice mini- mum to the beginning of the sea ice growth season (Kurita, 2011). This study revealed that higher values of d-excess were observed at the land station in mid-Autumn for air masses originating from the Arctic Ocean region compared to air masses originating from lower latitudes. A hypothesis to explain these high d-excess values was that evaporation over the ocean was taking place during the sea ice growth season at very low relative humidity: the dry air masses originating from sea ice covered areas enhance evaporation with strong kinetic fractionation when passing over the open ocean.
More recently, continuous water vapour isotopic obser- vations have been conducted in western Russia at the Kourovka observatory (Bastrikov et al., 2014; Gribanov et al., 2014) and at Labytnangi (Konstantin Gribanov and Jean Jouzel, personal communication, 2015). Observations from the Kourovka station depicted seasonal and synoptic varia-
tions as well as strong diurnal variations in summer on the first- and second-order vapour isotopic signals. To explain the lack of relationship between the vapour isotopic signal and meteorological parameters (humidity and temperature) in summer, a strong contribution of continental recycling and local evapotranspiration has been suggested (Butzin et al., 2014). These observations were also used to test the ability of an isotope-enabled atmospheric general circulation model to reproduce the water vapour isotopic composition and have shown an excellent correlation between simulation and water vapourδ2H values measured at the surface (Gribanov et al., 2014).
In this study, we focus on water vapour isotopic observa- tions continuously performed from July 2015 to June 2017 at the research station on Samoylov Island in the Lena delta (72◦220N, 126◦290E) in the Russian Arctic. This station is at higher latitude and much further east than the Kourovka and Labytnangi stations and will therefore be more representa- tive of an Arctic continental climate. We assess the variations of water vapour isotopic composition at different timescales, from the seasonal to the synoptic and diurnal scales, and re- late them to the variations of local meteorological param- eters. In order to interpret these variations in a larger re- gional context, we use atmospheric transport simulations to- gether with moisture source diagnostics. These simulations help identify the main moisture advection regimes of the re- gion and decipher the imprint of local versus remote moisture sources on the locally observed water vapour isotopic com- position.
2 Method 2.1 Study area
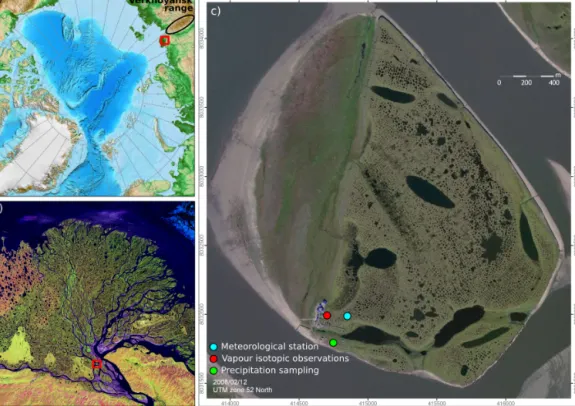
The observations presented in this study have been conducted in the Lena River Delta, north-east Siberia (Fig. 1a), at the research station on Samoylov Island (72◦220N, 126◦290E) (Fig. 1b, c). The Lena River flows from its source in the Baikal Mountains towards north into the Laptev Sea where it forms a large delta 150 km in diameter. In its northern part, the river flows alongside the Verkhoyansk Mountains on its eastern side (see Fig. 1). Samoylov Island consists on its western part of a modern floodplain and on its eastern part of a Holocene terrace characterized by polygonal tundra and larger water bodies (see Fig. 1c and Supplement Fig. S1).
With a mean annual temperature below−12◦C, minimum winter air temperatures below−45◦C and summer air tem- peratures that can exceed 25◦C, the region has a typical Arctic continental climate (Boike et al., 2013, 2019a). Over the 2002–2017 period, average annual rainfall was about 169 mm, and the winter snow cover was thin (∼0.3 m), with a maximum recorded of about 0.8 m in 2017. The snow ac- cumulation starts in late September and all the snow cover completely melts over a few days in early June. Permafrost
underlays the study area, and the rate of permafrost tempera- ture warming at the zero annual amplitude (ZAA) level is one of the highest recorded (Biskaborn et al., 2019). The active layer thawing period starts at the end of May, and the active layer thickness reaches a maximum at the end of August to the beginning of September.
2.2 Meteorological observations
We used meteorological records from Samoylov Island avail- able from the PANGAEA database (Boike et al., 2019b), compiled as part of a study focusing on the influence of meteorological parameters on the local permafrost evolution (Boike et al., 2019a). The location of the meteorological ob- servations is displayed in Fig. 1c. The temporal resolution of this dataset in our period of interest is 30 min. The meteo- rological parameters were measured at an approximate dis- tance of 200 m eastward from our water isotopic observa- tions. Here, we use the following parameters, always mea- sured above the snow cover during the periods when snow is present: relative humidity (RH, expressed in percent) and air temperature (◦C) measured at 2 m above ground level;
and wind speed (m s−1) and wind direction (expressed in de- grees) measured at 3 m above ground level.
2.3 δnotation for water isotopic compositions and d-excess
Isotopic compositions of samples are expressed asδ18O and δ2H in per mille (‰).δvalues are defined as in Craig (1961):
δ=1000·
Rsample RVSMOW−1
, (1)
whereδcan be eitherδ18O orδ2H, withRsampleandRVSMOW as the isotopic ratios (H182 O/H162 O or H2H16O/H162 O, respec- tively) of the sample and the Vienna Standard Mean Ocean Water (VSMOW2) reference (Coplen, 2011).
We calculated the d-excess using its classical definition (Dansgaard, 1964):
d-excess=δ2H−8·δ18O. (2)
2.4 Water vapour isotopic observations
A cavity ring-down spectrometer (CRDS) was installed in July 2015 at the Samoylov station in order to continuously record the near-surface water vapour isotopic composition at an approximate 1 Hz frequency. Its location is displayed in Fig. 1c. The analyser is placed inside a heated container (an electric heater placed inside the container prevents the tem- perature from dropping below the freezing point in winter) and the ambient air inlet is located at 5 m above the ground level, above the roof of the container. The inlet tube (1/4 in.
diameter stainless-steel tube of approximately 4 m length) is insulated and constantly heated by a heating wire at around 50◦C, independently from the container heating. Following
the recommendations for long-term calibration of CRDS wa- ter vapour isotopic analysers (Bailey et al., 2015), a custom- made calibration system allows for the automatic correction of (i) the concentration dependence of the isotopic measure- ments as a function of the humidity level and (ii) the devia- tion from the VSMOW2 (Coplen, 2011) scale on a daily ba- sis. The system includes a custom-made vaporizer system (as described in Bonne et al., 2019), allowing for the measure- ment of four different water isotopic standards, and a bub- bler system (similar to the one described in Steen-Larsen et al., 2014) with one standard water of known isotopic com- position (see the schematics of the system in Supplement Fig. S2). The data treatment and calibration procedures are similar as for Bonne et al. (2019). Details on the calibra- tion applied and the stability of the standards measurements are given in the Supplement. We denoteδ18Ov,δ2Hvandd- excessvas the isotopic values of the water vapour. Based on the uncertainty of both corrections of the humidity concen- tration dependence and deviations from the VSMOW2 scale, the measurement accuracy is estimated at 0.6 ‰, 3.0 ‰ and 5.7 ‰ forδ18Ov,δ2Hv andd-excessv. The precision is es- timated from the standard deviation of calibration standard measurements at a constant humidity level. For values av- eraged at a 1 h resolution, the precision measurements per- formed under humidity levels higher than 3 g kg−1 is equal to 0.25 ‰, 0.5 ‰ and 2 ‰ forδ18Ov,δ2Hv andd-excessv. This precision deteriorates logarithmically for drier air con- ditions, reaching 2.0 ‰, 6.5 ‰ and 17 ‰ forδ18Ov,δ2Hvand d-excessvfor humidity levels of 0.3 g kg−1. The dataset pre- sented in this study has been averaged at a 6 h temporal res- olution (except for the calculation of the diurnal cycle based on the hourly averaged dataset), and the precision can there- fore be estimated at 0.10 ‰, 0.2 ‰ and 1 ‰ forδ18Ov,δ2Hv andd-excessvfor humidity levels above 3 g kg−1and 0.8 ‰, 2.7 ‰ and 7 ‰ forδ18Ov,δ2Hvandd-excessvfor humidity levels of 0.3 g kg−1.
Technical difficulties linked with the extreme cold and dry conditions during winter and the remote location of the sta- tion lead to some periods of missing data. Modifications of the instrumental set-up and calibration procedure during the successive maintenance expeditions allowed us to progres- sively enhance the precision of the measurements.
2.5 Water isotopic composition of event-based precipitation samples and calculation of equilibrium vapour isotopic composition
Precipitation sampling is carried out after each rainfall and snowfall event using a funnel construction tightly connected (with a rubber plug to avoid evaporation) to a 250 mL high- density polyethylene (HDPE) bottle, which is emptied after each precipitation event. The 250 mL bottle is placed inside a larger tube to protect it from wind. The funnel is connected to this larger tube with tent cords and fixed to the ground as well. The set-up is located about 250 m from the loca-
Figure 1.Maps of the study area(a)in the Arctic region (North Pole Lambert azimuthal projection). The Verkhoyansk range is indicated with a black ellipse.(b)Within the Lena River Delta, eastern Siberia (Landsat 7, 2000; image provided by the USGS EROS Data Center Satellite Systems Branch). (c)Map of Samoylov Island (Source: Esri, DigitalGlobe, GeoEye, Earthstar Geographics, CNES/Airbus DS, USDA, USGS, AeroGRID, IGN, and the GIS User Community), with the locations of the meteorological station, water vapour isotopic observations and precipitation sampling set-up respectively displayed as blue, red and green dots.
tion of the water vapour isotopic observations as displayed in Fig. 1c.
Event-based precipitation samples retrieved over the pe- riod of the study have been measured for their water isotopic composition in the stable isotope laboratory of the Alfred Wegener Institute–Helmholtz Centre for Polar and Marine Research in Potsdam. Isotope ratios were determined by iso- tope ratio mass spectrometry using a Finnigan MAT Delta-S mass spectrometer and applying the equilibration technique (Meyer et al., 2000). The measurement accuracy is better than 0.1 ‰ for δ18Op and 0.8 ‰ for δ2Hp (Meyer et al., 2000). We denoteδ18Op,δ2Hpandd-excesspas the isotopic values of precipitation.
To compare the vapour and precipitation isotopic dataset, we calculate the isotopic composition of a theoretical water vapour at equilibrium with the precipitation from the mea- sured δ18Op andδ2Hpvalues. We use the measured 2 m air temperature to estimate the value of theαeqequilibrium frac- tionation coefficients between liquid (solid) and vapour for air temperatures above (below) the freezing point (Majoube, 1971a, b; Merlivat and Nief, 1967). For each precipitation sample, with an isotopic ratio denotedRP, the theoretical iso- topic ratio of vapour, denotedRV, is given byRV=RP/ αeq.
2.6 Selection of synoptic extrema from meteorological and vapour isotopic parameters
We identify the extrema occurring at a synoptic timescale for a set of parameters based on the daily averaged dataset:
temperature, the logarithm of specific humidity,δ18Ovandd- excessv. We use the logarithm of specific humidity for com- parability regarding its logarithmic relationship with temper- ature (Clausius–Clapeyron relationship). For each parameter, we compute the distances of the daily values to a 60 d running average and identify the extrema as the first and last deciles of this dataset (low and high extrema, respectively). Some data gaps exist at different periods for the temperature, spe- cific humidity and the isotopic parameters. In order to have a comparable selection of extrema for all parameters without the influence of the different data gaps between the datasets, we base this selection of synoptic-timescale extrema only on data with simultaneously valid measurements for all param- eters. No water vapour isotopic data are removed due to this selection, but it leads to the filtering of 3.7 % and 13.1 %, respectively, of the specific humidity and temperature data.
2.7 Sea ice cover data
The sea ice coverage within the 500 km area surrounding the station has been derived from ERA-Interim reanalyses (Dee et al., 2011) at 0.75◦×0.75◦spatial and 6 h temporal reso- lution. Results are shown as a proportion of sea-ice-covered surface compared to the surface of the surrounding 500 km area. As this area includes grid cells covered by land, the maximum value is lower than 1.
2.8 Moisture source diagnostics
The origin of the moisture arriving at our research area is estimated using a moisture source diagnostic method (Sode- mann et al., 2008) based on semi-Lagrangian simulations of air mass transport with the model FLEXPART version 8.1 (Stohl et al., 2005). Meteorological fields from the ECMWF ERA-Interim dataset (Dee et al., 2011) at 0.5◦ horizontal resolution and 137 vertical levels are used. Air parcels are traced 10 d backward in time from a box centred around the Samoylov station. The box has a 3◦×6◦latitudinal and lon- gitudinal width and spans altitudes between 0 and 500 m.
All simulation outputs are presented over a global grid of 1◦×1◦resolution representing the summed contribution of all individual particles. From the air mass trajectory simula- tions, without considering the transport of moisture yet, we calculate the parameter “trajectory locations” as the summed number of air masses passing within each grid cell over all time steps. This parameter is representative of the location of transported air masses.
As different air masses can carry various amounts of mois- ture, a complementary calculation is conducted to properly evaluate the atmospheric transport of moisture: this mois- ture source diagnostic consists of interpreting the increase or decrease in the moisture content of air masses between different successive time steps along their trajectories as an input or output, respectively, of moisture contributing to the total moisture at the end of the trajectories. The contribution of every single air mass in terms of the input and output of moisture is summed over all model output grid cells. Differ- ent parameters are estimated over this grid. The parameter
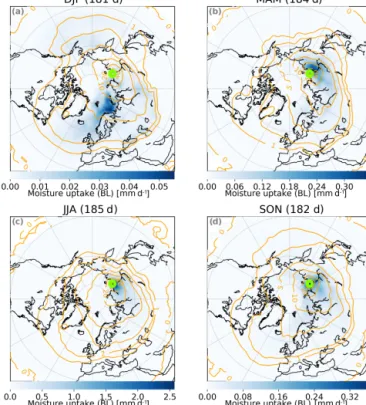
“moisture uptake” (mm d−1) represents the amount of mois- ture injected to the air masses within each grid cell. Moisture uptakes are interpreted as evaporation, transpiration or subli- mation at the surface when the air masses are below an alti- tude equal to 1.5 times the boundary layer height. Moisture uptakes are interpreted as the result of the mixing of differ- ent air masses or the re-evaporation of falling precipitation when the air masses are above this threshold and therefore within the free troposphere (Dütsch et al., 2018). Therefore, the parameters “boundary layer moisture uptake” and “free troposphere moisture uptake” are presented separately. The parameter “evaporation minus precipitation” (mm d−1) rep- resents the sum of the differences between the moisture up-
takes and moisture losses of all particles occurring in each grid cell.
3 Results
3.1 Ranges of variations of isotopic and meteorological dataset
Over the observational period (1 July 2015 to 1 July 2017), the dataset comprises a total of 2395 water vapour isotopic values at a 6 h resolution. All observed parameters presented in Fig. 2 are characterized by variations at the inter-annual, seasonal, synoptic and eventually diurnal timescales.
For temperature and specific humidity distributions, the amplitude of seasonal variations is larger than the ampli- tude of synoptic variations (Fig. 2). The complete observa- tion period presents averages of specific humidity and tem- perature of 2.4 g kg−1 and−11◦C (Table 1). Minimal and maximal temperatures reach −41.1◦C and +21.5◦C, re- spectively (Table 1). This 2-year period is not exceptional, as observations over 16 years at this site have recorded tem- perature extremes below −45 and above +25◦C, with an average mean annual temperature of−12◦C (Boike et al., 2019a), close to the average on our observational period.
Specific humidity values reach extremely dry values in win- ter, down to 0.06 g kg−1, and maximum values in summer up to 12 g kg−1. A non-linear distribution between air tempera- ture and specific humidity is observed (Fig. 3b), as expected from the Clausius–Clapeyron relationship. Relative humidity values vary between 40 % and 102 %, with a mean value of 84 % (Table 1).
Important local hydrological changes are expected between evapotranspiration- and sublimation-dominated regimes during the warm and the cold seasons. The surround- ings of the station are indeed characterized by contrasting surface cover between these seasons, with the ice-free or ice-covered Lena River, land areas covered by vegetation or snow, and the surrounding Laptev Sea covered by sea ice dur- ing the cold season. Locally measured snow depth indicates the continuous presence of a snow cover from the last days of September to June. Melting takes place within a few days un- til mid-June (in 2016) or the end of June (in 2017), as seen in Fig. 2. Satellite images from the MODIS sensor on the Terra satellite reveal that ice covering the river in the Lena delta completely disappears within a few days between 23 May and 10 June in 2016 and between 29 May and 13 June in 2017. The freeze-up of the Lena River also takes place within a few days and has been estimated between 10 and 20 Octo- ber in 2015 and between 15 and 22 October in 2016. The sea ice cover on the Laptev Sea, as estimated from the proportion of sea ice within the surrounding 500 km derived from the ERA-Interim data, also depicts the fast opening of a polynya in early June (Fig. 2). The presence of a significant sea ice cover in the region is still observed in July, and the complete
disappearance of sea ice occurs by the end of August. The complete sea ice cover then builds up within a few weeks in October (in mid-October in 2015 and in the second half of October in 2016). Many different surface cover changes take place simultaneously or within a few days or weeks in au- tumn and spring. There is no simple situation without snow but with complete sea ice and river ice or the opposite sit- uation. It is therefore difficult to investigate the impacts of the evolution of each potential local moisture source individ- ually.
For δ18Ov andδ2Hv, some episodes of winter synoptic variations reach almost the amplitude of the seasonal cy- cle, while thed-excessvsignal is predominated by synoptic variations (Fig. 2). The vapour δ18Ov,δ2Hv andd-excessv
have averaged values over the complete dataset of−36.9 ‰,
−270 ‰ and 24.6 ‰, respectively (Table 1). Water vapour isotopic composition minima and maxima are−53.2 ‰ and
−20.9 ‰ for δ18Ov, −382 ‰ and −155 ‰ for δ2Hv, and +3 ‰ and +62 ‰ ford-excessv. At Samoylov, the δ18Ov andδ2Hvare overall strongly correlated, with the following empirical relationship: δ2Hv=7.2δ18Ov −6.7, R2=0.98 (Fig. 3a). This slope is a little lower than the slope of 7.5 obtained from observations at the Kourovka observatory in western Siberia (Bastrikov et al., 2014) and lower than the local meteoric water line (LMWL) of Samoylov precipita- tion (LMWL: δ2Hp=7.6δ18Op−5.5,n=208, R2=0.95, p <0.05). While the warm season isotopic compositions are similar between the two years, significant inter-annual dif- ferences between the average d-excessv values during the cold seasons are noticed, with higherd-excessvvalues dur- ing winter and spring 2016 than in 2017 (average and stan- dard deviation ofd-excessvof+32.5±9.0 ‰ from Decem- ber 2015 to April 2016 and +22.7±7.5 ‰ from Decem- ber 2016 to April 2017).
The precipitation samples also depict inter-annual, sea- sonal and synoptic variations. Altogether, precipitation sam- ples depict more enrichedδ values and lowerd-excess than vapour, with mean values over the complete observation pe- riod forδ18Op,δ2Hpandd-excesspof−21.6 ‰,−169.3 ‰ and 3 ‰, respectively (Table 1). The difference between vapour and precipitation is stable throughout all seasons for δ values but varies between seasons for thed-excess, with higher gaps in spring (maximum gap) and winter than in summer (minimum gap) and autumn. Precipitation samples have on average 14.5 ‰ lowerd-excess values than vapour in summer and 28.5 ‰ lowerd-excess values in spring, as shown in Table 1. Significant inter-annual variations are no- ticed during the cold seasons in the values of δ18Op,δ2Hp and particularlyd-excessp, with higherδ18Opandδ2Hpand lowerd-excessp values during winter and spring 2016 than in 2017 (average and standard deviation of δ18Op and d- excesspof−24.7±5.4 ‰ and−9.1±17.8 ‰, respectively, from December 2015 to April 2016 and−29.2±5.2 ‰ and +9.5±7.7 ‰ from December 2016 to April 2017). The dif- ference in precipitation d-excessp levels between the two
years is in the opposite direction compared to the difference observed in the vapourd-excessv.
The minima of specific humidity are associated with the lowest δ18Ov and δ2Hv and the highest d-excessv values, comparable to vapour observations performed on the East Antarctic Plateau in summer (Casado et al., 2016; Ritter et al., 2016). This could indicate a strong isotopic depletion during long-range atmospheric transport from the moisture sources to the location of the observations or the recycling of moisture with sublimation over the surrounding snow- covered areas (Pang et al., 2019). Such highd-excessvvalues not only reflect kinetic fractionation processes, but are also partly due to the variations of theδ18Ov toδ2Hv relation- ship during equilibrium fractionation at very low tempera- tures (Dütsch et al., 2018).
There is a linear relationship betweenδ18Ovand air tem- perature (with a slope of 0.44 ‰◦C−1,R2=0.75,p <0.01;
Fig. 3c) but with a large scatter, clearly demonstrating that the air temperature variations do not fully explain theδ18Ov variations. This linear relationship observed in vapour is close to the 0.4 ‰◦C−1 relationship obtained for both lo- cal precipitationδ18Opin event and monthly means and for δ18Ov and T at the western Siberian Kourovka station. A non-linear relationship betweenδ18Ovand specific humidity is also depicted (Fig. 3d). We note for low temperatures and specific humidity values (below−20◦C and 0.1 g kg−1) that the distribution ofδ18Ovvalues against temperature and spe- cific humidity is curved towards higherδ18Ovvalues com- pared to this linear relationship. It is not certain if this devi- ation can be attributed to an atmospheric process (such as a more important relative contribution of additional moisture sources at very low humidity compared to higher humidity levels) or if is due to a remaining observational bias or con- tamination that could not be identified despite our calibration and flagging processes.
3.2 Seasonal cycle
A clear average seasonal cycle is observed (Fig. 4 and Ta- ble 1) for temperature, specific humidity and relative hu- midity as well as for the water vapour isotopic composi- tion (δv values and d-excessv). The δ2Hv seasonal varia- tions (not shown) are very similar to the δ18Ov seasonal variations (correlation coefficientR2=1.0, p <0.01, with a slope of 7.34 considering the monthly averages). At the first order, the temperature depicts similar variations as the δvvalues, with a maximum during summer compared to win- ter (δ18Ov/T slope of 0.45 ‰◦C−1considering the monthly averages,R2=0.92,p <0.01; Fig. 4 and Table 2).
A summer peak in temperature and specific humidity is reached in July (monthly averaged values of+8.1±4.2◦C and 6.1±1.4 g kg−1). Significantly colder and drier spe- cific humidity conditions are already measured in Septem- ber (about+3.6±5.3◦C and 4.6±1.6 g kg−1). Forδvval- ues, however, a plateau of maximal values extends from
Table 1.Averaged values (bold characters), standard deviations, minima, maxima and the number of values for all seasons and for the whole dataset within the period 1 July 2015 to 30 June 2017, with a 6 h averaged dataset for air temperature (◦C), specific humidityq(kg−1), relative humidity (%),δ18Ov(‰),δ18OP(‰),δ2Hv(‰),δ2Hp(‰)d-excessv(‰) andd-excessp(‰). Underlined values correspond to precipitation sample measurements.
Season T q RH δ18Ov δ18Op δ2Hv δ2Hp d-excessv d-excessp
(◦C) (g kg−1) (%) (‰) (‰) (‰) (‰) (‰) (‰)
Winter (DJF) Mean –29.3 0.32 77.5 –44.0 –30.0 –325.2 –237.9 27.2 1.9
SD 5.9 0.22 6.3 3.6 4.8 26.0 33.9 9.4 12.0
Min. −40.9 0.06 60.6 −52.6 –41.3 −378.2 –324.6 2.6 –39.7
Max. −8.23 2.20 93.9 −32.9 –12.5 −244.6 –140.0 53.3 15.6
N 684 620 724 550 43 550 43 550 43
Spring (MAM) Mean –14.7 1.48 86.0 –40.4 –24.4 –294.9 –195.7 28.1 –0.4
SD 9.4 0.98 6.2 5.3 5.3 35.7 35.5 9.8 19.5
Min. −41.1 0.06 66.1 −53.2 –36.8 −381.8 –291.3 9.0 –56.1
Max. 3.5 4.63 101.2 −27.0 –8.7 −203.9 –108.3 62.1 33.1
N 736 661 736 650 46 650 46 650 46
Summer (JJA) Mean 6.9 5.56 83.7 –28.8 –15.9 –211.3 –122.2 19.1 4.6
SD 4.6 1.61 10.5 2.6 2.4 19.1 18.1 5.9 6.8
Min. −4.9 2.41 40.3 −36.7 –21.7 −274.1 –166.0 6.7 –12.2
Max. 21.5 11.99 101.4 −20.9 –10.1 −155.3 –83.9 37.8 15.2
N 748 583 748 577 61 577 61 577 61
Autumn (SON) Mean –8.6 2.41 88.3 –34.3 –19.1 –250.7 –147.4 23.9 5.7
SD 11.6 1.90 7.4 7.2 6.2 50.4 45.2 9.4 11.4
Min. −37.4 0.12 61.0 −53.1 –31.1 −370.5 –252.8 4.3 –60.9
Max. 17.6 8.95 101.9 −20.8 –2.3 −162.4 –79.3 56.1 19.6
N 728 618 726 618 59 618 59 618 59
All Mean –11.0 2.28 83.9 –36.9 –21.6 –270.3 –169.3 24.6 3.3
SD 15.4 2.33 8.8 7.6 7.1 55.1 55.6 9.5 13.0
Min. −41.1 0.06 40.3 −53.2 –41.3 −381.8 –324.6 2.6 –60.9
Max. 21.5 11.99 101.9 −20.8 –2.3 −155.3 –79.3 62.1 33.1
N 2896 2482 2934 2395 209 2395 209 2395 209
July to September, with monthly meanδ18Ovvalues between
−28.0±2.4 ‰ and 28.5±2.2 ‰.
For the studied period, the lowest temperatures are mea- sured in December, January and February (with respective monthly means of −30.1±6.0, −27.1±5.1 and −30.7± 5.5◦C). Very dry air is observed during the whole of win- ter (specific humidity below 1.0 g kg−1 from November to February). Two minima of specific humidity are measured in February and December, with 0.26±0.2 and 0.30± 0.2 g kg−1, respectively, corresponding to minimum values of monthly averaged δ18Ov (−47.1±2.5 ‰ and −44.1± 2.3 ‰ for December and February, respectively). The differ- ences in δ18Ov between December and February are hardly significant regarding the precision of our observations at very low humidity.
Transitions between the summer and winter regimes are observed for temperature, specific humidity and δ18Ov in March to June for spring and September to November for au- tumn. We note a temperature, humidity andδ18Ovincrease at the beginning of March (+10.5◦C,+0.8 g kg−1and+2.7 ‰
difference in monthly average between February and March), stagnancy until mid-April, and a sharp increase towards sum- mer values until July. This increase in the monthly average values of temperature, specific humidity andδ18Ovin March is accompanied by large temporal variability compared to the winter months (Fig. 4). This suggests that this early spring transition is primarily linked to an increase in the synoptic variability.
3.3 Synoptic variability
The synoptic variations, which are responsible for variations in the meteorological and water vapour isotopic signals at timescales from a few hours to a few weeks, are related to large-scale meteorological patterns and allow us to investi- gate the influence of remote moisture sources. In order to dis- tinguish these synoptic variations from potential diurnal vari- ations, we use daily averaged values (Supplement Fig. S6).
Compared to the seasonal variations, synoptic variations of specific humidity have a large amplitude in summer (on the
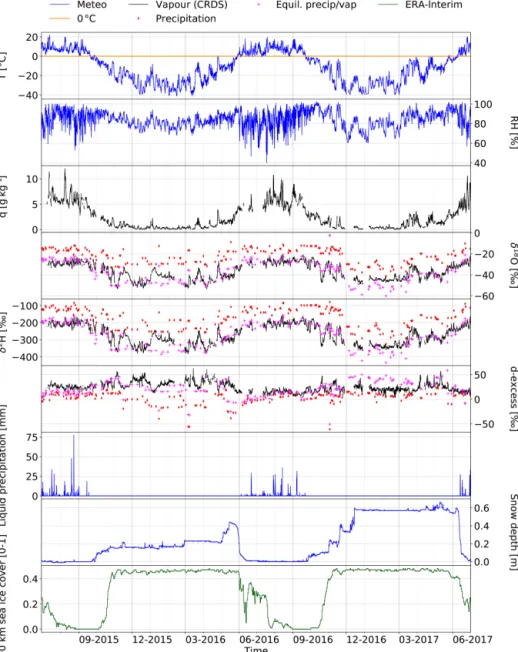
Figure 2.Time series of observations at Samoylov for the period 1 July 2015 to 1 July 2017 for air temperature (◦C), relative humidity (%), specific humidity q(g kg−1),δ18O (‰),δ2H (‰),d-excess (‰), liquid precipitation amount (mm), depth of the snow cover (m) and fraction of the surrounding 500 km area covered by sea ice (from 0 to 1 without unit). Plain lines indicate the continuous parameters, which are displayed in blue for data recorded by the meteorological station, in black for data recorded by the water vapour analyser and in green for data from the ERA-Interim reanalyses database. For the temperature, the plain horizontal orange line indicates the 0◦C value.
Red diamonds (purple crosses) represent the discrete isotopic measurements from precipitation samples (the resulting theoretical vapour isotopic composition considering equilibrium fractionation from precipitation). The temporal resolution is 6 h for all parameters, except for the precipitation, the resulting theoretical vapour isotopic composition (daily averages of event-based samples) and the daily averaged sea ice cover.
order of 5 g kg−1)but a low amplitude in winter (on the order of 1 to 2 g kg−1). In contrast, the synoptic variations of air temperature have a large amplitude in winter (up to 20◦C) and a lower amplitude in summer (around 10◦C). This is coherent with the Clausius–Clapeyron relationship. Frequent episodes of strong relative humidity variations are observed from one day to the next between June and August (varia-
tions from down to 60 % to up to 100 %). During winter, the variations of relative humidity are slow (variations over sev- eral weeks) and of lower amplitude (changes in the order of magnitude of 20 %) than these fast summer variations.
Table 2.Monthly averaged values and standard deviations for the period 1 July 2015 to 1 July 2017 for air temperature (◦C), specific humidityq(kg−1), relative humidity (%),δ18Ov(‰),δ2Hv(‰) andd-excessv(‰).
Month T (◦C) q(g kg−1) RH (%) δ18Ov(‰) δ2Hv(‰) d-excessv(‰) January −27.1±5.1 0.41±0.3 79.2±6.6 −41.5±3.2 −308.6±26.3 23.3±5.9 February −30.7±5.5 0.26±0.2 77.2±5.3 −44.1±2.3 −329.2±21.4 23.4±8.9 March −20.2±10.6 1.04±0.9 83.5±6.9 −41.4±5.8 −305.9±39.4 25.5±10.4 April −15.8±7.6 1.31±0.9 85.4±4.9 −41.4±5.6 −298.8±36.8 32.7±9.3 May −8.3±4.8 2.04±0.9 89.2±5.0 −38.6±4.0 −281.2±25.0 27.3±8.2 June 4.7±4.9 4.55±1.5 83.1±10.3 −30.3±2.6 −226.6±19.0 15.9±3.2 July 8.1±4.2 6.1±1.4 82.8±11.5 −28.5±2.2 −207.4±14.2 20.5±7.6 August 7.9±3.6 5.9±1.5 85.2±9.5 −28.0±2.4 −203.6±15.8 20.2±5.2 September 3.6±5.3 4.6±1.6 88.6±8.2 −28.3±3.4 −207.5±22.0 18.9±7.3 October −8.7±4.8 1.9±0.8 91.6±5.0 −34.3±6.4 −250.2±44.3 24.0±8.9 November −20.8±7.5 0.8±0.6 84.6±6.9 −40.2±5.8 −293.2±38.6 28.5±9.3 December −30.1±6.0 0.3±0.2 76.2±6.4 −47.1±2.5 −341.2±16.1 35.2±8.3
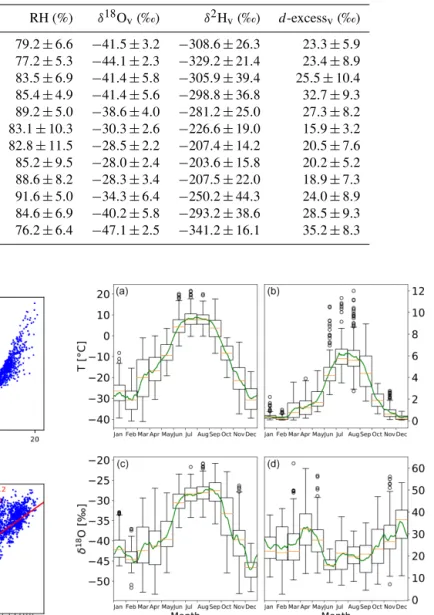
Figure 3.Co-variations of water vapour isotopic composition and meteorological parameters for the complete period 1 July 2015 to 1 July 2017. Red lines represent the best estimate of the linear re- gression.(a)δ2Hv(‰) as a function ofδ18Ov(‰);(b)specific hu- midityq(g kg−1) as a function of air temperature (◦C);(c)δ18Ov (‰) as a function of air temperature (◦C);(d)δ18Ov(‰) as a func- tion of specific humidity (g kg−1).
3.4 Diurnal cycles
We expect diurnal variations of the local evaporation flux to cause diurnal variations of the water vapour isotopic compo- sition. To evaluate the diurnal cycles of meteorological and water isotopic composition, we use datasets averaged at 1 h temporal resolution. Some periods of relatively stable synop- tic situation (with low horizontal wind speed) during spring
Figure 4.Average seasonal cycle for the period 1 July 2015 to 1 July 2017 for(a)air temperature (◦C),(b)specific humidityq (g kg−1),(c)δ18Ov(‰) and(d)d-excessv(‰). For box plots, the boxes represent the first and third quartiles, and the orange bar rep- resents the median; the whiskers represent the lowest (highest) da- tum still within the 1.5 interquartile range (IQR) of the lower (up- per) quartile, and the outliers are represented as black circles.
and summer clearly show significant variations of tempera- ture and relative humidity on the diurnal timescale. We com- pute the average diurnal cycle of temperature, specific and relative humidity and vapour isotopic composition for these stable synoptic situation periods over different seasons. As synoptic activity can lead to important changes within a few hours, potentially hiding the signal associated with diurnal variations, a filtering method has been implemented to com- pute these average diurnal variations. We select periods for
which the horizontal wind speed is always below 5 m s−1 during at least 24 h. This criterion allows for the elimination of the influence of important synoptic event changes, and the variations of the observed ambient air are affected by local processes rather than large-scale transport changes.
No diurnal cycle is seen in any of the parameters for win- ter and autumn (not presented), which is the period domi- nated by polar night. In summer (see Supplement Fig. S5), an average temperature diurnal cycle is found for stable syn- optic periods with an amplitude of 3◦C, which is lower than the typical amplitude of synoptic variations during this sea- son (around 10◦C, see Fig. 2; for averaged diurnal cycles, see Supplement Fig. S5). For these periods of stable synoptic conditions, the average diurnal variations of specific humid- ity are not significant in summer compared to the synoptic variability (the amplitude of the mean cycle is lower than the standard deviation).
The observed summer average diurnal cycle of relative hu- midity (average amplitude of 13.4 %) is probably due to the diurnal variations of temperature, which are not followed by any diurnal variations of the specific humidity. As for the specific humidity signal, there are no significant average di- urnal variations of any vapour isotopic signals (δ18Ov,δ2Hv ord-excessv) for either season.
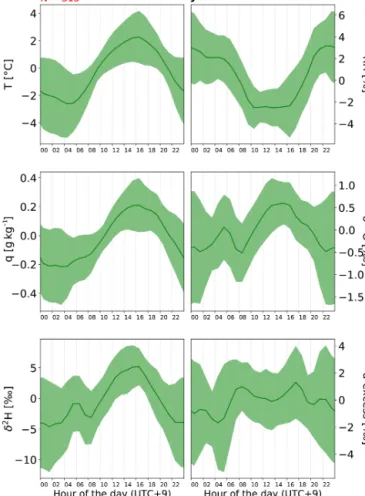
During spring, strong changes occur regarding tempera- ture, specific humidity, isotopic composition and insolation within a few weeks. Analyses of the average diurnal cycle for days of stable synoptic conditions over a 3-month period from March to May do not reveal any significant diurnal vari- ations of the specific humidity and vapour isotopic composi- tion. However, a comparable analysis over the month of May only, when the daily variations of the insolation are maxi- mal, reveals significant average diurnal variations (Fig. 5) for temperature (with an amplitude of 4.9◦C), relative hu- midity (amplitude of 5.4 %), specific humidity (amplitude of 0.4 g kg−1),δ18Ov (amplitude of 1.1 ‰) and δ2Hv (am- plitude of 10 ‰). The diurnal cycle is not significant for d-excessv compared to the observed variability and is also smaller than the instrumental precision.
4 Discussion
4.1 Temporal variations of the water isotopic composition
Comparing the precipitation and vapour isotopic composi- tion reveals a large offset for theδ values and the d-excess values. To investigate the reason for this offset, we calcu- late a theoretical vapour isotopic composition from the pre- cipitation samples. Important assumptions are made for this calculation, leading to uncertainties on the calculated the- oretical isotopic values. We use the temperature measured at 2 m of height at the time of the sampling for the deter- mination of the equilibrium fractionation coefficients. Con-
Figure 5.Average daily cycle in May for the selected days of sta- ble synoptic conditions (wind speed below 5 m s−1over 24 h) for T (◦C), RH (%),q(g kg−1),δ18Ov(‰),δ2Hv(‰) andd-excessv (‰). The daily cycles are calculated with the stacked anomalies compared to the daily average. Local time (UTC+9) is used to present the results.
sidering a 24 h uncertainty on the real time of the precipi- tation, and consequently on the temperature, leads to mean variations of 0.45 ‰, 4 ‰ and 0.7 ‰ inδ18O, δ2H and d- excess, respectively. The temperature at which the precipita- tion is formed is also different from the temperature at 2 m.
As the Arctic regions are mostly dominated by low clouds (Cesana et al., 2012), considering a wet adiabatic lapse rate of−6.5◦C km−1and clouds at 2 km above the ground level, we estimate the uncertainty linked to the cloud elevation of 0.5 ‰, 4 ‰, and 0.6 ‰ inδ18O,δ2H andd-excess, respec- tively. Finally, the main uncertainty is associated with the choice of an equilibrium fractionation between vapour and the condensed phase, which can be either liquid or solid. We chose to use fractionation coefficients with the liquid phase for positive temperatures and with the solid phase for nega- tive temperatures. Considering an uncertainty on this choice of coefficients for data with temperatures ranging from−10 to+10◦C would lead to mean differences for these data only
of 3.8 ‰, 18 ‰ and 12 ‰ inδ18O,δ2H andd-excess, respec- tively. Altogether, considering these uncertainties, the calcu- lated theoretical vapourδ18O andδ2H (δ18Ov,thandδ2Hv,th) agree with the measured δ18Ov and δ2Hv during summer, spring and autumn (Fig. 2). The calculated theoretical and measured summer and autumnd-excess values also match, showing that precipitation is in equilibrium with vapour dur- ing these seasons (Fig. 2). However, large discrepancies re- main between the winter and spring calculated theoretical and measured vapour d-excess signals (Fig. 2), which can- not be explained only by the uncertainty of the theoretical calculations, indicating either that the precipitation formed from a different moisture source than the measured vapour at the surface or that kinetic fractionation occurs during the for- mation of precipitation during this period, as expected from the theory of snow crystal formation under supersaturation (Jouzel and Merlivat, 1984).
The absence of a significant diurnal cycle in specific hu- midity and water vapour isotopic composition at our site in summer differs from observations at the more southerly lo- cated western Siberian station Kourovka (Bastrikov et al., 2014), where the summer signal is dominated by the diurnal cycle, which has been attributed to a strong contribution of local evapotranspiration to the moisture budget. The absence of a clear diurnal cycle at the Samoylov site also differs from other high-latitude polar locations, like the interior of Green- land and Antarctica, where strong diurnal cycles have been recorded during summer (Casado et al., 2016; Ritter et al., 2016; Steen-Larsen et al., 2014) and attributed to exchange processes between the vapour and the snow-covered surface, which is not the case for our site, where the surrounding area consists of vegetated areas, small lakes and the river network of the Lena delta in summer. The diurnal temperature vari- ations at Samoylov are also small compared to observations at Kourovka. Since eddy covariance observations performed on Samoylov Island (Helbig et al., 2013) have revealed max- ima of evapotranspiration concomitant with peaks of net ra- diation in June, diurnal exchanges of moisture between the atmosphere and the surface exist in summer. It is therefore unlikely that the absence of a diurnal cycle of specific hu- midity and vapour isotopic values at Samoylov could be ex- plained by insufficient diurnal variations of incoming radia- tion in summer. Another explanation would rather be that the isotopic signal of the evaporation flux is too similar to the boundary layer water vapour isotopic signal to cause a signif- icant diurnal isotopic variation even in the case of significant evaporation. Altogether, the diurnal cycles of the boundary layer specific humidity and its isotopic composition, which are too small to be identified among the variabilities linked to the synoptic activity, are not the appropriate parameters to evaluate the impact of local evaporation at our site.
Contrary to the rest of the year, a diurnal cycle of the spe- cific humidity and water vapour isotopic composition is ob- served in May. This diurnal cycle might be caused by local moisture exchanges with the surface, as it is the case over
the interior of Greenland and Antarctica in summer. In these polar locations, summer diurnal cycles of the water vapour isotopic composition have been related to sublimation of the snow cover when the insolation is high and condensation occurs during the night (Casado et al., 2016; Ritter et al., 2016; Steen-Larsen et al., 2014). At our site, sublimation of the snow cover would be possible only until the end of May when the snow cover, composed of winter precipitation withδ18Ov values situated between−20 ‰ and−30 ‰, is present. Its sublimation would create moisture with δ18Ov values higher than the boundary layer water vapour (mean monthlyδ18Ov of −38.6±4.0 ‰), which is coherent with the observed diurnal variations. Such a sublimation process is probably not sufficient to drive significant diurnal varia- tions of the isotopic composition earlier in the season as the insolation is still low (and even less in winter during polar night).
Concerning the seasonal variations of the water vapour isotopic composition, theδ18Ovvalues are primarily driven by the variations of temperature and humidity, following the principles of Rayleigh distillation. A possible explanation for the enriched values ofδ18Ov observed at temperatures be- low−20◦C is that the contribution of local moisture sources strongly impactsδ18Ovsignals in already very dry air.
The late autumn–early winter maximum ofd-excessvob- served at Samoylov is similar to water isotopic measure- ments from precipitation samples along the Lena River in Zhigansk (66.8◦N, 123.4◦E; 92 m a.s.l., approximately 635 km south from Samoylov station), depicting a maximum ofd-excessvfrom October to December (Kurita, 2011). This peak ofd-excessvhas been interpreted as a signal linked to sea ice growth in the Arctic Ocean and fast oceanic evapo- ration occurring at low relative humidity during this period.
Maxima ofd-excessvin late autumn have also been observed in different locations, in particular around the North Atlantic sector (Bonne et al., 2014; Steen-Larsen et al., 2015). The very low relative humidity values above the ocean where evaporation takes place in this season could explain these highd-excessv values (Pfahl and Sodemann, 2014; Steen- Larsen et al., 2014). The other spike ofd-excessvobserved in April–May is not concomitant with low relative humidity.
It might, however, be an indicator of sublimation processes taking place. During this period, temperatures are still low but rapidly rising (monthly average temperatures of−8.4◦C in May), snow cover is decreasing, and the solar radiation increases with important diurnal variations. The interpreta- tion of this highd-excessvperiod as an effect of sublimation agrees with our explanation of the diurnal cycle observed in May.
4.2 Moisture sources variations at the seasonal scale Changes in the moisture sources can affect water stable iso- topic composition. Firstly, due to the link between tempera- ture difference and spatial transport, the longer the moisture
has been transported from the evaporation source, the more distillation an air mass might have undergone on the way.
Secondly, the meteorological conditions at which the evapo- ration takes place will influence the isotopic composition of the initial vapour. Finally, different (primary and secondary) evaporation sources can have different isotopic signals. We focus here on the seasonal changes in the moisture sources from the averaged outputs of the semi-Lagrangian backward- trajectory simulation and moisture source diagnostics over different seasons (Figs. 5 and 6).
The overall amount of evaporation is strongly season- dependent (Fig. 6), which is reflected in the seasonality of the specific humidity measured at our site. During the win- ter months (December, January, February; DJF), the area with the highest moisture uptakes is situated above the Bar- ents and Norwegian seas (Fig. 6a). The moisture origin is therefore particularly distant from our site, and long- distance transport dominates over local processes. For spring (March, April, May; MAM) and autumn (September, Octo- ber, November; SON), enhanced continental evaporation is observed over a large part of Siberia in contrast to winter.
The main moisture uptake is located along the northern part of the Lena River basin. Minor oceanic sources are also re- vealed in some areas of the Arctic Ocean (Fig. 6d). In spring, only parts of the Barents and Norwegian seas depict moisture uptake, while it is also the case for the Laptev, Kara and East Siberian seas in autumn (Fig. 6b), which is coherent with the sea ice covering these last regions in spring, preventing oceanic evaporation, but not during the first autumn months.
In summer (June, July, August; JJA), more air masses orig- inate from the western Arctic Ocean than in winter. Despite the large ice-free surface in the Arctic during summer, the moisture uptake remains very low over the Arctic Ocean compared to the evapotranspiration taking place locally over the continent (Fig. 6c). The most predominant moisture up- take occurs locally above continental areas, mainly south- west of our site (Fig. 6c). Local vegetation, lakes, ponds and rivers are the potential sources of evapotranspiration which can generate such regional moisture uptake in summer (due to the absence of snow and ice cover in this season).
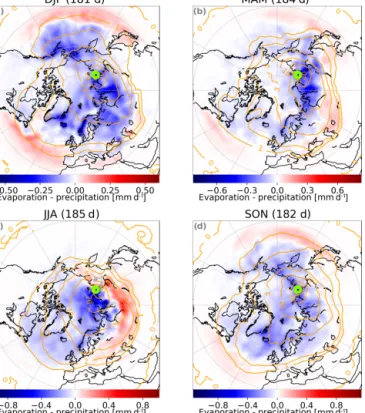
For all seasons, the average difference between evapo- ration and precipitation shows a general pattern of domi- nant precipitation at high latitudes and dominant evaporation at low latitudes (Fig. 7). The limit at which the precipita- tion prevails over evaporation is different for continental and oceanic regions. It is relatively stable around 50◦N above the ocean, but its latitude varies from 60◦N in summer to 45◦N in winter over the continent (Fig. 7). At our site, precipitation is always predominant over evaporation in any season.
The local moisture uptake in the region surrounding the station, in particular in summer, can, however, contribute to the water vapour isotopic signal, even if evaporation is lower than precipitation. Local evapotranspiration sources exist in summer, such as vegetation, ponds, lakes and the Lena River.
As these sources are not active during the cold seasons, subli-
Figure 6.Seasonal averages of boundary layer moisture uptake (mm d−1) for the period 1 July 2015 to 1 July 2017 (North Pole Lambert azimuthal projection) for(a)winter,(b)spring,(c)summer and(d)autumn. The orange contour lines indicate the trajectory lo- cations (as percentage of maximum value: 80 %, 40 %, 20 %, 10 %, 5 %, 2 %, 1 % and 0 %). The green circles indicate the location of the Samoylov station.
mation of the snow cover can act as a local moisture source, as previously suggested from the diurnal cycle revealed in spring.
4.3 Seasonal versus synoptic variabilities and water vapour isotopic composition
4.3.1 Influence of the wind origin
To evaluate the impact of these seasonal moisture origin changes on the water vapour isotopic composition, we focus in this section on the statistical distribution of specific humid- ity and isotopes as a function of the wind direction observed at our site (Fig. 8).
The summer season (JJA) presents a relatively homoge- neous wind distribution: winds from all sectors represent be- tween 4.3 % and 8.6 % of the observations (Fig. 8). No wind sector is exclusively associated with a single range of spe- cific humidity or water vapour isotopic values, but the fre- quencies of occurrences for these values still vary with the wind direction. However, the highest values of specific hu- midity originate from the south-south-east, thus along the Lena River basin (Fig. 8a). The most enrichedδ18Ovvalues
Figure 7.Same as Fig. 6, with colours indicating the seasonal av- erages of evaporation minus precipitation (mm d−1): red (blue) in- dicates regions where evaporation is stronger (weaker) than precip- itation.
and the lowestd-excessvvalues derive from a wide range of western sectors, while a higher proportion of depletedδ18Ov values and the highestd-excessvvalues are associated with air masses originating from the east (Fig. 8b, c). This pro- vides a potential way to differentiate between the moisture sources originating from the Atlantic and the Pacific sectors.
We investigate the coldest months, from December to April (DJFAM), as they are the relevant months to contribute to the interpretation of the paleoclimate data retrieved from ice wedges in our research area (the ice wedges being formed from the melting of the snow deposited during this period).
In contrast to the summer period, the cold month wind distri- bution exhibits a strongly predominant situation, with most winds originating from the south-south-east (20.6 %) and the south sectors (16.3 %), i.e. along the orographic barrier of the Verkhoyansk Mountains. As for the summer season, all wind sectors present similar ranges of specific humidity and water vapour isotopic composition, but with different distri- butions. The south and south-south-east sectors are associ- ated with a stronger proportion of very dry air (between 0.1 and 0.6 g kg−1; Fig. 8d) and of the isotopically most depleted vapour (δ18Ov below −45.7 ‰; Fig. 7e) compared to the other sectors. These very lowδ18Ovvalues associated with air masses originating from the continent are consistent with the absence of moisture uptakes above a large part of the con-
tinent during this period (Fig. 7). These air masses therefore undergo a strong isotopic distillation above the continent be- fore reaching our site. For the air masses originating from the south-west, north-west or north-east, some significantly closer moisture sources can contribute to the isotopic com- position of air masses (significant moisture uptakes exist in the North Atlantic and North Pacific sectors, as depicted in Fig. 7). This is reflected in a higher proportion of highδ18Ov values for these wind sectors compared to the air masses originating from the south and south-south-east sectors. The most enriched air masses (δ18Ovabove−30.7 ‰) originate from the north-west sector (Fig. 8e).
4.3.2 Influence of the moisture source
As previously described, notable differences in water vapour isotopic composition exist between wind sectors during the winter season, in particular for the extreme high and low δ18Ovvalues. As the local wind direction only provides in- formation on the final step of air mass transport, we further investigate the outputs of the moisture source diagnostics as- sociated with synoptic events of extreme isotopic values.
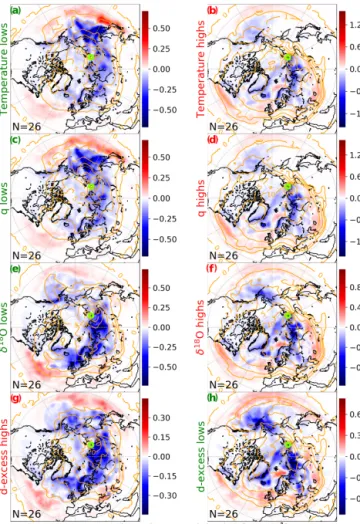
For the coldest months (December to April), a selection of extreme values based on the distance to a 60 d running average for temperature, the logarithm of specific humidity, δ18Ov andd-excessv shows strong similarities for the dif- ferent parameters considered (Fig. 9 and Supplement Tables S1 and S2). Many synoptic events of short duration occur- ring on a daily timescale are selected independently for the different parameters. However, as seen in Fig. 9, some pat- terns emerge, with periods of several weeks during which extrema are identified for multiple parameters, even if the extrema do always happen on the exact same date for all parameters (see Tables 1 and 2). Two typical situations are predominant: on one side is a typical pattern of high temper- ature, specific humidity andδ18Ovbut lowd-excessv; on the other side is an opposite pattern characterized by low temper- ature, specific humidity andδ18Ovbut highd-excessv. Since the long-lasting events dominate this selection and are usu- ally selected for all parameters, the associated average mois- ture source diagnostics are very similar for all parameters (Fig. 10).
The first pattern (Fig. 10a, c, e, g), characterized by low temperature, specific humidity andδ18Ovbut highd-excessv, is associated with local air masses predominantly originat- ing from the east. Precipitation is stronger than evaporation over all of northern Eurasia as well as all polar and sub-polar oceans. Evaporation is only dominant in very remote loca- tions, like the subtropical North Pacific Ocean and the mid- latitudinal Atlantic Ocean.
The second transport pattern (Fig. 10b, d, f, h), character- ized by high temperature, specific humidity andδ18Ov but lowd-excessv, is associated with the long-range transport of air masses originating from the west. Air masses originate from north-western Eurasia, up to the Lena River on the east-
Figure 8.Percent distribution of(a, d)specific humidity,(b, e)δ18Ovand(c, f)d-excessvfor(a, b, c)the summer months only (June to August) and(d, e, f)the cold months only (from December to April). The percent distributions are given with respect to the different wind directions (WDs).
ern limit, and from the south-western Arctic Ocean. Precip- itation is stronger than evaporation above the northernmost sectors of western Eurasia and over a large part of the Arctic Ocean. However, evaporation is stronger than precipitation over the northern European seas (North, Norwegian, Barents and Baltic) and for continental areas located up to 60◦N. The fast transport of air masses with only moderate precipitation brings moisture from the sources to our site with relatively highδ18Ovvalues for this season.
The moisture sources are much more distant for the first (low temperature) pattern than for the second (high tempera- ture) pattern. With a large temperature difference between the source of moisture and our observation site, a strong isotopic distillation can take place, which would explain the fact that theδ18Ovvalues associated with these atmospheric transport patterns are lower for the first pattern (with low temperature and distant sources).
The second pattern of high temperature in winter previ- ously described presents some similarities to the average summer situation, such as a predominance of air masses orig- inating from the west. If the limit of net evaporation com- pared to precipitation is situated at higher latitudes for the high-temperature pattern than for the low-temperature pat- tern, there are still fewer net sources of evaporation over the continent than in summer.
5 Conclusions
This study presents 2 years of in situ continuous water vapour isotopic observations in the Siberian Arctic on Samoylov Is- land in the Lena River Delta, starting in July 2015.
This new dataset provides information about the moisture isotopic composition, which is complementary to the precip- itation sample isotopic compositions, as they also provide information for dry periods when no precipitation falls. It also allows for comparing the water isotopic composition in both phases and distinguishing periods when precipitation and vapour are at equilibrium (in summer and autumn) or out of equilibrium (during winter and spring). This compar- ison therefore highlights the kinetic fractionation processes occurring during the formation of snow in the cold periods.
The water vapour isotope dynamics are dominated by sea- sonal and synoptic variations. During the coldest months, the observed humidity and water vapour isotopic composition are comparable to summer observations on the East Antarc- tic Plateau. The diversity of isotopic signals associated with long-range-transported moisture from various remote origins has a strong imprint on the vapour isotopic composition ob- served at the Samoylov station.
In summer, the observed diurnal cycle of temperature has a low amplitude and is not clearly mirrored by diurnal cycles of the specific humidity and vapour isotopic compositions;
it is overwhelmed by variations linked to synoptic activity.