Arraying of single cells for
high throughput elemental analysis using LA-ICP-MS
Dissertation
zur Erlangung des akademischen Grades doctor rerum naturalium
Dr. rer. nat.
im Fach Chemie eingereicht an der
Mathematisch-Naturwissenschaftliche Fakultät der Humboldt-Universität zu Berlin
von
M.Sc. Konrad Löhr
Präsidentin: Prof. Dr.-Ing. Dr. Sabine Kunst Dekan: Prof. Dr. Elmar Kulke
Gutachter: 1. Prof. Ulrich Panne 2. Prof. Michael Linscheid Tag der mündlichen Prüfung: 19.09.2019
II
Die experimentellen Arbeiten in dieser Promotion wurden von Oktober 2014 bis Juni 2019 als kooperatives Projekt an der Bundesanstalt für Materialforschung und -prüfung (BAM), der ETH Zürich und der HU Berlin im Rahmen der Graduiertenschule School of Analytical Sciences Adlershof (SALSA) angefertigt.
Reproduced in part from K. Löhr et al., J. Anal. At. Spectrom., 2018, 33, 1579-1587 with permission from the Royal Society of Chemistry, and with permission from K. Löhr et al., Anal. Chem., 2019, 91, 18, 11520-11528, Copyright American Chemical Society.
III
Zusammenfassung
Die induktiv gekoppelte Plasma-Massenspektrometrie (ICP-MS) kann aufgrund ihrer hohen Empfindlichkeit, ihres großen linearen Messbereichs und ihrer Multielementfähigkeit für die Einzelzellanalyse eingesetzt werden. Es gibt zwei Möglichkeiten, einzelne Zellen in den ICP einzuführen, entweder durch pneumatische Zerstäubung von Zellsuspensionen oder durch Laserablation (LA) von auf einem Träger getrockneten Zellen. LA-ICP-MS ist vorteilhaft aufgrund seiner zellgrößenunabhängigen Transporteffizienz zum ICP, sowie aufgrund besserer Kalibrierungskonzepte. Eine weit verbreitete Verwendung von LA-ICP-MS in der Einzelzellanalyse wird jedoch durch deren geringen Durchsatz behindert. Daher wurde in dieser Arbeit der Durchsatz von Einzelzellen-LA-ICP-MS untersucht und verbessert.
Die Zwei möglichen Ablationsmodi, die Bildgebung von Zellen mit subzellulärer Auflösung und die Einzelpunktanalyse (Single Spot Analysis, SSA) von einzelnen Zellen mit einem großen Laserspot werden hinsichtlich ihrer analytischen Gütezahlen (Signal-Rausch- Verhältnis, Präzision, Genauigkeit, Durchsatz) sowie hinsichtlich Bedienungsfreundlichkeit und Effizienz der Datenauswertung verglichen. Hierfür wurden adhärente 3T3- Fibroblastenzellen mit zwei Metallfarbstoffen (mDOTA-Ho, Ir-DNA-Interkalator) angefärbt und mit beiden Modi mehrere Dutzend Zellen vermessen. SSA zeigte einen besseren Durchsatz und bessere Nachweisgrenzen. Außerdem wurde gezeigt, dass > 400 Zellen analysiert werden müssen, um eine zufriedenstellende Statistik für einen quantitativen Vergleich zu erhalten. LA- ICP-MS wurde als zu aufwendig für die Analyse einer derart großen Zellzahl befunden. Daher wurde ein Arraying-Schritt zur Probenvorbereitung integriert, um eine automatisierte LA-ICP- MS-Analyse zu ermöglichen. Zunächst wurde das Arraying mittels hydrodynamischer Fallen mittels eines mikrofluidischen Chips getestet. Leider verhinderte der Chipbetrieb unter Druck in einer Klemmvorrichtung ein erfolgreiches Arraying, so dass eine größere Überarbeitung des Chipdesigns notwendig gewesen wäre. Außerdem wurde eine neuartige Technologie getestet, die sich auf piezoakustisches Mikrotröpfchen-Arraying in Verbindung mit der Bilderkennung von Zellen stützt, und es wurde ein guter Arrayingdurchsatz (550 Zellen h-1) und eine beispiellose Einzelzellengenauigkeit (> 99%) erreicht. In einem Proof-of-Principle-Experiment wurde ein Zellarray von THP-1-Suspensionszellen mittels LA-ICP-TOF-MS analysiert und erstmals gleichzeitig endogene und exogene Isotope einzelner Zellen als Isotopen- Fingerabdrücke mit Nachweisgrenzen von nur wenigen hundert Attogramm gemessen.
Abschließend wurden diese Ergebnisse mit dem derzeit gebräuchlichsten Ansatz zur Single- Cell (sc) -ICP-MS verglichen.
IV
Abstract
Inductively coupled plasma mass spectrometry (ICP-MS) is increasingly used for single-cell analysis due to its high sensitivity, wide linear dynamic range, and multielement capabilities.
There are two ways to introduce single cells into the ICP, either by pneumatic nebulization of cell suspensions, or by laser ablation (LA) of cells dried on a carrier slide. LA-ICP-MS is advantageous due to its cell-size independent transport efficiency, as well as due to the existence of superior calibration concepts. However, a more widespread use of LA-ICP-MS in single cell analysis is hampered by its low throughput. Hence, in this work the throughput of single cell LA-ICP-MS was studied and improved.
First, the two possible ablation modes, i. e. imaging of cells at subcellular resolution, and single spot analysis (SSA) of single cells using a large laser spot are compared regarding their analytical figures of merit (signal to noise, precision, accuracy, throughput), as well as regarding ease of operation and data evaluation. For that, adherent 3T3 fibroblast cells were stained with two metal dyes (mDOTA-Ho, Ir-DNA-intercalator) and several dozen cells were measured using both modes. SSA showed superior characteristics regarding throughput and detection limits. Moreover, it was shown that >400 cells must be analyzed to reach satisfactory statistics for a quantitative comparison of results and LA-ICP-MS was found to be too laborious for the analysis of such large numbers of cells. Thus, it was decided to integrate a single cell arraying step to enable automated LA-ICP-MS analysis. Two different arraying methods were evaluated:
First, arraying via hydrodynamic front trapping of cells using a microfluidic device was tested.
Unfortunately, chip operation under pressure in a clamping device prevented successful arraying, such that a major revision of the chip design would have been necessary. Secondly, and a novel technology relying on a piezo acoustic microdroplet arrayer in conjunction with image recognition of cells was tested and a moderate arraying throughput (550 cells h-1) and an unprecedented single-cell accuracy (>99%) was found. In a proof of principle experiment, a cell array of THP-1 suspension cells was analyzed using LA-ICP-TOF-MS and endogenic and exogenic isotopes of individual cells were detected for the first time simultaneously as isotopic fingerprints of cells with detection limits as low as hundred attogram. Finally, these results were compared to the currently more commonly used analysis method single-cell (sc)-ICP-MS.
V
Table of Contents
Zusammenfassung ... III Abstract ... IV Table of Contents ... V List of Abbrevations ... VII
1. Introduction ... 1
2. Fundamentals ... 3
2.1 Inductively Coupled Plasma Mass Spectrometry (ICP-MS) for cell analysis ... 3
2.1.1 Conventional ICP-MS analysis of liquid samples ... 4
2.1.2 Analysis of single cells using ICP-MS ... 4
2.2 Single-cell arraying technologies ... 12
2.2.1 Microfluidic arraying via hydrodynamic front trapping of cells ... 13
2.2.2 Piezo-acoustic droplet arraying in conjunction with image recognition of cells ... 15
3. Scope of work ... 16
4. Experimental ... 18
4.1 Comparison of LA-ICP-MS imaging and single spot analysis of single cells ... 18
4.1.1 Cell culture ... 18
4.1.2 Staining with Ir-DNA-intercalator and mDOTA-Ho ... 18
4.1.3 Calibration using standards arrayed on nitrocellulose membrane ... 18
4.1.4 LA-ICP-MS operation ... 19
4.1.5 Digestion of cell samples for liquid ICP-MS ... 25
4.2 Hydrodynamic front trapping of cells in microchambers ... 26
4.3 Establishing sc-ICP-MS and testing of cell tagging protocols ... 27
4.3.1 Cell Culture... 27
4.3.2 Cell tagging... 28
4.3.3 sc-ICP-MS ... 28
4.3.4 MALDI-TOF-MS to control complexing behavior of mDOTA and Ho ... 29
4.4 High throughput LA-ICP-TOF-MS and isotopic fingerprinting ... 29
4.4.1 Arraying of calibration standards ... 29
4.4.2 Arraying of single cells and beads ... 30
4.4.3 LA-ICP-TOF-MS ... 30
5. Results and Discussion ... 32
5.1 Quantification of metals in single cells by LA-ICP-MS: Comparison of single spot analysis and imaging ... 32
5.1.1 Imaging analysis of single fibroblast (3T3) cells ... 32
5.1.2 Single Spot analysis ... 35
VI
5.1.3 Comparison of different measurement modes ... 36
5.1.4 Quantification of LA-ICP-MS measurements and validation via liquid ICP-MS after digestion ... 39
5.1.5 Conclusion ... 41
5.2 Single-cell arraying for automated LA-ICP-MS ... 43
5.2.1 Microfluidic single-cell arraying ... 45
5.2.2 Piezo acoustic single-cell arraying approach in conjunction with image recognition of cells 57 5.3 Establishing sc-ICP-MS methods and testing of cell tagging protocols ... 64
5.3.1 A sample introduction system with high transport efficiency for sc-ICP-MS ... 67
5.3.2 Testing of cell tagging protocols ... 73
5.3.3 Conclusion ... 77
5.4 High throughput Laser Ablation ICP-TOF-MS and isotopic fingerprinting ... 78
5.4.1 Single-cell arraying ... 78
5.4.2 LA-ICP-TOF-MS measurement ... 79
5.4.3 Blank correction ... 80
5.4.4 Quantification of cell dyes ... 81
5.4.5 Detection of endogenous isotopes in single cells ... 83
5.4.6 Correlation of isotope intensities ... 85
5.4.7 Conclusion ... 87
5.5 Comparison of LA-ICP-TOF-MS and sc-ICP-SF-MS ... 89
6. Summary and Outlook ... 92
7. Appendix ... 94
7.1 Comparison of different LA modes: single-element measurements ... 94
7.2 Establishing of sc-ICP-MS using the HECIS ... 98
7.2.1 sc-ICP-MS using HECIS standard operation procedure ... 98
7.2.2 sc-ICP-MS data acquisition ... 99
7.3 High throughput Laser Ablation ICP-TOF-MS and isotopic fingerprinting ... 101
7.3.1 Background correction ... 102
7.3.2 Quantification of cell dyes ... 107
Acknowledgements ... 118
Selbstständigkeitserklärung ... 108
Literature ... 108
VII
List of Abbrevations
ARIS aerosol rapid introduction system
BAM Bundesanstalt für Materialforschung und -prüfung cAMP cyclic adenosine monophosphate
CD cluster of differentiation cps counts per second
DMEM Dulbecco’s modified eagle medium DOTA tetraazacyclododecane-tetraacetic acid ELISA enzyme linked immuno sorbent assay ETH Eidgenössische Technische Hochschule FBS fetal bovine serum
G6PDH glucose-6-phosphate dehydrogenase HECIS high-efficiency cell introduction system HEPES Hydroxyethyl-piperazinyl-ethansulfonsäure ICE image composite editor (Microsoft)
ICP-MS Inductively coupled plasma mass spectrometry LA laser ablation
Ln lanthanide
LOD limit of detection LOQ limit of quantification
MALDI matrix assisited laser desorption / ionization mDOTA maleimido-mono-amide-DOTA
PBS phosphate buffered saline PDC piezo dispense capillary PDMS polydimethylsiloxane PFA paraformaldehyde PMMA Polymethylmethacrylat
Q quadrupole
rcf relative centrifugal force RSD relative standard deviation RT room temperature
sc single cell
VIII
SD standard deviation
SEM standard error of the mean SF sector field
sp single particle SSA single spot analysis TOF time of flight
1
1. Introduction
Cells are the basic unit of all living organisms and are often called “the building blocks of life”.
It is not surprising that the study of cells is one of the central topics in the life sciences.
Ensemble analysis of cells and their constituents can already help to answer many important questions, but there are as well many cases where only the study of each individual cell provides crucial information. The quantitative study of single cells, also called cytometry, plays an essential role in medical sciences and diagnostics. For example, every complete blood count encompasses a measurement of white and red blood cell concentration, which is used as indicator for health and disease. Historically this test had to be performed manually by counting the number of cells in a specific volume under a microscope, using a hemocytometer as counting chamber. Nowadays, technological advances have reduced the manual work to perform such a cell count significantly. The first automated device became available in the 1950s with the commercial introduction of the coulter counter, which relied on electrical impedance measurement to determine cell count and size. Measurement devices for single-cell analysis are commonly known under the term flow cytometer. In flow cytometry, a flow of cells through a detector is used to generate a time-dependent signal of a specific parameter. Today, most flow cytometer instruments rely on optical measurements. Optical measurements enable fast and inexpensive access to a wide range of cell parameters. Cells passing through a light beam scatter light, which is exploited in cytometry: while forward scattered light can be used to count and size cells, side scattered light can be used to gain information about structural complexity of cells. Despite similar optical appearance and same genetic information, cells have a huge variety of phenotypes, which is reflected by expressed proteins. Gaining quantitative information about the cellular proteome on a single-cell level is a quite challenging task, considering the low copy numbers of proteins (100 to 106 per cell).1 By the introduction of fluorescence-based flow cytometry in the 1960s, a whole new range of information became accessible bit by bit. Fluorochrome labeled binding reagents (e.g. antibodies) enable the quantitative determination of biomarkers with copy numbers as low as 102 per cell.2 Quantitative information about cellular biomarkers can be used e.g. for cell type classification in basic research, but has as well found numerous applications in clinical diagnostics, e.g. it is most commonly indicated for hematologic cancers.3 Classification of cells is a multidimensional problem. As an example, the different cell classes of the immune system possess 371 different surface proteins. For immunophenotyping (i.e. classification of immune system cells), usually multiple of these surface proteins of the so-called cluster of differentiation
2
family (CD) need to be measured for each cell. Simultaneous measurement of different fluorescent tags can only be achieved for about 10 different fluorescent tags because of their spectral overlap.4 This is not sufficient to reveal the whole complexity of cell types. To enable the study of more than 10 biomarkers at once, a suitable detector was found in inductively coupled plasma mass spectrometry (ICP-MS), where the usually fluorochrome labeled binding reagents are replaced with metal isotope labeled binding reagents.5, 6 ICP-MS is the gold standard in inorganic elemental trace analysis and became popular for biological and biochemical applications due to its multi-element coverage and high sensitivity which is a prerequisite for the detection of metals in single cells.7, 8 Accordingly, ICP-MS can be used for the analysis of endogenous elements of the cell. The endogenous elemental content of a cell is also referred to as the cellular metallome.9 “Metallomics” is a relatively new scientific field which was proposed by Haraguchi in 2004 in order to integrate all research fields related to biometals and complement the -omics field of biological sciences (genomics, proteomics, …).6 Moreover, Haraguchi formulated the challenge of an all-elements analysis of one biological cell in order to obtain metal-fingerprints for the biological species, similar to genetic codes in genes and the amino acids sequence in proteins.9 Metal-fingerprint information was considered useful for e.g. medical diagnosis of health and disease. Moreover, single-cell ICP-MS is a promising tool for in vitro (nano-) toxicity studies, drug testing and cancer research. Because of this great interest in single-cell analysis by ICP-MS, significant research was already carried out over the past decade which was recently reviewed.7, 8 The two major techniques used to introduce single cells into the ICP are either direct introduction of complete single cells, or a laser is used to ablate cells to form a fine aerosol which is then transported into the ICP. While significant technological progress has been made within the past decade regarding single-cell sample introduction into the ICP and the MS detection techniques, there are still great challenges ahead.
The advantages of laser ablation (LA) as sample introduction method are opposed by its low throughput which was considered as the major bottleneck preventing more widespread use.
Moreover, the all-elements analysis of a single cell is still an open challenge. It is the goal of this work to increase the throughput of LA-ICP-MS based single-cell analysis. For that, first, the two possibilities to analyze single cells using LA-ICP-MS, imaging10 and single spot analysis,11 need to be compared. Secondly, to overcome the tedious manual targeting of single cells, an additional sample preparation step to array single cells to enable automated high throughput analysis is considered as very promising. Finally, the elaborated technique should be applied to engage in the challenge of detecting isotopic fingerprints of single cells, i.e. the cellular metallome.
3
2. Fundamentals
2.1 Inductively Coupled Plasma Mass Spectrometry (ICP-MS) for cell analysis
Inductively coupled plasma mass spectrometry (ICP-MS) is often considered as the gold standard in elemental analysis for (ultra-) trace determination with various applications in industry and academia. Especially in the life sciences, this technique is used more and more.12 Pioneered by Houk in the 1980s,13 its success can be explained by a wide linear dynamic working range of 8-12 orders of magnitude, low detection limits in the range of 0.1 to 1 pg g-1, its multi-element capabilities and its ability to determine almost all elements of the periodic table.14 These characteristics make ICP-MS the measurement technique of choice for elemental analysis of single cells. For the different aspects of ICP-MS history, instrumentation and methodologies, excellent reviews and books exist.14, 15 Thus, after a brief introduction to conventional ICP-MS, this theoretical part is focused on the critical technical aspects for single- cell analysis using ICP-MS.
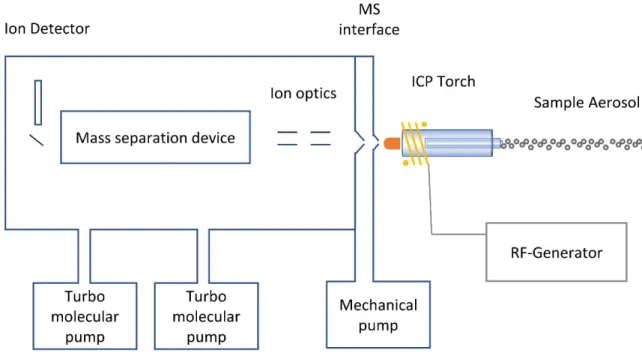
Figure 1 Basic components of an ICP-MS after Thomas et al.15
An overview of the basic components of an ICP-MS is shown in Figure 1. The sample is usually converted into a fine aerosol which is introduced into the ICP torch. The inductively coupled plasma is maintained by a steady argon and energy supply, whereby the energy is provided by the RF generator via a copper coil and consumed by the plasma via electromagnetic interaction.
4
After the aerosol enters the plasma, the sample is vaporized, atomized and finally ionized. The ions are directed via the MS interface and ion optics as a focused ion beam into the mass separation device. The mass separation device separates ions according to their mass-to-charge ratio and guides them to the detector. The detector converts arriving atoms quantitatively to a measurable current, which is typically translated into the commonly used unit counts per second (cps).
2.1.1 Conventional ICP-MS analysis of liquid samples
ICP-MS is usually used with liquid samples which are transformed into a fine aerosol using a nebulizer. This fine aerosol is sprayed into a spray chamber which is connected to the injector of the ICP torch. Spray chambers are usually designed to sort out bigger droplets (d > 10 µm) due to their inertial force using single- or double-pass and cyclonic spray chambers. This is done for two reasons: first, because big droplets might be incompletely atomized and ionized within the plasma and secondly, big droplets result in a less precise signal. Only a small fraction of the total sample enters the plasma as a fine aerosol. Transport efficiencies of conventional systems are in the order of ~1%.15 For more details on conventional sample introduction systems extensive reviews are available.16, 17 In conventional liquid ICP-MS, samples are digested using strong acids in order to dissolve all solids including the analyte. After dilution to lower acid contents (typically 1-2% nitric acid), these liquids can be measured by ICP-MS.
The resulting signal intensity (typically given in counts per second, cps) can be quantified, most commonly an external calibration is used, i.e. comparing the sample analyte intensity to analyte intensities of calibration standards. ICP-MS analysis of liquid samples is most accurate and thus preferably used if enough analyte is available, e.g. for ensemble analysis of cells (typically >106 cells) to unravel mean analyte contents per cell.
2.1.2 Analysis of single cells using ICP-MS
The conventional analysis approach by digestion and liquid ICP-MS is not well suited for the analysis of individual single cells. Besides being very tedious, digestion of single cells and subsequent dilution of the analyte content would likely result in very low concentrations and measurement of aliquots thereof would be below the detection limit. Therefore, in single-cell analysis the analyte, i.e. the whole cell, is measured at once to obtain measurable intensities.
This results in the measurement of a time-resolved peak for each cell, which must be integrated to obtain quantitative information. To lower detection limits, it is a convenient measure to reduce the peak duration. This can be done because the noise level used to calculate the
5
detection limit (standard deviation (SD) of the peak blank) is connected to its peak duration in case of normally distributed noise:
𝑆𝑆𝑆𝑆= 𝑆𝑆𝑆𝑆𝑖𝑖𝑖𝑖𝑖𝑖𝑖𝑖𝑖𝑖
�𝑛𝑛𝑖𝑖𝑖𝑖𝑖𝑖𝑖𝑖𝑖𝑖 = 𝑆𝑆𝑆𝑆𝑆𝑆 (1)
with
𝑆𝑆𝑆𝑆𝑖𝑖𝑖𝑖𝑖𝑖𝑖𝑖𝑖𝑖 = Standard deviation observed for individual measurement
𝑛𝑛𝑖𝑖𝑖𝑖𝑖𝑖𝑖𝑖𝑖𝑖 = Number of individual data points needed to integrate the transient signal
𝑆𝑆𝑆𝑆𝑆𝑆 = Standard error of the mean
Accordingly, as a rule of thumb, reducing peak duration by factor 10 lowers detection limits by 68%. The two major techniques used to analyze the whole amount of analyte in single cells by ICP-MS are either introduction of complete single cells into the ICP, or a laser is used to ablate cells to form a fine aerosol which is transported into the ICP. The strengths and drawbacks of both methods will be discussed in the following chapters.
2.1.2.1 Introduction of complete cells into the ICP-MS
If particles are introduced into the ICP this leads to a very short transient signal lasting 200 to 500 µs. In case of very dilute particle suspensions, these particles enter the plasma statistically one by one and can be separated time resolved. The intensity of such a flash of ions is proportional to the analyte mass of the particle and the frequency is proportional to the concentration of the particles.18, 19 This analysis technique became especially important for studying nanometer-sized materials using conventional pneumatic nebulizers and the measurement methodology was coined as “single particle” (sp)-ICP-MS. This approach was extended to measure cells which are simply regarded as relatively large particles. The resulting measurement mode was coined as “single-cell” (sc)-ICP-MS.
To introduce complete cells into the plasma, the cells must be encapsulated within fine droplets and transported into the ICP. Most eukaryotic animal cells have a diameter of about 8-30 µm and thus are eliminated in conventional spray chambers, as they are designed to sort out droplets with a diameter larger than ~ 10 µm.14 Accordingly, the already relatively poor transport efficiency of ~1% usually decreases further, sometimes until no cells can be detected at all.
6
Already in 1994, the calcium content in single mammalian cells was studied, whereby a transport efficiency of about 0.1% was reached.20 To improve the transport efficiency for single cells, different customized sample introduction systems were developed. The commercial CyTOF™ system (Fluidigm) uses a conventional pneumatic nebulizer and an especially designed on-axis low volume spray chamber which employs a heated make-up gas to evaporate solvent from produced droplets and increase the cell introduction efficiency to 20-30%.21 A high-efficiency cell introduction system (HECIS) was developed by Groombridge et al.22 and a transport efficiency of 100% was reached for microbes smaller 3 µm, which decreased to 86%
for microbes with a diameter of 6.4 µm. However, for larger mammalian cells the transport efficiency was expected to decrease further according to their diameter. Recently, a total consumption nebulizer and spray chamber were used to introduce mammalian cells into the ICP with a transport efficiency of 25%, without the need for additional heating or make up gas.23 Moreover, a commercial single-cell analysis kit was recently presented by PerkinElmer,24 including a direct pass spray chamber which employs a make-up gas (AsperonTM) with a transport efficiency up to 30%, whereby polystyrene particles served as a cell model which had a relatively small diameter (d = 2.5 µm) if compared to mammalian cells.25
In addition, there are approaches where cells are encapsulated within microdroplets of uniform size. Such microdroplets were produced using either commercial microdroplet generators or microfluidic chips, whereby such techniques offer the advantage that they provide a readily available approach for quantification of cellular metal contents.26, 27 Shigeta et al. used a piezo acoustic micro-droplet dispenser in conjunction with a desolvation system to introduce single selenized yeast cells (d = 3-5 µm) into the ICP with a transport efficiency of 100%. However, so far this approach could not be transferred to larger cells. Microfluidic polydimethylsiloxane (PDMS)-based chips were used to encapsulate cells into aqueous droplets within an organic phase prior to analysis via time-resolved ICP-MS. Transport efficiencies of >50% for red blood cells (8 µm) were reached using a liquid-assisted droplet ejection chip and a custom-built transport system including a membrane desolvator for removal of the organic phase.26 In a simpler approach a conventional nebulizer and spray chamber were used and transport efficiencies of ~2% were obtained.28 Microfluidics-based approaches are especially attractive as in the future they could be combined with microfluidic sample pretreatment modules such as separation, dilution or cell sorting, etc.26
The transport efficiency of intact single cells into the ICP is strongly cell size dependent,22 which is a disadvantage as this might lead to a non-representative sampling of smaller cells.
7
Furthermore, sc-ICP-MS so far focuses more on multiplex assays but calibration methods for quantification are not yet well established,29 despite first promising results were achieved recently.23, 30 Quantitative analysis of cells is complicated by the fact that the degree of ionization in the ICP is dependent on cell size and larger cells might not be completely ionized.31
2.1.2.2 Laser Ablation for analysis of cells using ICP-MS
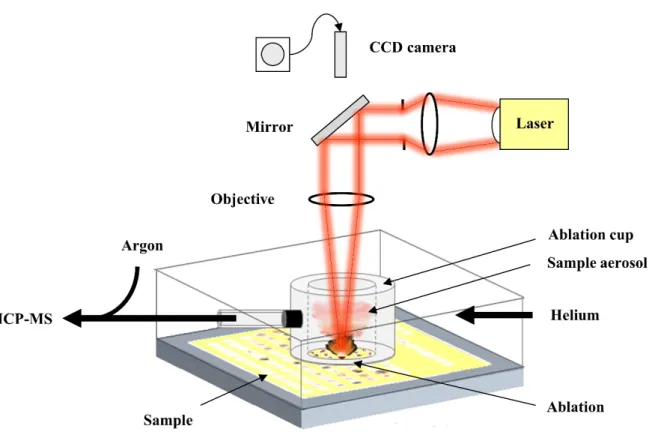
Laser Ablation (LA) for solid sample introduction is a technique which circumvents some of the shortcomings described in the previous chapter elegantly. LA-ICP-MS is more and more applied as a sample introduction technique in the life sciences, most importantly because it enables imaging of analyte distribution e.g. within tissue sections and single cells.32-34 A schematic representation of an LA system is shown in Figure 2. To perform an LA analysis of a solid sample, the sample is placed into the airtight ablation chamberI mounted on an x-y-z stage. Using a microscope with a CCD camera, the optics must be focused on the sample which subsequently can be explored to set an ablation pattern in the LA system software. During ablation, the focused laser beam interacts with the sample and in the resulting plasma of atoms, ions, and particles an aerosol is formed. The ablated sample aerosol is transported into the ICP using a steady flow of helium. Usually, an ablation cup is used to reduce the washout time of the large ablation chamber (this setup is coined as “two-volume ablation chamber”).
For LA, the transport efficiency of cells is not cell size dependent, because a fine aerosol is formed after ablation with particle diameters typically <200 nm.35 Moreover, this aerosol is easier to ionize completely compared to whole cells and thus, quantitative work becomes possible.31 LA is prevalently used for imaging of cells and tissues. Spot sizes down to 4 µm are available in modern LA instruments,II and spot sizes down to 1 µm and below were recently reached.36-39 By lowering the spot size, the time required for imaging a defined area increases quadratically while the signal intensity decreases proportionally. To reduce the analysis time and improve the signal to noise ratio, the washout time of ablation chambers was significantly improved.40 However, the throughput of LA-imaging is too low to gain data for cytometry studies. A possibility to increase the throughput of LA cell analysis is the ablation of complete
I The more commonly used term ‘ablation cell’ will herein be replaced by ‘ablation chamber’ to prevent ambiguity.
II NWR213, (2009, ESI); J100Series, (2010, Applied Spectra); GeoLasPro, (2008, Coherent); and LSX213 G2+
(Cetac) allow 4µm
8
cells using a large laser spot size in a mode coined as single spot analysis (SSA). SSA is useful if the distribution of elements on a single-cell basis is the main research question and presents a promising and readily available alternative to obtain statistically robust cytometry data for cells of any size in a moderate time frame. This approach has been recently used to track single gadolinium labeled CD4+ T cells,11 to quantify nanoparticle uptake of single 264.7 cells,41 to quantify the gold nanoparticle labeled protein integrin on single HEL cells,42 and to quantify Cu in single algae cells.29
Figure 2 Laser Ablation sample introduction scheme. Figure courtesy of S. Hösl.
The commonly applied LA parameters differ between imaging and SSA of single cells. In case of imaging, the laser spot size is usually a trade-off between desired resolution, sensitivity, and analyte content, as well as the required analysis time. The laser irradiance (fluenceIII) must be
III Fluence is more commonly used in the LA community, despite irradiance could provide a more meaningful measure for the applied laser energy per surface.
9
selected carefully, such that several requirements are fulfilled: i) complete ablation of the sample, ii) no ablation of target substrate material to prevent additional background, iii) no translocation of neighboring sections by the laser plume or shock wave. For SSA, every cell must be completely included within the corresponding laser spot, whose size must be chosen accordingly. To be able to ablate a complete cell with only one laser pulse, the irradiance (fluence) is usually chosen considerably higher, although this is a tradeoff due to rising background signals from the substrate.
2.1.2.3 Mass analyzers, detector time resolution and multiplexing
The mass separation device separates ions according to their mass-to-charge ratio (m/z) and guides them to the detector. Depending on the type of mass separation device, ions of a specific m/z can be detected either sequentially (quadrupole and single collector instruments) or quasi- simultaneously (time-of-flight instruments, multicollector instruments) at instrument specific sampling frequencies. In single-cell analysis, transient signals of one or several elements of interest have to be evaluated.
In case complete cells are introduced into the plasma, transient signals have a length of only 200 to 500 µs. Such short signals prevent multiplexing for mass analyzers with sequential detection of different masses. Thus, only instruments with simultaneous data collection can be used for multiplexing. Moreover, the time resolution of the data acquisition is an important factor with implications for the possible throughput and detection limits. Conventional ICP-MS systems allow for integration times down to 1 to 5 ms, which prevents the resolution of transient signals from single cells or particles. Figure 3 depicts the four possible scenarios of several particles (a), exactly one particle (b), fractions of ion clouds from a particle (c, d) or no particle (e). Accordingly, wrongly chosen cell concentration and integration time may alter the obtained distribution of analyte content in the cell population. While a long integration time and high cell concentration may lead to an overestimation of cellular analyte content ((a) favored), short integration times may lead to an underestimation ((c, d) favored). Moreover, in case a long integration time is chosen, detection limits may increase significantly in presence of a background signal.
Newer generation ICP-MS systems allow for very short acquisition times as fast as 105 Hz.
Using short integration times (<50 µs), transient signals of ion clouds from single particles can be completely resolved. Such systems enable analysis with the highest throughput and lowest
10
detection limits.43 Most prominently, in mass cytometry up to 1,000 cells per second can be analyzed time-resolved using an ICP-TOF-MS detector which enables the analysis of all element masses >100 Da (>75 Da with the last instrument generation, HELIOS®).44, 45
Figure 3 Effect of dwell and settling times on single particle measurements. (a) 2 particles detected (b) 1 single particle detected (c) the leading edge of 1 particle detected (d) the trailing edge of 1 particle detected (e) no particles detected. Reproduced from ref. 43 with permission from the Royal Society of Chemistry.
In case LA is used for sample introduction, transient signals which originate from a single cell are significantly longer. A washout time of approximately one second was the standard for ablation chambers when this work was started,II technological progress during conduction of this work reduced washout times to about 10 to 100 ms, depending on the used laser spot size and LA unit.36-39 While washout times around one second enable multiplexing of several elements even on ICP-MS systems with sequential data acquisition,32, 46 shorter washout times in the range of 10 ms usually prevent multiplexing due to the mass analyzer settling times.
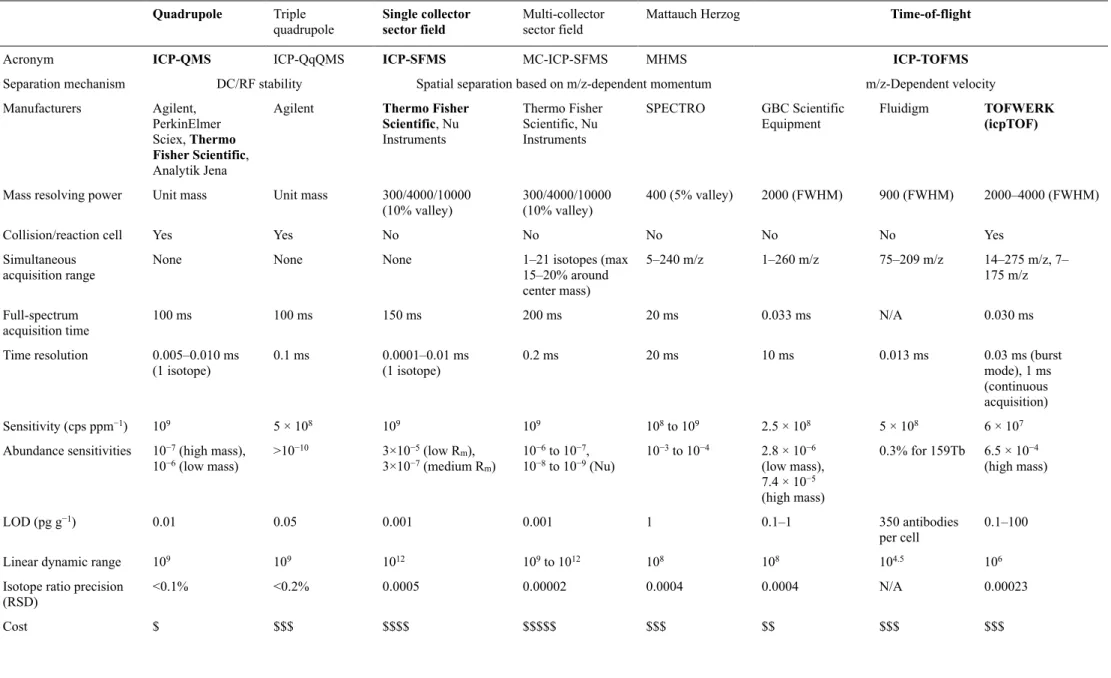
Transient signals originating from single laser pulses (and the ablation of single cells) can be resolved with the predominantly used quadrupole and sector field mass analyzers, as well as with most TOF-MS devices. Table 1 gives an overview of reported figures of merit of ICP-MS devices with different mass analyzers. Devices which were used in the course of the preparation of this thesis are marked in bold.
11
Table 1 Comparison of reported ICP-MS figures of merit. Adapted from ref. 47 with permission from the Royal Society of Chemistry.
Quadrupole Triple
quadrupole Single collector
sector field Multi-collector
sector field Mattauch Herzog Time-of-flight
Acronym ICP-QMS ICP-QqQMS ICP-SFMS MC-ICP-SFMS MHMS ICP-TOFMS
Separation mechanism DC/RF stability Spatial separation based on m/z-dependent momentum m/z-Dependent velocity Manufacturers Agilent,
PerkinElmer Sciex, Thermo Fisher Scientific, Analytik Jena
Agilent Thermo Fisher Scientific, Nu Instruments
Thermo Fisher Scientific, Nu Instruments
SPECTRO GBC Scientific
Equipment Fluidigm TOFWERK
(icpTOF)
Mass resolving power Unit mass Unit mass 300/4000/10000
(10% valley) 300/4000/10000
(10% valley) 400 (5% valley) 2000 (FWHM) 900 (FWHM) 2000–4000 (FWHM)
Collision/reaction cell Yes Yes No No No No No Yes
Simultaneous
acquisition range None None None 1–21 isotopes (max
15–20% around center mass)
5–240 m/z 1–260 m/z 75–209 m/z 14–275 m/z, 7–
175 m/z Full-spectrum
acquisition time 100 ms 100 ms 150 ms 200 ms 20 ms 0.033 ms N/A 0.030 ms
Time resolution 0.005–0.010 ms
(1 isotope) 0.1 ms 0.0001–0.01 ms
(1 isotope) 0.2 ms 20 ms 10 ms 0.013 ms 0.03 ms (burst
mode), 1 ms (continuous acquisition)
Sensitivity (cps ppm−1) 109 5 × 10⁸ 109 109 108 to 109 2.5 × 10⁸ 5 × 10⁸ 6 × 10⁷
Abundance sensitivities 10−7 (high mass),
10−6 (low mass) >10−10 3×10⁻⁵ (low Rm),
3×10⁻⁷ (medium Rm) 10−6 to 10−7,
10−8 to 10−9 (Nu) 10−3 to 10−4 2.8 × 10⁻⁶ (low mass), 7.4 × 10⁻⁵ (high mass)
0.3% for 159Tb 6.5 × 10⁻⁴ (high mass)
LOD (pg g−1) 0.01 0.05 0.001 0.001 1 0.1–1 350 antibodies
per cell 0.1–100
Linear dynamic range 109 109 1012 109 to 1012 108 108 104.5 106
Isotope ratio precision
(RSD) <0.1% <0.2% 0.0005 0.00002 0.0004 0.0004 N/A 0.00023
Cost $ $$$ $$$$ $$$$$ $$$ $$ $$$ $$$
12
2.2 Single-cell arraying technologies
Arraying of single cells has a history of more than one decade and multiple strategies for single- cell capture and isolation have been investigated.48 A perfect single-cell arraying system for subsequent LA analysis should feature the following: a positioning accuracy better than the maximum laser spot size of conventional LA systems (~150 to 250 µm); cells must be accessible for LA, i.e. lie on a flat surface; high throughput; the capability of “true" single-cell deposition, preventing the need to double-check cell-number per spot; and arraying should be cell-size independent.
Many different approaches to array single cells on microfluidic platforms have been studied and successfully applied.49 These approaches rely on different principles, like hydrodynamic cell traps using U-shaped or bypass-channel traps, electrical traps, optical traps, microwells, or trapping of cells using integrated valves. After arraying of cells, microfluidic chips must be removed since cell arrays must be presented on a flat surface. This typically leads to multiple problems, as the initial forces used for cell trapping change and removal of liquids may displace cells due to surface tension forces. To date, only few contributions report arrays produced for mass spectrometric analysis. Urban et al. used a microarray of hydrophilic spots on a hydrophobic plate and produced a cell array by wetting the complete surface with a cell suspension. On hydrophilic spots small droplets containing cells adhered, while the rest of the cells were removed. The number of cells per spot was approximately proportional to the cell concentration and followed a Poisson distribution.50, 51 Xie et al. used a microporous PDMS membrane as a pattern to produce an array of microwells where cells could adhere to a glass slide.52 Krismer et al. used a non-contact-spotter to array droplets containing cells.53 Yang et al.
used a surface printed microdot array where cells could adhere.54 All these approaches used so far for single-cell arraying for mass spectrometry had no method to control the number of cells at array positions. Thus, a lot of events without single-cell information were analyzed and the actual cell number per spot had to be determined in an additional step. To the best of the author’s knowledge, there is only one study with an approach to control single-cell occupancy per spot:
Huang et al. developed an approach similar to Xie et al., but reduced the volume of PDMS wells, such that each spot could host only one cell. By centrifuging the cell suspension into the chip they managed to overcome two major disadvantages of the PDMS well method reported by Xie et al.: due to centrifugal force all wells were wetted with cell suspension and the well occupancy could be increased due to the fast sedimentation of cells. In this way produced cell
13
arrays had the highest single-cell occupancy reported to date (87%).55 However, the relatively small PDMS wells might lead to the sampling of a subset of small cells and therefore this approach might not be representative for the whole cell population. In this thesis, two novel single-cell arraying techniques are tested as sample preparation method for subsequent analysis by LA-ICP-MS, which will be introduced in the following two chapters.
2.2.1 Microfluidic arraying via hydrodynamic front trapping of cells
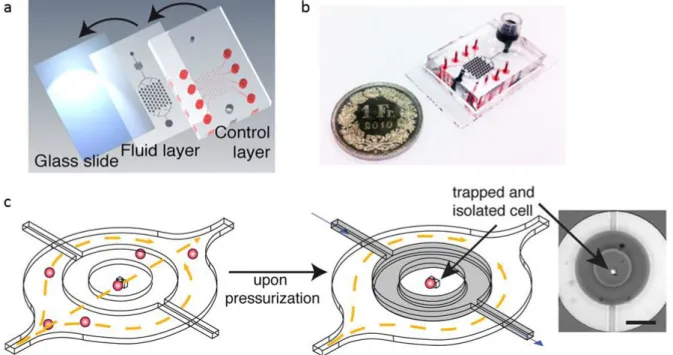
Recently, Eyer et al. introduced a microfluidic chip for single-cell arraying and subsequent chemical analysis of intracellular biomolecules.56 The arraying approach is based on hydrodynamic front trapping using microhurdles and the possibility to isolate each arrayed single cell within a microchamber. This approach enables the sequential exchange of solutions for incubation, washing and labeling steps. In a final step, cells can be lysed for the analysis of intracellular biomolecules within the very small volume of the microchamber. This approach was successfully applied for i) measuring the oxidative stress load (quantification of intracellular NAD(P)H), ii) measuring variations of glucose-6-phosphate dehydrogenase (G6PDH) levels, iii) cytotoxicity tests using suspension cells (U937).56 Moreover, Eyer et al.57 used this chip design for single cell ELISA, e.g. for the quantification of the enzyme GAPDH in suspension and adherent cells (U937, HEK 293) using sandwich ELISA, and to determine the concentration of the secondary messenger cyclic adenosine monophosphate (cAMP) in adherent cells (MLT) using competitive ELISA. Detection limits of intracellular biomolecules were found to be extraordinary low due to the very small volume of microchambers of only few hundred picoliters. Depending on whether suspension or adherent cells were used, different single-cell occupancies of microhurdles were obtained; while for suspension cells up to 75%
single-cell occupancy was achieved, for adhesive cells only up to 27% was achieved, respectively. Figure 4 shows the design and operation of the microfluidic device for single-cell analysis. The microfluidic device consists of multilayered PDMS, comprising a control layer, a fluid layer, and a glass microscope cover slip. For manufacturing, first the control layer is bonded to the fluid layer, which then is bonded onto a microscope cover slip, see Figure 4 (a) and (b). To introduce and trap a cell inside the microhurdle feature and to deliver compounds to trapped cells, a cell suspension or compound solution is pumped through the fluid layer, see Figure 4 (c, left, fluid flow from left to right). The trapped cell can be isolated from the environment inside a microchamber by actuation of a ring-shaped valve, see Figure 4 (c, middle, gray colored). Microhurdles consist of two pillars which were shaped to accommodate a single cell. The closing of ring-shaped valves was realized by hydraulic pressurization of the
14
control layer, which leads to a displacement of the thin fluid layer ceiling in such way that it is pressed directly against the rigid bottom of fluid layer channels (a glass cover slip). Figure 4 (c, right) shows a micrograph of a trapped fluorescing cell surrounded by a non-fluorescing solution tightly encapsulated in a microchamber after actuation of the ring-shaped valve. The tightness of the microchamber was demonstrated by flushing the fluid layer with a fluorescing solution, which led to the high fluorescence intensity in the fluid layer channel outside the ring- shaped valve.
Recently, the approach was successfully adapted for analyzing smaller microbes E. Coli58 and Saccharomyces cerevisiae, including successful on-chip cultivation of the latter microorganism.59 Moreover, a detailed comprehensive overview about experimental methods, i.e. the fabrication of the microfluidic device, its operation, and its possible conduction of different experiments like single-cell ELISA is available.60
Figure 4 Design and operation of the microfluidic device for single-cell analysis. (a) Scheme of layers required for microchip fabrication. (b) Photograph of the device; the picture shows the fluid reservoir for the application of different reagents and fluid channels, both filled with black food dye, whereas pressure channels are filled with red food dye. (c) Scheme of a microhurdle and single-cell capture and isolation within a microchamber. On the right a single trapped fluorescing U937 cell can be seen inside a closed microchamber, whereas the remaining fluid layer liquid was exchanged with fluorescent solution (scale bare 150 µm). Adapted with permission from 57. Copyright (2013) American Chemical Society.
15
2.2.2 Piezo-acoustic droplet arraying in conjunction with image recognition of cells Another novel single-cell arraying approach was developed during the preparation of this thesis by cellenion, which will be evaluated as an alternative sample preparation method for automated LA-ICP-MS. The approach relies on a piezo-acoustic spotter (sciFLEXARRAYER S3 with sciDROP PICO, Scienion AG) and an automated software package for image recognition of cells within the piezo dispense capillary (PDC) prior to spotting (cellenONE®, cellenion SASU). After performing automated cell recognition in the PDC, an algorithm decides whether the next droplet will be dispensed onto the target array or discarded into the waste station (Figure 5). For that, the PDC is divided into travel, sedimentation and ejection zone. The ejection zone of the PDC corresponds to the volume which is ejected from the PDC with the next droplet. Accordingly, cell(s) located within the ejection zone will be ejected with the next droplet. The sedimentation zone is a “safety” zone, used to prevent additional cells from sedimenting into the ejection zone while the PDC is moving from the camera station to the arraying position. The travel zone is defined as the zone upward of the sedimentation zone.
Figure 5 depicts four possible scenarios: A droplet containing a single cell will only be generated if exactly one cell is present in the ejection zone and no cell is in the sedimentation zone (A). In case of scenario (A), the PDC is moved by the axis system to the target position and a droplet containing a single cell is dispensed onto the target. After each single-cell dispensing, the PDC is repositioned by the axis system to the camera station and the process is repeated until every array position is filled with a single cell. In all other scenarios (B, C, and D), the next droplet will be discarded.
Figure 5 Scheme describing the three PDC zones and different possible scenarios of cells’ positions in the PDC. (A) single-cell condition: a single cell present in the ejection zone and no cells in the sedimentation zone. (B) no cells are present in the ejection zone; (C) multiple cells are present in the ejection zone; (D) a single cell is present in the ejection zone but at least one cell is present in the sedimentation zone.
16
3. Scope of work
It is the aim of this thesis to increase the throughput of LA-ICP-MS analysis of single cells. To reach this goal, this thesis is divided into three parts: (1) comparison of approaches to analyze single cells using LA-ICP-MS, (2) testing of single-cell arraying approaches, (3) high throughput analysis of an array of single cells.
First, the two possible ways to analyze single cells using LA-ICP-MS, imaging and single spot analysis (SSA), are compared. Compared with the low throughput of imaging of single cells by line scans, the throughput can be conveniently increased by SSA. The analytical figures of merit for both LA operation modes have not been compared yet and are investigated in this work.
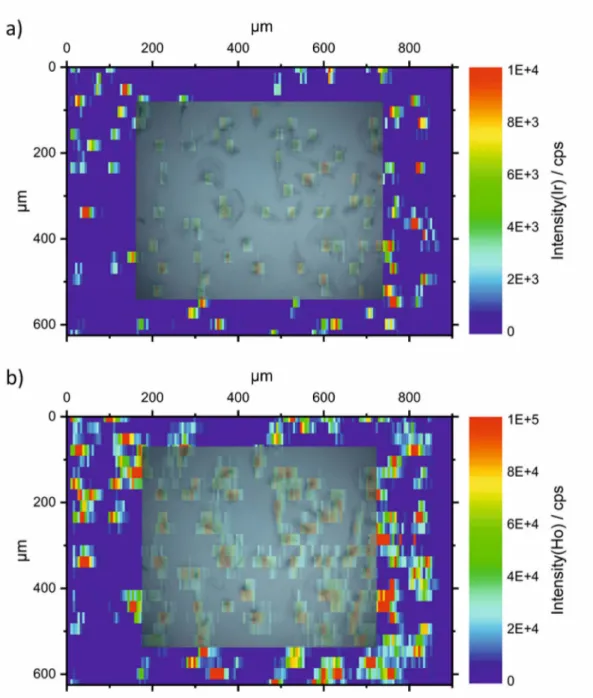
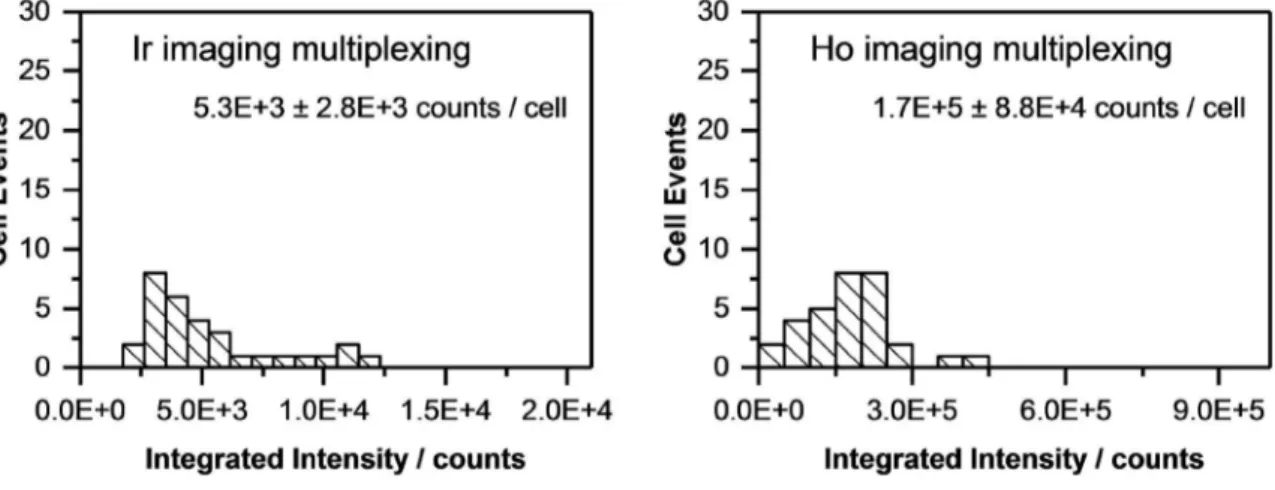
Besides differences in throughput, differences in signal to noise ratio are expected, because in imaging mode a given absolute amount of analyte in a cell is represented by the total intensity divided by the number of pixels, while in SSA the total amount of a metal in a cell is represented by just a single intensity measurement. The sensitivities achieved in LA-ICP-MS depend on the matrix and the applied LA parameters.61-63 Thus, for reliable quantification matrix matched standards are required, which have to be ablated using the same LA parameters as used for the sample.64 Considering that laser spot size and irradiance differ significantly between standard imaging conditions and standard single spot analysis conditions, it is questionable whether both LA modes give comparable quantitative results. Moreover, the ICP-MS data acquisition parameters can influence the results as well. Multiplexing is one of the big advantages of ICP- MS, but can lead to a compromised measurement precision, if multiple elements are measured sequentially – as is common for the most widespread mass analyzers in ICP-MS, like quadrupole and sector field (SF) based instruments. Therefore, not only the differences between imaging and single spot analysis but also the influence of multi- and single-element data acquisition are evaluated. As a model sample, single 3T3 cells are grown on a glass slide and stained using a recently developed method involving two metal-conjugated dyes to identify and visualize single cells. Following the protocols developed in a previous study,65 the complete cell is stained using maleimido-mono-amide-DOTA(holmium) (mDOTA-Ho), which binds to free thiol groups of e.g. proteins, and an Ir-DNA-intercalator to stain the corresponding cell nuclei. The aim of this first study is to compare the analytical figures of merit obtained for determination of dye metals in single cells using these two LA modes (imaging and SSA) measured with a sector field (SF-)ICP-MS, including the measurement accuracy after adequate calibration.
17
Secondly, the two promising approaches for single-cell arraying introduced in the theoretical part are tested for their suitability to increase the throughput of single-cell LA-ICP-MS. First, the microfluidic single-cell arraying approach is tested. The approach relies on hydrodynamic front trapping and was developed to analyze intracellular biomolecules in single cells. Secondly, the novel single-cell arraying technology relying on a piezo acoustic microdroplet arrayer in conjunction with image recognition is evaluated.
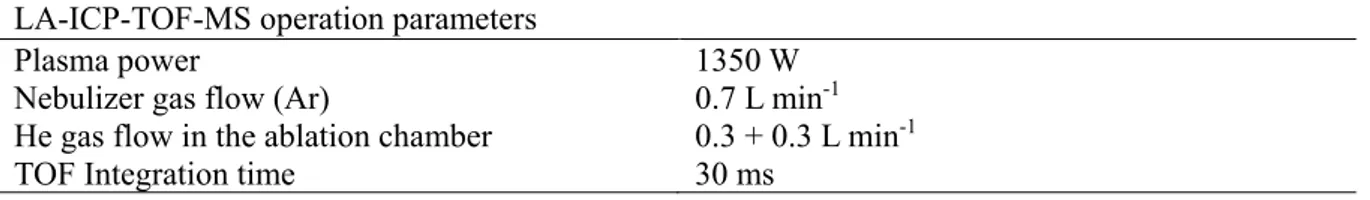
Finally, a single-cell array of THP-1 cells is produced using the microarrayer and analyzed using LA-ICP-MS with high throughput. For that, a protocol to tag THP-1 suspension cells with the two cell stains mDOTA-Ho and Ir-DNA-intercalator is developed and tested using sc-ICP- MS. Subsequently, these two cell stains are quantified using a recently introduced calibration approach which is suitable for high throughput analysis.41 Furthermore, the isotopic fingerprints of endogenous elements of a mammalian cell line are studied for the first time using a state-of- the-art ICP time-of-flight (TOF) MS.
18
4. Experimental
4.1 Comparison of LA-ICP-MS imaging and single spot analysis of single cells 4.1.1 Cell culture
Swiss albino mouse fibroblast cells (3T3, DSMZ) were cultured in Dulbecco’s modified eagle medium (DMEM) supplemented with 10% fetal bovine serum (FBS Superior) (FBS and DMEM from Biochrom AG) and grown under standard conditions (37°C and 5% CO2). For the experiments, the cells were grown for 24 h on sterile coverslips (Menzel Gläser GmbH, 20 x 20 mm) directly on 4-well Lab-Tek™ chamber slices (Thermo Fisher Scientific). The cells were washed three times with phosphate buffered saline (without calcium and magnesium (PBS w/o Ca/Mg, Biochrom AG) and immediately fixed with Histofix (Carl Roth GmbH). After fixation, the cells were washed again with PBS w/o Ca/Mg (three times). Fixated cells can be stored in buffer up to 2 months at 4 °C.
4.1.2 Staining with Ir-DNA-intercalator and mDOTA-Ho
Staining of cells was carried out according to recently optimized procedures.65 The Ir-DNA intercalator stock solution (Maxpar® Intercalator-Ir 500 µM, Fluidigm) was diluted with PBS w/o Ca/Mg to an optimized concentration of 0.25 µM. Fixed 3T3 fibroblasts were incubated in the diluted Ir-intercalator for 45 min at room temperature. Before the next dying step, the cells were washed five times with 1 mL PBS w/o Ca/Mg. Maleimido-mono-amide-DOTA (mDOTA, CheMatech SAS) binds to free thiol groups, which are mainly present in proteins in the cell.
Moreover, the DOTA moiety was used to chelate the lanthanide(III) isotope Holmium (Ho).
Detailed information about loading of DOTA-chelate complexes with lanthanide ions is given elsewhere.6 Cells were incubated at a mDOTA-Ho concentration of 0.5 µM in PBS w/o Ca/Mg for 45 min at room temperature. Finally, cells were washed five times with PBS w/o Ca/Mg and dehydrated in a graded series of ethanol prior to LA-ICP-MS analysis.
4.1.3 Calibration using standards arrayed on nitrocellulose membrane
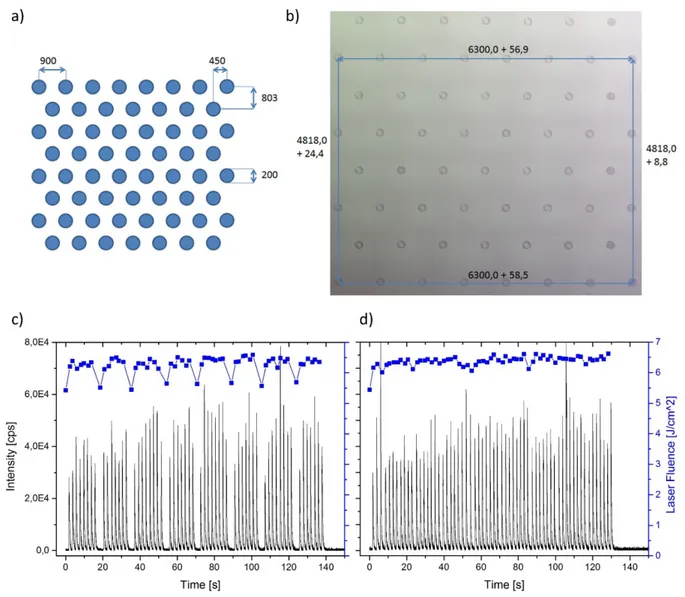
The metal content of cells was quantified in accordance with Drescher et al.10 by spotting of standards onto nitrocellulose (NC) membranes. For this purpose, a calibration series of a mixture of ICP-MS standard solutions (CertiPUR, Merck KGaA) containing holmium and iridium was prepared and diluted to concentrations of 0.05 mg L-1, 0.1 mg L-1, 0.5 mg L-1, 1 mg L-1, 5 mg L-1, and 10 mg L-1 for each element. In deviation from the work of Drescher, the
19
dilution series was spotted with a microarrayer system onto a nitrocellulose coated glass slide (ONCYTE® SuperNova, thickness <20 µm, GRACE bio-labs). As microarrayer system, the Bio Odyssey Calligrapher Mini Arrayer (Bio-Rad Laboratories Inc.) equipped with a solid pin with a spot square side of 75 µm (type 946NS3, Arrayit corporation) was used. For calibration, the printed membrane with the calibration series was ablated in imaging mode, because the dried spots of the spotted calibration series had a size of ~300 µm, which exceeds the largest laser spot size available (250 µm for the herein used NWR213 (ESI)). For ablation, the exact same LA-ICP-MS settings as used for imaging of cells were used, see chapter 4.1.4. The nitrocellulose layer was ablated completely, as was confirmed by ablating at several positions again and by visual inspection, whereas no visible traces of the nitrocellulose layer could be found. Finally, for each used concentration the integrated signals of two replica were averaged before the calibration function was fitted.
4.1.3.1 Validation of the arrayer system
Validation of the arrayer system was performed in collaboration with S. Techritz and Dr. L.
Müller by dissolving flexible membranes (Whatman) with spotted calibration standards and subsequent quantification using liquid ICP-MS. For determination of the delivered volume, a nitrocellulose membrane was printed with 10 grids, consisting of 4 x 4 spots each. These grids were cut out, the membrane pieces were dissolved in concentrated HNO3, diluted with water (purified to 18.2 MΩ using a Millipore Milli-Q water system) and measured against a standard calibration series with an ICP-SF-MS (Element XR, Thermo Fisher Scientific). The reproducibility of the spotting process was verified by measurements on different days and the delivered volume of the pin was determined to 0.61 nL ± 0.14 nL. Furthermore, the relative spot-to-spot standard derivation was determined to be less than 10% by LA-ICP-MS.
4.1.4 LA-ICP-MS operation
Investigations were carried out using the LA system NWR213 equipped with a two-volume ablation chamber (ESI) coupled to an ICP-SF-MS (Element XR, Thermo Fisher Scientific). The ICP-MS was synchronized with the LA system using the LA system in external trigger mode.
20
4.1.4.1 Laser Ablation
LA conditions for imaging by line scans were optimized in advance to these measurements and as similar conditions as possible were applied for both LA modes, imaging and SSA, see Table 2. However, complete ablation of a single cell by a single laser pulse was not possible.
Therefore, for the ablation of single cells using a single spot, ablation conditions had to be optimized separately for this study: Even if a very high laser fluence of 10 J cm-² was used, occasionally a little dark spot remained on the microscopic slide. Such dark spots remained predominantly in cases where the cell nucleus appeared large in bright field microscopy. Using a second pulse, the dark leftover could be ablated without leaving any visible traces, if the fluence was greater than 1 J cm-². However, to guarantee complete ablation in case of single spot analysis, three laser pulses with a fluence of 3.1 J cm-² were used at the same location. For single spot analysis, each cell on the microscopic slide was selected manually, whereas for line scanning cell dense regions were selected. The aerosol produced in the LA system was transported to the ICP by helium at a flow rate of 1 L min-1. Argon was added at a flow rate of 0.6 L min-1 in front of the ICP torch. The LA-ICP-MS was tuned for maximum intensity of
137Ba and 232Th as well as low oxide ratio ((ThO/Th) < 3%) on a microscope glass slide by ablating line scans from the substrate material with a spot diameter of 200 µm and maximum laser energy at 10 µm s-1. All investigations were carried out on the same day within 9 hours using the same tuning conditions of the ICP-MS.
Table 2 Applied parameters for imaging and single spot analysis of single cells with the LA system NWR213 (ESI). The cell slides were placed on the sample holder and inserted into the two volume LA chamber.
Imaging Single spot analysis
Carrier gas flow rate: 1 L min-1 He
Laser: Nd:YAG
Wavelength: 213 nm
Laser fluence: 1.0 J cm-² 3.1 J cm-²
Repetition frequency: 10 Hz 20 Hz
Laser spot size: 30 µm 110 µm
Laser warm up 5 s 5 s
Ablation mode: line scans
(25 µm s-1; 25 µm offset) single spot (burst count of three)
Two different ICP-MS scan lists were used to test the influence of multi-elemental analysis on quantitative results. First, a scan list previously optimized in our group was used, which would be typically applied in highly multiplexed imaging of immunochemically stained tissues or
21
single cells, see e.g. Müller et al.66 In total, this list contained nine isotopes (150Nd, 153Eu, 159Tb,
162Dy, 165Ho, 169Tm, 172Yb, 175Lu, and 193Ir), of which only two isotopes (165Ho and 193Ir) were used for data evaluation. Secondly, a singleplex scan list which contained only one isotope (193Ir) was used, to see if the extended analysis has an impact on the measurement precision and imaging quality. The exact ICP-MS operating conditions and data acquisition parameters for both methods are explained in chapter 4.1.4.2 in detail.
The raw data of an LA-ICP-MS image comprises of a sequence of line scans. To visualize the raw data, for each element the line scans were transformed into a matrix (text image) using a customized MATLAB® program. This matrix was finally visualized using ORIGIN® to obtain an image with proper dimensions.
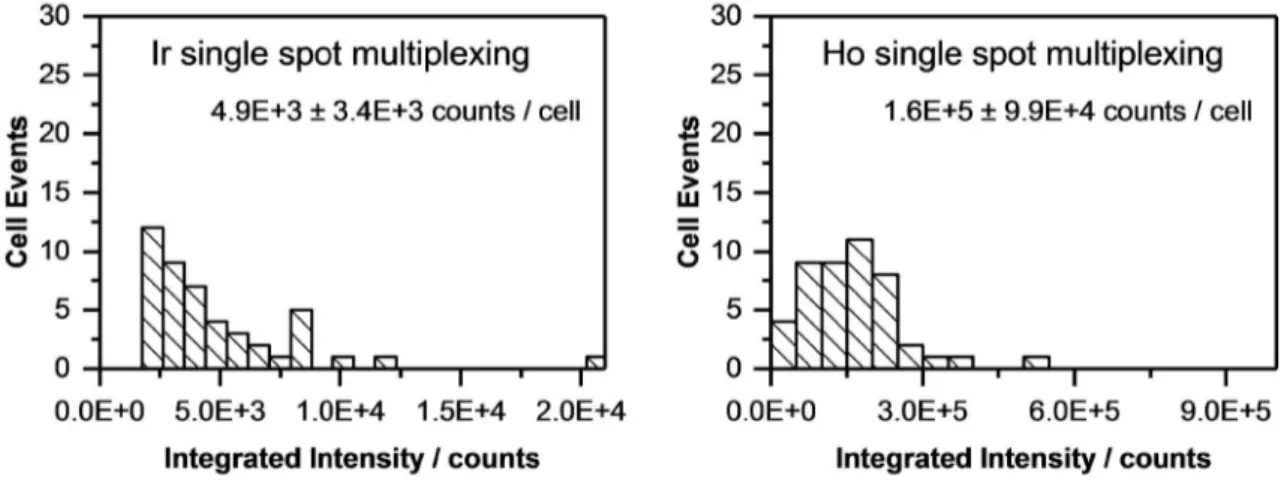
For quantitative determination, the signals of each single cell were integrated. In case of imaging, ImageJ (NIH) was used to select the area of each single cell by manually drawing a region of interest (ROI) around the cell and the “measure” tool was used to add up the intensity of all selected pixels. The average background intensity per pixel was determined in a similar fashion using an area without cells and subsequently, integrated intensities of single cells were background corrected. In case of single spot analysis, the signals of single cells were visualized as time-resolved plots. Each single cell was ablated by three laser pulses per spot at 20 Hz within 300 ms. The signals of the three pulses overlapped and formed only one peak, since the washout time of the ablation chamber for one pulse is >1 s. The resulting single peaks were integrated with manually set integration borders using Origin® integration gadget, while the total integration time was kept constant. Blanks were measured at spots without cells and subtracted from the integrated signals of cells.
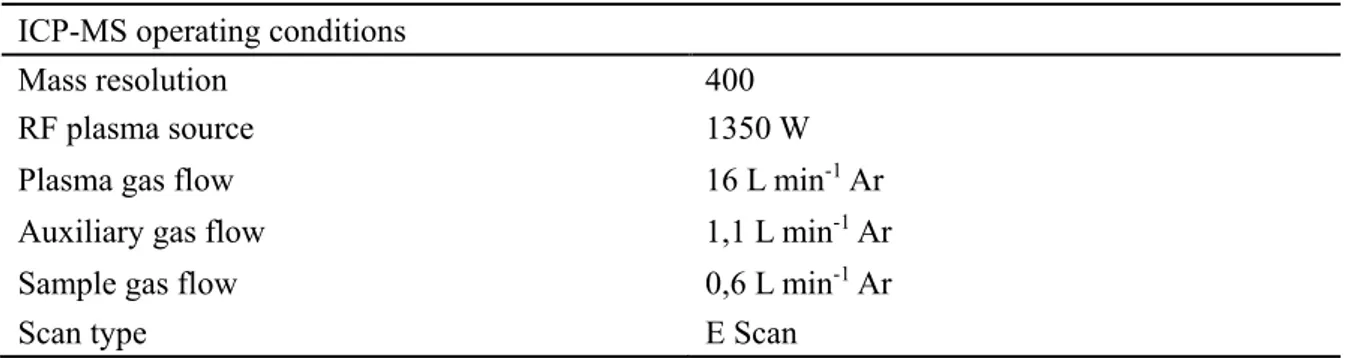
4.1.4.2 Element XR operation and data acquisition
ICP-MS operating conditions are listed in Table 3 and data acquisition parameters for singleplex and multiplex measurements in Table 4, respectively.
To be able to measure an LA-ICP-MS signal in multiplex mode, one needs to sample the peak of a single laser shot with multiple elements. The used sector-field based ICP-MS system is not able to measure multiple elements simultaneously and is designed for the measurement of constant signals with a high precision. The manufacturer provides a preset measurement method for constant signals which takes 1.25 s for each measured isotope, see Table 4. That would be