Supplement of Biogeosciences, 13, 4595–4613, 2016 http://www.biogeosciences.net/13/4595/2016/
doi:10.5194/bg-13-4595-2016-supplement
© Author(s) 2016. CC Attribution 3.0 License.
Supplement of
Effect of ocean acidification and elevated f CO
2on trace gas production by a Baltic Sea summer phytoplankton community
Alison L. Webb et al.
Correspondence to:Alison L. Webb (a.l.webb@rug.nl)
The copyright of individual parts of the supplement might differ from the CC-BY 3.0 licence.
Supplementary Figures
0.0 0.5 1.0 1.5 2.0 2.5 3.0
-5 0 5 10 15 20 25 30 35
Euglenophyte Equivalent Chl-ɑ (μg L-1)
t (Day)
M1 (346 μatm) M7 (494 μatm)
M3 (1075 μatm) M5 (348 μatm)
M6 (868 μatm) M8 (1333 μatm)
0.0 0.5 1.0 1.5 2.0 2.5 3.0 3.5
-5 0 5 10 15 20 25 30 35
Chlorophyte Equivalent Chl-ɑ (μg L-1)
t (Day)
0.0 0.5 1.0 1.5
-5 0 5 10 15 20 25 30 35
Cryptophyte Equivalent Chl-ɑ (μg L-1)
t (Day)
0.0 0.2 0.4 0.6 0.8 1.0
-5 0 5 10 15 20 25 30 35
Diatom Equivalent Chl-ɑ (μg L-1)
t (Day)
0.0 0.2 0.4 0.6
-5 0 5 10 15 20 25 30 35
Dinoflagellate Equivalent Chl-ɑ (μg L-1)
t (Day)
0.0 0.1 0.2 0.3
-5 0 5 10 15 20 25 30 35
Prasinophyte Equivalent Chl-ɑ (μg L-1)
t (Day)
0.0 0.1 0.2 0.3 0.4 0.5
-5 0 5 10 15 20 25 30 35
Cyanobacteria Equivalent Chl-ɑ (μg L-1)
t (Day)
e f
g
a b
c d
Figure S1. Temporal development of equivalent Chlorophyll-ɑ concentrations (μg L-1) for (a) Euglenophytes, (b) Chlorophytes, (c) Cryptophytes, (d) Diatoms, (e) Dinoflagellates (f) Prasinophytes and (g) cyanobacteria identified using HPLC and calculated using the CHEMTAX algorithm. Concentrations are the mean of a sample integrated over the total 17m of the mesocosms Dashed lines show the different phases of the experiment, fCO2 shown in the legend are mean fCO2 across the duration of the experiment. Data from Paul et al. (2015).
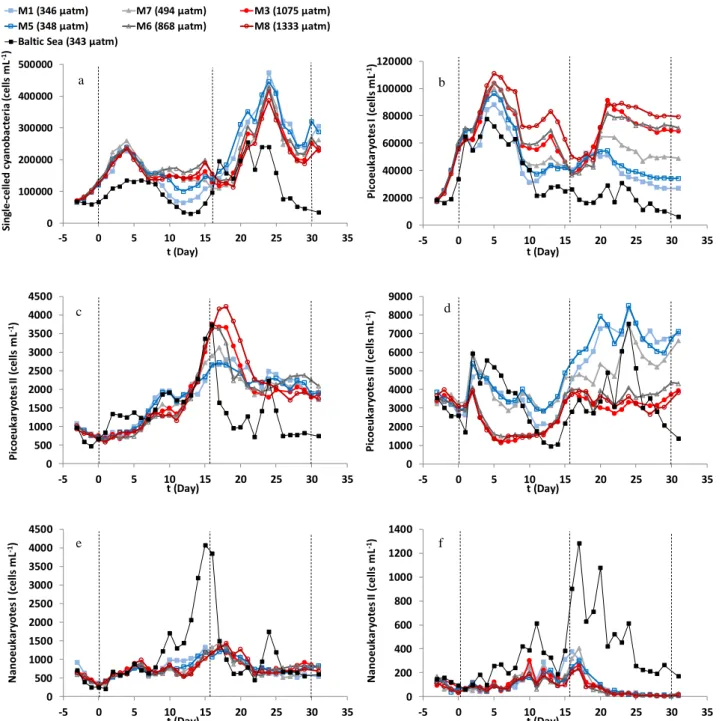
Figure S2. Cell enumeration (cells mL-1) by flow cytometry for identified groupings in the mesocosms: (a) single-celled cyanobacteria, (b) picoeukaryotes I, (c) picoeukaryotes II, (d) picoeukaryotes III, (e)
nanoeukaryotes I, and (f) nanoeukaryotes II from an integrated sample from the surface 10m of the
mesocosms. Dashed lines show the different phases of the experiment, fCO2 shown in the legend are mean fCO2 across the duration of the experiment. Data from Crawfurd et al. (2016).
0 100000 200000 300000 400000 500000
-5 0 5 10 15 20 25 30 35
Single-celled cyanobacteria (cells mL-1)
t (Day)
M1 (346 μatm) M7 (494 μatm) M3 (1075 μatm) M5 (348 μatm) M6 (868 μatm) M8 (1333 μatm) Baltic Sea (343 μatm)
0 20000 40000 60000 80000 100000 120000
-5 0 5 10 15 20 25 30 35
Picoeukaryotes I (cells mL-1)
t (Day)
0 500 1000 1500 2000 2500 3000 3500 4000 4500
-5 0 5 10 15 20 25 30 35
Picoeukaryotes II (cells mL-1)
t (Day)
0 1000 2000 3000 4000 5000 6000 7000 8000 9000
-5 0 5 10 15 20 25 30 35
Picoeukaryotes III (cells mL-1)
t (Day)
0 500 1000 1500 2000 2500 3000 3500 4000 4500
-5 0 5 10 15 20 25 30 35
Nanoeukaryotes I (cells mL-1)
t (Day)
0 200 400 600 800 1000 1200 1400
-5 0 5 10 15 20 25 30 35
Nanoeukaryotes II (cells mL-1)
t (Day)
a b
c d
e f
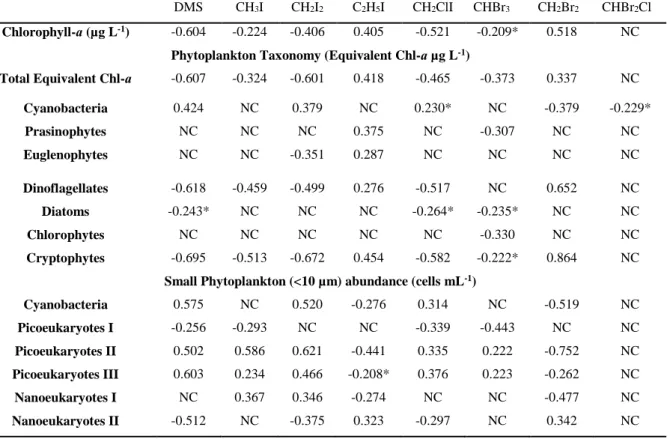
Table S1. Spearman’s Rank Correlation Coefficients for all trace gases measured in the mesocosms compared to total Chl-ɑ (Paul et al., 2015), CHEMTAX analysis of derived Chl-ɑ (Paul et al., 2015) and phytoplankton abundance (Crawfurd et al., 2016). Coefficients are significant at 99% confidence limits, except where highlighted (*) which are significant at 95%. NC: non-correlated.
DMS CH3I CH2I2 C2H5I CH2ClI CHBr3 CH2Br2 CHBr2Cl Chlorophyll-ɑ (µg L-1) -0.604 -0.224 -0.406 0.405 -0.521 -0.209* 0.518 NC
Phytoplankton Taxonomy (Equivalent Chl-ɑ µg L-1)
Total Equivalent Chl-ɑ -0.607 -0.324 -0.601 0.418 -0.465 -0.373 0.337 NC
Cyanobacteria 0.424 NC 0.379 NC 0.230* NC -0.379 -0.229*
Prasinophytes NC NC NC 0.375 NC -0.307 NC NC
Euglenophytes NC NC -0.351 0.287 NC NC NC NC
Dinoflagellates -0.618 -0.459 -0.499 0.276 -0.517 NC 0.652 NC
Diatoms -0.243* NC NC NC -0.264* -0.235* NC NC
Chlorophytes NC NC NC NC NC -0.330 NC NC
Cryptophytes -0.695 -0.513 -0.672 0.454 -0.582 -0.222* 0.864 NC Small Phytoplankton (<10 µm) abundance (cells mL-1)
Cyanobacteria 0.575 NC 0.520 -0.276 0.314 NC -0.519 NC
Picoeukaryotes I -0.256 -0.293 NC NC -0.339 -0.443 NC NC
Picoeukaryotes II 0.502 0.586 0.621 -0.441 0.335 0.222 -0.752 NC Picoeukaryotes III 0.603 0.234 0.466 -0.208* 0.376 0.223 -0.262 NC
Nanoeukaryotes I NC 0.367 0.346 -0.274 NC NC -0.477 NC
Nanoeukaryotes II -0.512 NC -0.375 0.323 -0.297 NC 0.342 NC
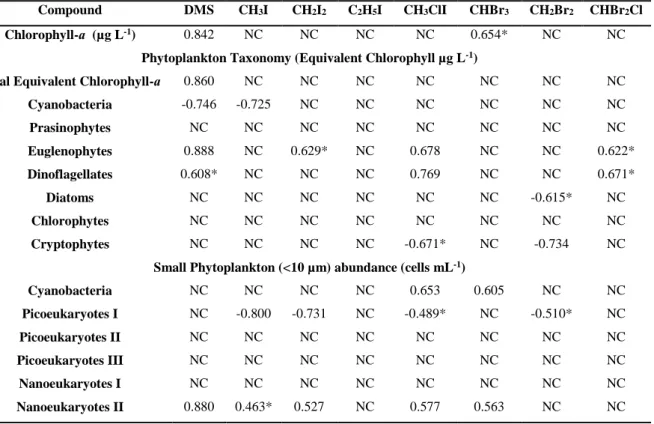
Table S2. Spearman’s Rank Correlation Coefficients for trace gases measured in the Baltic Sea compared to total Chl-ɑ (Paul et al., 2015), CHEMTAX analysis of derived Chl-ɑ (Paul et al., 2015) and phytoplankton abundance (Crawfurd et al., 2016). Coefficients are significant at 99% confidence limits, except those highlighted (*) at being significant at 95%. NC denoted non-correlated parameters.
* 95% significance level.
Compound DMS CH3I CH2I2 C2H5I CH3ClI CHBr3 CH2Br2 CHBr2Cl
Chlorophyll-ɑ (µg L-1) 0.842 NC NC NC NC 0.654* NC NC
Phytoplankton Taxonomy (Equivalent Chlorophyll µg L-1)
Total Equivalent Chlorophyll-ɑ 0.860 NC NC NC NC NC NC NC
Cyanobacteria -0.746 -0.725 NC NC NC NC NC NC
Prasinophytes NC NC NC NC NC NC NC NC
Euglenophytes 0.888 NC 0.629* NC 0.678 NC NC 0.622*
Dinoflagellates 0.608* NC NC NC 0.769 NC NC 0.671*
Diatoms NC NC NC NC NC NC -0.615* NC
Chlorophytes NC NC NC NC NC NC NC NC
Cryptophytes NC NC NC NC -0.671* NC -0.734 NC
Small Phytoplankton (<10 µm) abundance (cells mL-1)
Cyanobacteria NC NC NC NC 0.653 0.605 NC NC
Picoeukaryotes I NC -0.800 -0.731 NC -0.489* NC -0.510* NC
Picoeukaryotes II NC NC NC NC NC NC NC NC
Picoeukaryotes III NC NC NC NC NC NC NC NC
Nanoeukaryotes I NC NC NC NC NC NC NC NC
Nanoeukaryotes II 0.880 0.463* 0.527 NC 0.577 0.563 NC NC
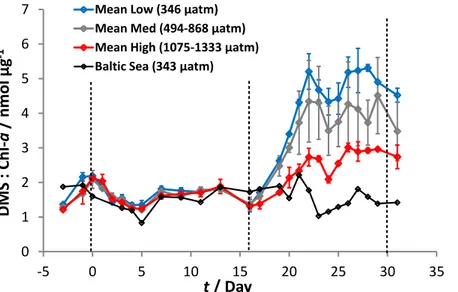
Figure S3. Ratios of DMS: total Chl-ɑ (nmol μg-1) plotted as means for the different fCO2 concentrations with error bars denoting the standard deviation. Chl-ɑ data from Paul et al. (2015)
0 1 2 3 4 5 6 7
-5 0 5 10 15 20 25 30 35
DMS : Chl-ɑ/ nmol μg-1
t / Day
Mean Low (346 μatm) Mean Med (494-868 μatm) Mean High (1075-1333 μatm) Baltic Sea (343 μatm)