Dispersion of hatchling sea turtles
Supplemental Table 1. Displacement distances and bearings of hatchlings after 1, 3 and 6 months of drift from their release locations for each nesting region and release month (January-April).
Nesting Region
Drift time (months)
Mean ± SD displacement distances (km) and bearings (degrees)
January February March April
km degree
s
km degree
s
km degree
s
Km degrees
Equatorial Guinea
1 3 6
141 ± 85 214 ± 115 314 ± 214
59 ± 1.3 46 ± 1.2 36 ± 1.2
141 ± 91 221± 119 320 ± 197
32 ± 1.4 29 ± 1.4 30 ± 1.4
150 ± 95 237 ± 139 315± 179
37 ± 1.5 38 ± 1.6 22 ± 1.3
139 ± 83 261 ± 168 315± 175
62 ± 1.9 23 ± 1.5 15 ± 1.2
North Gabon
1 3 6
180 ± 98 273 ± 123 442 ± 317
40 ± 0.9 22 ± 0.8 14 ± 0.8
199 ± 108 301± 152 444 ± 271
11 ± 0.9 7 ± 0.8 4 ± 0.9
210 ± 111 340 ± 225 450 ± 321
3 ± 1.1 1 ± 1.0 359 ± 0.8
203 ± 139 356 ± 250 432 ± 271
339 ± 1.4 352 ± 0.1 359 ± 0.8
Central Gabon
1 3 6
260 ± 141 666 ± 431 1125 ± 963
308 ± 1.3 322 ± 1.1 329 ± 1.0
309 ± 177 809 ± 604 1256 ± 1184
313 ± 1.1 324 ± 1.1 325 ± 1.0
338 ± 212 1186 ± 917 1593 ± 1506
296 ± 1.2 305 ± 1.0 310 ± 0.9
540 ± 308 1556 ± 1251 1794 ± 1753
295 ± 0.7 306 ± 0.7 313 ± 0.9
South Gabon
1 3 6
224 ± 128 767 ± 421 1581 ± 981
264 ± 1.4 260 ± 1.1 254 ± 0.1
282 ± 170 1098 ± 613 1929 ± 1274
269 ± 1.1 258 ± 0.9 259 ± 0.8
344 ± 202 1647 ± 908 2513 ± 1564
253 ± 1.1 261 ± 0.7 263 ± 0.6
603 ± 294 2382 ± 1043 3229 ± 1715
276 ± 0.5 275 ± 0.4 273 ± 0.5
Congo 1
3 6
199 ± 109 632 ±342 1298 ± 816
250 ± 1.2 241 ± 1.0 239 ± 0.8
251 ± 140 855 ± 484 1590 ± 1097
252 ± 1.1 244 ± 0.9 247 ± 0.7
293 ± 155 1208 ± 689 1992 ± 1293
248 ± 0.9 253 ± 0.7 255 ± 0.5
452 ±210 1784 ± 901 2656 ± 1446
270 ± 0.5 269 ± 0.3 267 ± 0.3
1 2 3
4 5 6 7
Dispersion of hatchling sea turtles
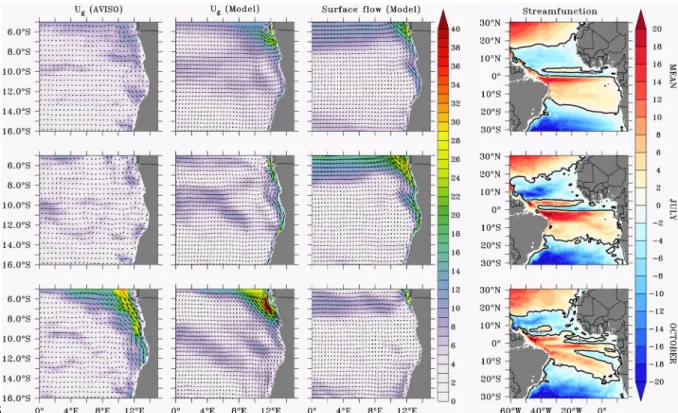
Figure S1. Oceanographic calculations. Geostrophic velocities (ug) calculated from AVISO satellite observations (http://aviso.oceanobs.com) and from the model sea surface height, as well as simulated surface currents (cm s-1). The panels on the right show the horizontal streamfunction in Sv (1 Sv = 106 m3s-1) as an indicator of the large-scale circulation. The upper panels show a long term mean, the middle and the lower panels show climatological averages for representative months July and October respectively. Averages are based on the period from 1st January 1993 to 31th December 2014 for the AVISO Data and on 1st January 1960 to 31th December 2009 for all other quantities. Modelled geostrophic currents which are representative of the general movement of the upper ocean compare quite well with observations. It is important to note that surface currents (which are used for the hatchlings drift), in particular in regions close to the African coast, flow in opposite direction due to direct wind effects (Ekman). The flow reversal cannot be verified due to the scarceness of observational data in this region. Since the ocean model is not specifically set up to represent coastal processes hatchlings were released offshore in locations they were likely to reach 8
9 10 11 12 13 14 15 16 17 18 19 20 21 22
Dispersion of hatchling sea turtles
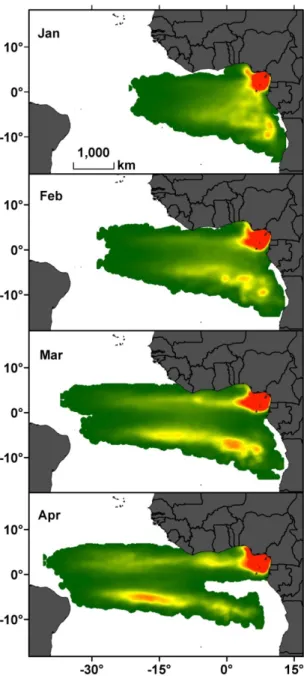
Figure S2. Seasonal variation in westward propagation. For each month during the hatchling season (January-April) the dispersion densities of hatchlings (from highest to lowest density: red to green) from Gabon are plotted after three months of drift. Dispersion statistics are weighted to reflect differences in nesting densities between northern, central and southern Gabon (based on nesting data from Witt et al., 2009).
24
25
26 27 28 29 30
31
Dispersion of hatchling sea turtles
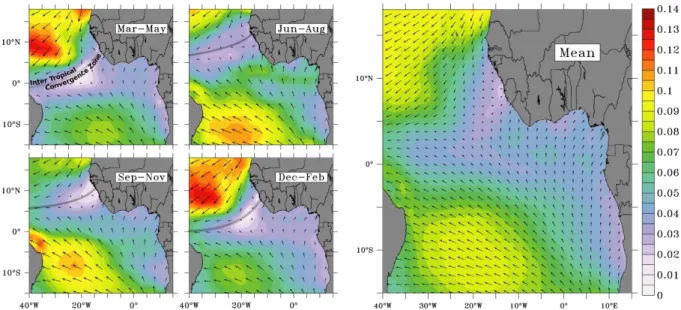
Figure S3. Seasonal climatological wind stress (N/m2). The mean and seasonal northerly and southerly movements of the ITCZ are plotted and the resultant impact on local wind patterns. Vectors are also plotted to show the direction of the wind stress. The position of the ITCZ, identifiable from precipitation or surface pressure levels, is approximated by the location of the wind stress minimum.
32 33 34 35 36 37
38
39
40
41
42
43
44
Dispersion of hatchling sea turtles
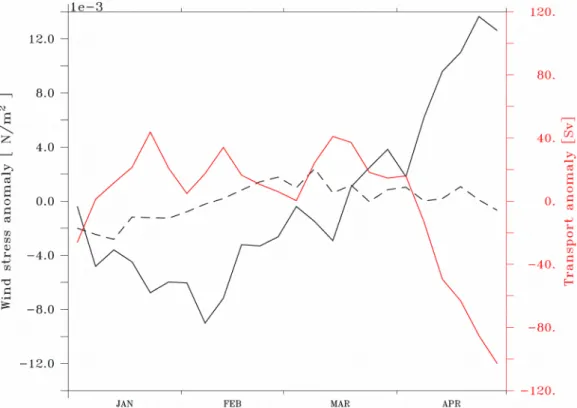
Figure S4. Wind and zonal transport anomalies. Climatology for the hatchling season of the wind-stress anomaly (black) averaged from 10°W to 5°W and 15°S to 0° (solid) and from 0° to 7°N (dashed) and zonal transport anomaly for the same region (10°W-5°W/15°S-7°N) 46
47
48 49 50 51 52 53 54 55 56 57 58 59 60 61
Dispersion of hatchling sea turtles
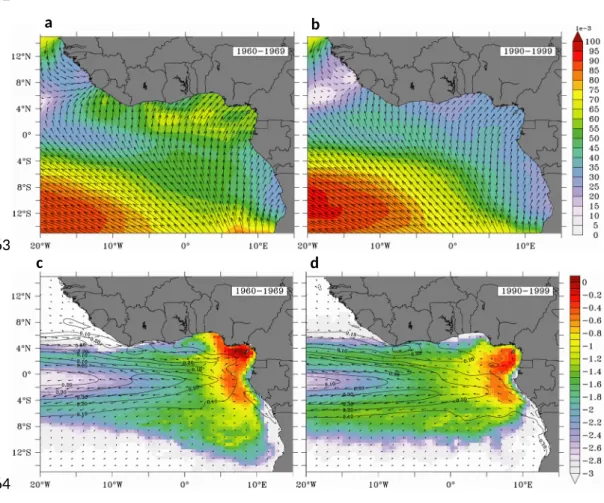
Figure S5. Wind-stress and surface currents. Wind-stress magnitude and direction (upper panel) and probabilities/surface currents (lower panel) are plotted for the periods 1960 to 1969 (a,c) and 1990 to 1999 (b,d). Probabilities are given in percentage on a log10 scale.
Contour lines denote surface velocities in m/s, arrows indicate direction of wind-stress and surface currents respectively. Essentially, during periods when mean coastal wind-stress was high (a), the easterly flowing Guinea current was strong (c) which supressed westward dispersal and resulted in high retention rates within the gulf. In years of low mean coastal wind-stress (b), the Guinea current was weak (d) resulting in the westerly propagation of more floats into offshore waters. Across our study region, wind-stress anomalies were most pronounced in the northern hemisphere which drives variability in the mean strength of the Guinea current and resultant strength of the westward propagation of floats.
c d
a b 62
63
64 65 66 67 68 69 70 71 72 73 74 75
Dispersion of hatchling sea turtles
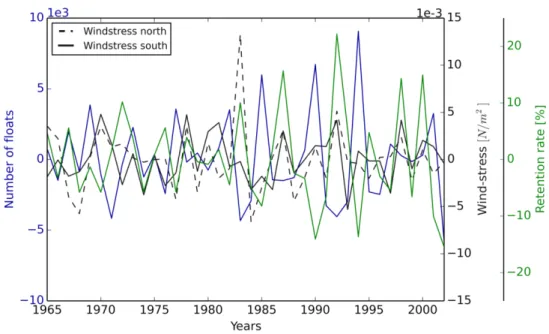
Figure S6. Long term Inter-annual variability in hatchling dispersal and oceanic conditions. The high pass filtered signals of retention rates of floats within the Gulf of Guinea (green line) are plotted alongside floats that propagate west of 10 °W (blue) and wind stress magnitude north and south of the equator (solid black and dashed blank lines respectively).
Short term trends in inter-annual variability of westward dispersal shows no significant correlation with wind-stress variability or retention rates. All quantities are given as anomalies with respect to the overall mean.
78
79 80 81 82 83 84 85 86 87