Global energy and environmental scenarios
Implications for development policy
Dirk Willenbockel
DIE Research Project “Development Policy:
Questions for the Future”
Discussion Paper / Deutsches Institut für Entwicklungspolitik ISSN 1860-0441
Willenbockel, Dirk: Global energy and environmental scenarios : implications for development policy / Dirk Willenbockel. DIE Research Project “Development Policy : Questions for the Future“. – Bonn : DIE, 2009. – (Discussion Paper / Deutsches Institut für Entwicklungspolitik ; 8/2009)
ISBN 978-3-88985-459-9
Dr Dirk Willenbockel, economist (PhD London Business School), is a research fellow at the Institute of Development Studies at the University of Sussex. His current research focuses on trade, growth and devel- opment and on the economics of climate change impacts and adaptation in low-income countries. Recent work in these areas includes projects for the World Bank, the European Commission, the ILO and the UN World Food Programme.
© Deutsches Institut für Entwicklungspolitik gGmbH Tulpenfeld 6, 53113 Bonn
+49 (0)228 94927-0 +49 (0)228 94927-130 E-Mail: die@die-gdi.de http://www.die-gdi.de
!
"
Foreword
This discussion paper has been produced in the framework of the research project „Develop- ment Policy: Questions for the Future“, made possible by funding from the German Federal Ministry for Economic Cooperation and Development (BMZ) which is gratefully acknowl- edged. This project aims to stimulate thinking about how the context that development coop- eration policy responds to could change in the long-term, and has evaluated methods of futures analysis and seeks to apply these methods to analyze emerging development cooperation chal- lenges to this end. As the present paper illustrates, future-oriented methods of analysis includ- ing scenario analysis methods have already been applied by a variety of organizations seeking to speculate on the direction that the future might take and to motivate political action. The as- sessment of the existing scenario analyses reviewed in this paper draws attention to key forces shaping the future of the world and highlights lessons for building a more sustainable future.
In particular, the author stresses the importance of improving the integration of development and environmental sustainability strategies at the national level, within donor countries, and in the context of multilateral cooperation. Outside of the discussion of the development policy implications of the UN Millennium Ecosystem Assessment (MEA) and the International Ener- gy Agency (IEA) scenario exercises, the paper also indirectly highlights another important challenge for the development research and policy community in the future: how to ensure that knowledge generated by one organization for a specific purpose, sometimes at great expense, can be made accessible to a wider audience in the service of addressing more widely shared goals.
Contents
Abbrevations
Summary 1
1. Background 3
2. Methodologies of the scenario studies 5
2.1 Methodological approach of the MEA scenario study 5
2.2 Methodological approach of the IEA scenario study 9
3. Main drivers of change in the scenario studies 12
3.1 Drivers of the MEA scenarios 12
3.2 Drivers of the IEA scenarios 17
4. The scenario paths and implications for developing countries 19
4.1 Summary of scenario results: MEA 19
4.2 Summary of scenario results: IEA 22
4.3. Implications for developing countries 23
5. Implications for the future of development policy 25 5.1 The role of the environment in development policy strategies 25 5.2 Implications of the IEA scenarios for development cooperation 29 5.3 Development policy insights from the individual MEA scenarios? 30
Tables
Table 1: Main distinguishing features of the MEA scenarios 7 Table 2: Quantitative simulation models employed for the MEA 8
Table 3: Population growth in the MEA scenarios 13
Table 4: Per-capita GDP growth in the MEA scenarios 13
Table 5: Population growth in the IEA scenarios 17
Table 6: Per-capita GDP growth in the IEA scenarios 18
Boxes
Box 1: Distinguishing features of the IEA scenarios 11
Box 2: Evolution of main direct drivers in the MEA scenarios 15
Box 3: Summaries of MEA scenario narratives 21
Abbreviations
ACT Accelerated Technology (IEA group of scenarios)
AM Adapting Mosaic (MEA scenario)
BMZ Bundesministerium für wirtschaftliche Zusammenarbeit und Entwicklung (German Ministry for Economic Cooperation and Development)
CO2 Carbon dioxide
CCS CO2capture and storage
DFID Department for International Development, UK
DIE Deutsches Institut für Enwicklungspolitik (German Development Institute)
EC European Commission
ETP Energy Technology Perspectives model
FSU Former Soviet Union
GDP Gross domestic product
G8 Group of Eight
GHG Greenhouse gases
gt Giga tonnes
GO Global Orchestration (MEA scenario)
IEA International Energy Agency
IIASA International Institute of Applied Systems Analysis IPCC International Panel on Climate Change
MDG Millennium Development Goal
MEA Millennium Ecosystem Assessment
NGO Non-governmental organization
NOx Nitrogen oxide
OECD Organisation for Economic Cooperation and Development
OS Order from Strength (MEA scenario)
PRSP Poverty Reduction Strategy Paper R&D Research & Development
SO2 Sulphur dioxide
SRES Special Report on Emission Scenarios
TG Techno Garden (MEA scenario)
UKGECC United Kingdom Global Environmental Change Commission
Summary
As part of a wider review of existing scenario analyses in areas with direct relevance to the future of global development, this paper focuses on two major recent studies: the scenar- ios contained in the UN Millennium Ecosystem Assessment (MEA) and the scenarios de- veloped by the International Energy Agency (IEA) in support of the G8 Gleneagles plan of action on climate change, clean energy and sustainable development. The paper offers a critical appraisal of these scenarios, examines the drivers of change that are considered to influence future developments, explores the implications of the scenarios for developing countries, and outlines what types of changes in development policy could be appropriate in light of the lessons learned from these scenario exercises.
The adverse consequences of growing pressures on ecosystems due to demographic and economic drivers identified in the MEA scenario projections are most immediately felt by rural poor populations in the least developed regions of the world. The degradation of ecosystem services poses a significant barrier to the achievement of the Millennium De- velopment Goals. Many of the regions facing the greatest challenges in achieving these tar- gets coincide with regions facing the greatest problems of ecosystem degradation. Signif- icant changes in policies, institutions, and practices can mitigate many of the negative con- sequences of growing pressures on ecosystems. A key implication of the interdependence between environmental and development goals is the need for a meaningful integration of environmental sustainability concerns in national development plans and strategies of in- dividual donors and intergovernmental development agencies, as well as the need for clos- er coordination between multilateral environmental agreements and other international in- stitutions in the development policy sphere.
The IEA baseline scenario clearly shows that without decisive globally coordinated policy action in support of the adoption of low-carbon energy technologies, GHG emissions will continue to rise rapidly over the 21st century and exacerbate current global warming trends. However, in the presence of a supporting policy environment, emerging clean en- ergy technologies can move the global energy system onto a more sustainable path and re- turn world-wide energy-related CO2emissions back to today’s level by 2050. Most of the future growth in energy demand, and hence emissions, arises from developing countries.
An effective follow-up agreement to the Kyoto Protocol must therefore include the major large and fast-growing developing countries including China and India. Developed coun- tries have an important role to play in helping developing economies to leapfrog the tech- nology development process and to employ efficient equipment and practices through technology transfer, capacity building and collaborative research, development and demonstration efforts. It will take a huge internationally coordinated effort to achieve the positive outcomes suggested by the IEA scenarios, and development cooperation on an un- precedented scale will be required as part of this effort. Thus, an important future role of development policy must be the facilitation of the technology and knowledge transfer that is required to meet this challenge.
Overall, the scenario studies under review confirm that ecosystem degradation and global warming pose serious threats for poverty reduction and development and deserve high pri- ority on the future development policy agenda.
1. Background
Context and aims
This study contributes to the wider project “Development Policy: Questions for the Future”
currently being undertaken by the German Development Institute (DIE) for the German Min- istry for Economic Development and Cooperation (BMZ). The DIE project seeks to apply sce- nario analysis methods to investigate how the global development landscape will evolve to- ward the year 2030. The aim is to inform development policy planning by identifying themes that will be increasingly relevant in the coming decades and by encouraging reflection on what types of development cooperation reforms might be needed in order to adapt to the changing context in which development policy is carried out. Numerous organizations have developed scenarios to explore global issues, and the DIE project hopes to learn from existing scenario exercises.
As part of the review of existing scenario analyses in areas with direct relevance to the future of global development, this paper focuses on two major recent studies: the scenarios contained in the Millennium Ecosystem Assessment (MEA) conducted under the auspices of the United Nations (Carpenter et al. 2005) and the scenarios developed by the International Energy Agency (IEA) in support of the G8 Gleneagles plan of action on climate change, clean energy and sustainable development (IEA 2006).
The present paper aims to offer a critical appraisal of the scenarios outlined in each of these studies, to examine the drivers of change that are considered to strongly influence future de- velopments, to further explore the implications of the scenarios for developing countries, and to outline what types of changes in development policy could be appropriate in light of the les- sons learned from these scenario exercises.
Policy Background and goals of the scenarios under review
The MEA scenario study is one of four central volumes of the Millennium Ecosystem Assess- ment, a four-year international program designed to assess the consequences of ecosystem change for human well-being and to establish the scientific basis for actions needed to enhance the conservation and sustainable use of ecosystems and their contributions to human well-be- ing. Officially launched by UN Secretary-General Kofi Annan in 2001 and completed in 2005, the assessment aimed in particular to meet the respective information needs of four interna- tional conventions on ecosystems – the Convention on Biological Diversity, Convention to Combat Desertification, the Ramsar Convention on Wetlands, and the Convention on Migra- tory Species. The work was conducted by an international network of scientists and other ex- perts involving over 1,300 authors from 95 countries organized in four working groups.
The stated main objectives of the analysis conducted by the Scenarios Working Group are
“to assess future changes in world ecosystems and resulting ecosystem services over the next 50 years and beyond, to assess the consequences of these changes for human well- being, and to inform decisions-makers at various scales about these potential develop- ments and possible response strategies and policies to adapt to or mitigate these changes”(Carpenter et al. 2005, 450).
Dirk Willenbockel
4 German Development Institute
The IEA scenario study is part of an ongoing IEA work programme in support of the G8 Gle- neagles Plan of Action on Climate Change, Clean Energy and Sustainable Development. In this plan, the G8 leaders propose to take forward actions towards improvements in energy effi- ciency, diversification of the energy supply mix, promoting research and development of clean energy technology, financing the transition to clean energy, managing climate change impacts, and tackling illegal logging. The 2005 G8 Summit mandated the IEA to play a major role in delivering the Plan and to advise on alternative energy scenarios and strategies aimed at a
“clean, clever and competitive energy future.”
Starting from the diagnosis that the predicted trends in global energy demand and CO2emis- sions up to 2050 under business-as-usual assumptions will not be sustainable, the main objec- tive of the IEA scenario study is to examine the potential contributions that cleaner and more efficient energy technologies as well as changes in practices can make to improve energy se- curity and reduce the environmental impacts of energy provision and use. The scenarios fur- ther aim to illustrate the impact of a range of policies and measures that overcome barriers to the adoption of these technologies in electricity generation, road transport, buildings and in- dustry.
In comparison to the wide scope of the MEA, the IEA study closes in on one particular im- portant aspect of ecosystem change, namely the technological drivers of energy-related green- house gas (GHG) emissions. In line with its closer focus, the published output from the IEA study takes a far more compact form than that of the MEA. While the MEA study as a whole covers well over 3,000 pages, of which around 600 pages are devoted to the scenario analysis, the IEA study is less than 500 pages in length, of which only 60 pages are devoted to the ac- tual exposition of the scenarios, the remainder consisting of detailed background information on current and emerging technology developments and potential barriers to their implementa- tion. As a result, the IEA study is far more amenable to a concise selective review for purpos- es of the present paper, and thus in the following sections more space is generally devoted to the MEA scenarios. However, it should be emphasized that this does not imply that the policy implications of the IEA study are in some sense less important than the wider policy messages emerging from the MEA scenarios not related to climate change mitigation. Indeed, it may be argued that the opposite is the case. To put it bluntly, given that climate change – which is pri- marily driven by energy-related GHG emissions – is very likely to be the predominant force adversely affecting ecosystems over the course of the 21st century, discrete policy efforts to preserve ecosystems in the absence of decisive global climate change mitigation action would seem to be as useful as re-arranging the deck chairs on the Titanic.
The potential significance of both studies for development policy is evident, given that the pop- ulations most vulnerable to ecosystem degradation and harmful climate change are dispropor- tionally located in low-income regions. Moreover, the IEA baseline scenario suggests that well before 2050 most of the world’s energy will be consumed in today’s developing countries, and thus these countries will have to play an important role in a transition to a low-carbon future.
To facilitate the knowledge and technology transfers essentially required for this transition, un- precedented cooperation between developed and developing countries will be needed.
Organization of the paper
The following section provides brief outlines of the methodological approaches to scenario de- velopment adopted in the two studies. Section 3 identifies the main drivers of change in the
scenarios and describes the future evolution of these drivers in the various scenarios. Section 4 provides concise summaries of the main projections of both studies and their potential im- plications for developing countries, while section 5 discusses potential implications for the fu- ture of development cooperation.
2. Methodologies of the scenario studies
2.1 Methodological approach of the MEA scenario study
Conceptual framework
Before turning to the methodological approach for the development of the MEA scenarios, a brief outline of the underlying conceptual framework and its constituting elements is required.
Within this analytical framework, ecosystems provide ecosystem services that affect human well-being. The ability of ecosystems to provide these services is influenced bydirect drivers which are in turn conditioned byindirect drivers.
Here an ecosystem is generically defined as “a dynamic complex of plant, animal, and mi- croorganism communities and the nonliving environment interacting as a functional unit”
(Carpenter et al. 2005, 25). The operational delineation of the boundaries of an ecosystem for purposes of analysis is context-specific and depends on the questions being asked. A well-de- fined ecosystem has strong interactions among its components and weak interactions across its boundaries. The MEA distinguishes 10 reporting categories to present its findings, however these categories do not constitute separate ecosystems and are overlapping, i.e. any geograph- ical point on the globe may fall into several categories.1
The MEA definesecosystem servicesas “the conditions and processes supported by biodiver- sity through which ecosystems sustain and fulfil human life, including the provision of goods.”
The MEA distinguishes (i) provisioning services (food, fresh water, and other biological prod- ucts), (ii) supporting and regulating services (including soil formation, nutrient cycling, waste treatment, and climate regulation), and (iii) cultural services (e.g. recreational, spiritual, aes- thetic). Human well-beingis conceived to have multiple constituents, including the basic ma- terial for a good life, freedom of choice and action, health, good social relations, and security.
Methodological approach to scenario development
The approach to scenario development for the MEA uses an iterative process of qualitative sto- ryline development and quantitative modelling in order to capture aspects of ecosystem serv- ices that are quantifiable as well as those that are difficult or impossible to express in quanti- tative terms. The results of the quantitative simulation models are meant to ensure the consis- tency of the storylines.
1 These reporting categories are labelled Marine, Coastal, Inland water, Forest, Dryland, Island, Mountain, Po- lar, Cultivated, and Urban.
Dirk Willenbockel
6 German Development Institute
In the initial organizational phase a scenario guidance team composed of chairpersons and a secretariat and a scenario panel composed of scientific experts was formed. A user needs sur- vey as well as a series of interviews with potential users of the scenarios including representa- tives from the various UN environmental conventions, government representatives as well as NGO and business leaders were conducted to inform the formulation of the focal questions to be addressed by the scenarios. The selection of the range of scenarios under consideration in- tends to reflect the diversity of viewpoints – in particular with regard to future policy strategies – elicited in the consultations.2
Four clusters of beliefs about expected or desirable futures were distilled from the interviews and the statements of user needs. Many respondents anticipated that the future would bring in- creased emphasis on national security, leading to greater protection of borders with associated consequences for economic development and ecosystems. Other respondents felt that the fu- ture could, or should, bring greater emphasis on fair, globally accepted economic and environ- mental policies, as well as greater attention by governments to public goods. Some interview- ees pointed to the prospects of technology for managing ecosystem services with greater ef- ficiency. Still others emphasized the potential role of local adaptive capacity for flexible inno- vative management of socioecological systems.
The four chosen scenarios are framed in terms of contrasting evolutions of governance struc- tures for international trade and cooperation and contrasting approaches towards ecosystem management, and aim to embrace these clusters of beliefs. Table 1 summarizes the main dis- tinguishing features of the scenarios along these two dimensions.
Parallel to the determination of the differentiating qualitative characteristics of the four sce- narios and the drafting of initial story outlines, a modelling team affiliated with a range of ex- isting global simulation models was formed at the start of the second phase to quantify the sce- narios. In consultation with the storyline team, the modelling team developed scenario-specif- ic time paths for exogenous quantifiable indirect drivers of ecosystems change that were con- sidered to be consistent with the storylines, as further detailed in section 3 below. These as- sumed time paths were then fed into the simulation models to generate projections for the quan- tifiable direct drivers of change in ecosystems.
Table 2 lists the core models included in the analysis. IMAGE 2.2 and AIM are both dynamic multi-region global integrated assessment models designed to capture interactions between economic activity, emission of greenhouse gases (GHG), climate and other environmental vari- ables. WaterGAP is a highly disaggregated combined global hydrology and water use model.
IMPACT is a world model of agricultural markets that distinguishes 43 regions and 32 crop and livestock commodities. To some extent, the models have been soft-linked to achieve greater consistency across simulations. For instance, the changes in crop yields due to climate change predicted by IMAGE have been used to adjust the agricultural productivity parameters of IM- PACT, the IMPACT agricultural production data have served as input to the IMAGE land cov- er model, and the changes in irrigation within IMPACT as well as the climate projections of IMAGE have been used as inputs for the WaterGAP simulations. In addition to these global
2 However, in a chapter on lessons learned from the scenario building process, it is candidly admitted that the
“goal of stakeholder participation must confront the reality of the scenario development process (scenarists getting carried away by their own storylines and visions of the future).”
models, a number of smaller models or algorithms have been used to describe some elements of biodiversity change.3 The resulting model projections for the main direct drivers are sum- marized in section 3.
Based on the first round of simulation results, the scenario team further elaborated or adapted the storylines and a number of feedback workshops with the MEA Board and stakeholder groups were held to improve the focus and details of the storylines. The initial assumptions for the indirect drivers were adjusted in line with the revised storylines and a second round of sim-
3 For a more detailed informal exposition of the modelling approach, the linkages and limited compatibility be- tween the various models and a discussion of the numerous uncertainties surrounding the simulation results see Carpenter et al. (2005, 152–70)
Governance and Cooperation
globalized regionalized
Table 1: Main distinguishing features of the MEA scenarios
Based on excerpts from Carpenter et al. (2005, 126–28 and Figure 5.2) Global Orchestration
A future in which global economic policies are the primary approach to sustainability.
The recognition that many of the most pres- sing problems of the time seem to have roots in poverty and inequality leads many leaders toward a strategy of globally orchestrating fair policies to improve well-being of those in poorer countries by removing trade barriers and subsidies. Nations also make progress on global environmental problems, such as greenhouse gas emissions and depletion of fisheries.
GO Techno Garden
A future in which people push ecosystems to their limits of producing the optimum amount of ecosystem services through the use of tech- nology. Often, the technologies they use are more flexible than today’s environmental en- gineering. Initially these technologies are pri- marily developed in wealthier countries and slowly dispersed to poorer places, but later they are developed everywhere. In some ca- ses, unexpected problems and secondary ef- fects created by technology and erosion of ecological resilience lead to vulnerable eco- system services that are subject to interruption or breakdown.
TG
Order from Strength
A future in which protection through bounda- ries becomes paramount. The policies enacted in this scenario lead to a world in which the rich protect their borders, attempting to confi- ne poverty, conflict, environmental degradati- on, and deterioration of ecosystem services to areas outside the borders. In addition to losses of ecosystem services in poor regions, global ecosystem services are degraded due to lack of attention to the global commons.
OS Adapting Mosaic
A future in which lack of faith in global fi- nancial and environmental institutions, com- bined with increasing understanding of the importance of resilience and local flexibility, leads to diminishing power and influence of these institutions compared with local and re- gional ones. Eventually, this leads to diverse local practices for ecosystem management.
The results are mixed, as some regions do a good job managing ecosystems and others do not. High levels of communication enable re- gions to compare experiences and learn from one another. Gradually, the number of suc- cessful experiments begins to grow.
AM EnvironmentalManagement reactiveproactive
Dirk Willenbockel
8 German Development Institute
ulation results was generated followed by further revisions of the storylines. The Scenario Re- port readily admits that a further “series of iterations between storyline improvement, quan- tification, and stakeholder feedback sessions would have helped to better harmonize the quan- titative and qualitative scenarios, but time constraints limited the number of iterations”(Car- penter et al. 2005, 150). The qualitative storylines and the quantitative simulation results are presented in two separate chapters of the Scenario Report. The exposition warns pre-emptive- ly that“(r)eaders may notice some inconsistencies“between the two chapters (ibid., 228).
In the final phase, both the qualitative storylines and quantitative model simulation results were disseminated for review to interested user groups through presentations, workshops, the MEA review process, and e-mail communications. Reviewer comments were then incorporated into the scenarios. Both review and dissemination are stated to be important elements for the suc- cess of the scenario exercise, yet no further details are provided in the Scenario Report.
It is conceded that the details of the individual storyline narratives necessarily carry a highly subjective flavour:
“The scenarios have been developed from input from all members of the Scenarios Work- ing Group, but they have been woven into storylines by a smaller number of writers. ...
Each member of the Scenarios Working Group would have written each scenario differ- ently if it had been his or her task. The purpose of the scenarios is to get the reader think- ing about how the world might develop rather than to provide predictions. The writers of later chapters of this report have drawn their own conclusions based partly on the sce- nario storylines but also on their own imagination.” (Carpenter et al. 2005, 226).
In line with the nature and purpose of the scenario approach, no probabilities are attached to the individual scenarios:
“The high level of uncertainty about the future of ecosystem services also implies that is not possible to distinguish between the probability of one scenario versus another. In sce- nario analysis we sometimes have an intuitive sense that one scenario is more probable Table 2: Quantitative simulation models employed for the MEA
Source: Own compilation
Model Institution Documentation Prediction of
IMPACT International Food Policy Rosegrant et al. (2002) Food supply and demand Research Institute
WaterGAP University of Kassel Alcamo et al. Water use and availability (2003a; 2003b)
IMAGE 2.2 National Institute of IMAGE (2001) Land cover, energy demand
Public Health and and supply, emissions,
Environment, Netherlands climate, sea level
AIM National Institute for Kainuma et al. (2002) Land cover, emissions,
Environmental Studies, water use and availability
Japan
ECOPATH / University of Pauly et al. (2000) Marine ecosystems change ECOSIM British Columbia
than another, but for the MA and most scenario exercises it is not fruitful to dwell on their relative probabilities. … other scenarios are also possible, and it is highly unlikely that any of the four scenarios … would materialize as described. In other words, the four sce- narios are only a small subset of limitless plausible futures.”(Carpenter et al. 2005, 155).
None of the four scenarios is meant to serve as a business-as-usual scenario that just extrapo- lates current trends in the absence of major policy shifts, and some critics consider this as a weakness of the MAE scenario approach.4
On an operational level, the MEA methodology suffers to some extent from the scheduling problems commonly encountered in large-scale assessment exercises. The various working groups had to operate in parallel rather than sequentially as would have been preferable, e.g.
the findings on the current state of ecosystems in the final report of the MAE Current State working group should in principle constitute the starting point for the MAE Scenario working group, while the work of the MAE Policy Responses working group should in turn be informed by the results of the Scenario working group. As noted by the National Research Council (2007, 4–21), “although a great effort was made to exchange information among working groups, they did not fully benefit from each other’s work. Another scheduling problem was that all of the subglobal assessments had not been completed by the end of the global assessment.”
2.2 Methodological approach of the IEA scenario study
The approach of the IEA scenario study combines a detailed assessment of the status and prospects of key energy technologies and energy efficiency in the areas of electricity genera- tion, road transport and fuels, buildings and appliances, and industry with a model-based sim- ulation analysis.
The technology assessment includes the identification of barriers to the implementation of more energy-efficient and low-carbon technologies as well as the identification of a set of pol- icy measures required to overcome these barriers. This assessment draws upon the expertise of the IEA’s international network for collaboration on energy technology.
The scenario analysis contrasts a business-as-usual baseline simulation on the one hand with a set of six “Accelerated Technology” (ACT) scenarios on the other hand.5The baseline assumes only technology developments and improvements in energy efficiency that can be expected on the basis of government policies already implemented, while the ACT scenarios assume that the set of policies in support of the further development and adoption of cleaner technology identified in the technical assessment are implemented with a given level of effort that does not vary across the ACT scenarios.
4 “A more reasoned extension of current trends, set in context by a clear discussion of the types of interaction or event that could disrupt the model, would have been more useful”(House of Commons Environmental Au- dit Committee 2007, 25).“… none of the scenarios was completed on a business as usual basis which would have been useful”(UKGECC 2006).
5 For easier reference, “ACT” label is here extended to the “Tech Plus” scenario.
Dirk Willenbockel
10 German Development Institute
The various ACT scenario assumptions vary only along one dimension or uncertain driver, namely the rate of progress in overcoming technological barriers and achieving cost reductions in the development and use of energy-efficient and low-carbon technologies. More specifical- ly, the scenarios differ in their assumptions about progress in four areas: (i) cost reductions for renewable power generation technologies; (ii) overcoming constraints to the development of nuclear power plants; (iii) developing CO2 capture and storage (CCS) technologies to com- mercial viability; (iv) the adoption of energy efficient end-use technologies.
As shown in Box 1, the ACT Map scenario assumes progress in all four of these areas, while the other five ACT scenarios can be viewed as sensitivity analyses around this central scenario to account for the significant uncertainties that surround expected progress in each of the four areas. In contrast to the MEA Scenario Report, the IEA Report provides no procedural de- scription of the deliberation process that led to the delineation of these scenario assumptions.
The primary tool used for the quantification of the scenarios is the IEA Energy Technology Per- spectives model (ETP). ETP is a dynamic partial-analytic bottom-up model. Its geographic coverage is global with a distinction of 15 regions.6The model contains a detailed representa- tion of fuel and technology choices throughout the energy system, from energy extraction through fuel conversion and electricity generation to end-use. ETP solves for least-cost mixes of energy technologies and fuels to meet given energy-service demand paths subject to con- straints including the availability of natural resources and CO2policies. The regions identified in the model trade energy and a set of energy-intensive material inputs. The model assumes per- fect foresight of future demand, fuel prices and environmental policies in the determination of dynamically optimal energy investment decisions. In order to mimic uncertainty, relatively high discount rates are used, so that expected changes in the distant future are given a low weight. Capital stock turnover is explicitly taken in account, which is important for a realistic assessment of the rate at which new technologies can penetrate the energy system.
A distinct advantage of ETP is that emerging technologies are explicitly modelled. The repre- sentation of electricity supply and demand accounts for the difference between base-load and peak demand, and the need for different plants to fill the load curve. It also allows for the in- termittent nature of some renewables. The characteristics of the model allow a quite detailed analysis of competing energy options, as it draws on a large database of current and emerging technologies. The model also computes energy-related CO2emissions.
However, there is no endogenous general equilibrium representation of the global economy and hence no feedback links from changes in the energy system on the structure of the econo- my and economic activity. Demand for energy services and energy-intensive materials is fed exogenously into the model on the basis of given population and GDP growth projections by region (see section 3) and does not respond to changes in energy prices.7These shortcomings of the ETP model and their potential implications for the degree of confidence that can be at-
6 Africa, Australia and New Zealand, Canada, China, Central and South America, Eastern Europe, the Former Soviet Union, India, Japan, Mexico, Middle East, Other Developing Asia, South Korea, the US, and Western Europe. However, in the IEA Report, results are presented at a higher level of regional aggregation.
7 The IEA Scenario Report devotes only a few lines to the ETP model (IEA 2006, 45) and virtually no details of the simulation methodology are provided. The exposition above draws upon the description in Gielen/
Taylor (2007) and the technical documentation in Loulou/Goldstein/Noble (2004).
Box 1: Distinguishing features of the IEA scenarios Baseline
The baseline scenario includes the effects of technology developments and improvements in energy ef- ficiency that can be expected on the basis of energy and climate policies in all regions already enacted or committed.
ACT Map
The ACT Map scenario is relatively optimistic about the rate of progress in overcoming technological barriers and achieving cost reductions in the development and use of energy-efficient and low-carbon technologies. Its assumptions are considered to be realistic in the light of the current knowledge of the technologies and historic experience with technological progress. The key features of the Map scenario are:
– Barriers to the capture and storage of CO2are overcome, although costs remain high.
– Cost reductions for renewable energy technologies, such as wind and solar, continue with increasing deployment due to learning effects.
– Expansion of nuclear power generation capacity becomes more acceptable, as problems related to waste management and nuclear weapon proliferation are addressed.
– Progress in energy efficiency accelerates due to successful implementation of best practices and po- licies that lead to the adoption of more efficient technologies in the transport, buildings and industri- al sectors.
– Biofuels become an increasingly viable alternative to petroleum products in the transport sector. New technologies, increased crop yields and the increased feedstock availability due to agricultural sector restructuring all contribute to reduced costs for biofuels.
– Significant progress is made to reduce the costs of hydrogen fuel-cell vehicles, but costs remain high in relative terms and hydrogen makes only a minor contribution to the transport sector.
ACT Low Renewables
This scenario explores the impact of slower cost reductions for wind and solar energy technologies.
ACT Low Nuclear
This scenario reflects the limited growth potential of nuclear energy if public acceptance remains low, nuclear waste issues are not satisfactorily addressed and the problem of non-proliferation remains unre- solved.
ACT No CCS
This scenario assumes that the technological issues facing CCS are not solved and hence CCS techno- logies do not become commercially available.
ACT Low Efficiency
This scenario assumes that energy-efficiency policies are less effective than in the Map scenario. Global average energy savings are 0.3% per year lower than in the Map scenario.
TECH Plus
The TECH Plus scenario makes more optimistic assumptions about the progress for promising energy technologies than is considered likely in the other ACT scenarios and is thus considered to be more spe- culative. This scenario assumes considerably stronger cost reductions from R&D, technology develop- ment and learning-by-doing for fuel cells, renewable electricity generation technologies, biofuels and nuclear technologies relative to ACT Map.
Dirk Willenbockel
12 German Development Institute
tached to the simulation results are not discussed in the IEA Report. Yet it should be noted that these shortcomings reflect the inevitable trade-off involved in the choice between bottom-up and so-called top-down approaches to energy modelling, given the present state of the art in this area. While top-down models can in principle capture the mentioned feedback links miss- ing in the ETP bottom-up model, these models do at present not allow a detailed modelling of current and emerging energy technologies.
3. Main drivers of change in the scenario studies 3.1 Drivers of the MEA scenarios
The conceptual framework of the MEA distinguishes indirect and direct drivers of change in ecosystems. Direct drivers unequivocally affect ecosystem processes, while the indirect driv- ers influence ecosystems via their impact on direct drivers. The MEA identifies five categories of indirect drivers: (i) demographic, (ii) economic, (iii) sociopolitical, (iv) scientific and tech- nological, and (v) cultural and religious. The main direct drivers include changes in climate, plant nutrient use, land conversion, and diseases and invasive species.
Demographic drivers
Population change is obviously important because it influences demand levels for ecosystem services, CO2and other pollutant emissions, the rate of land conversion and other direct driv- ers of ecosystem change.
Since developments in per-capita income and other determinants of fertility, mortality and in- ternational migration rates differ across the four scenarios, the regional population projections are scenario-specific as shown in Table 1. The figures are based on IIASA projections (Lutz / Goujon 2001) which have been adapted to be consistent with the four scenario storylines with additional input from IIASA demographers (O’Neill 2005). The predicted world population in 2050 ranges from 8.1 billion in the GO to 9.6 billion in the OS scenario. The main reason for the divergence is that GO assumes higher economic growth and higher human capital invest- ments in education and health than OS and hence a faster transition towards lower fertility and mortality rates in developing regions. However, the 2050 OECD population is substantially higher under GO than under OS, since the GO scenario assumes far higher rates of migration from low- to high-income regions.
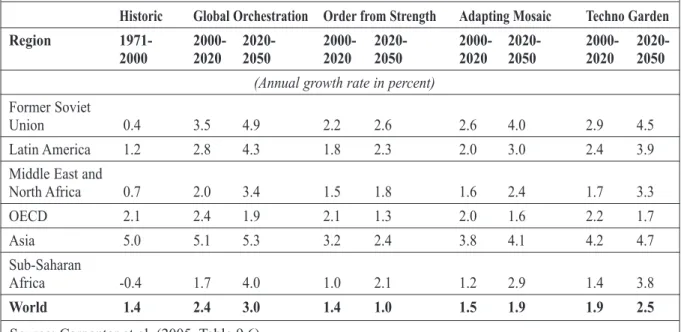
Economic drivers
The main economic drivers in the scenarios are real GDP growth per capita and the structural transformation of consumption and production patterns associated with economic growth. The starting point for the long-run growth projections by region used in the scenarios are the World Bank (2002) Global Economic Perspectives forecasts for the period up to 2015 and the growth assumptions of the IPCC SRES scenarios (Nakicenovic et al. 2000) for the period beyond 2015. Since the alternative futures described by the four scenarios differ in terms of their im- plications for long-run growth performance, the per-capita growth rate predictions from these
sources have been revised upwards or downwards for the individual scenarios as shown in Table 3.
Trade liberalization, international economic cooperation, and technology exchange foster eco- nomic performance in the two scenarios with globalized governance, while trade barriers and inward-oriented policies are assumed to contribute to lower growth rates in the OS and AM scenarios. Growth rates are higher in GO compared to TG, because in the latter investments in environmental technologies are favoured at the expense of human capital investments.
Table 3: Population growth in the MEA scenarios
Based on Lutz / Goujon (2001) and O’Neill (2005)
Global Orchestration Order from Strength Adapting Mosaic Techno Garden Region 1995 2020 2050 2100 2020 2050 2100 2020 2050 2100 2020 2050 2100
(million) Former Soviet
Union 285 290 282 245 287 257 216 288 273 246 292 281 252
Latin
America 477 637 742 681 710 944 1,309 708 933 1,155 672 831 950
Middle East and
North Africa 312 478 603 597 539 774 972 537 765 924 509 692 788 OECD 1,020 1,136 1,255 1,153 1,076 998 856 1,079 1,068 978 1,117 1,154 1,077 Asia 3,049 3,861 4,104 3,006 4,210 5,023 5,173 4,201 4,992 4,753 4,039 4,535 3,992 Sub-Saharan
Africa 558 858 1,109 1,132 956 1,570 1,988 951 1,492 1,775 907 1,329 1,516 World 5,701 7,260 8,095 6,814 7,777 9,567 10,514 7,764 9,522 9,830 7,537 8,821 8,575
Table 4: Per-capita GDP growth in the MEA scenarios
Source: Carpenter et al. (2005, Table 9.6)
Historic Global Orchestration Order from Strength Adapting Mosaic Techno Garden Region 1971- 2000- 2020- 2000- 2020- 2000- 2020- 2000- 2020-
2000 2020 2050 2020 2050 2020 2050 2020 2050
(Annual growth rate in percent) Former Soviet
Union 0.4 3.5 4.9 2.2 2.6 2.6 4.0 2.9 4.5
Latin America 1.2 2.8 4.3 1.8 2.3 2.0 3.0 2.4 3.9
Middle East and
North Africa 0.7 2.0 3.4 1.5 1.8 1.6 2.4 1.7 3.3
OECD 2.1 2.4 1.9 2.1 1.3 2.0 1.6 2.2 1.7
Asia 5.0 5.1 5.3 3.2 2.4 3.8 4.1 4.2 4.7
Sub-Saharan
Africa -0.4 1.7 4.0 1.0 2.1 1.2 2.9 1.4 3.8
World 1.4 2.4 3.0 1.4 1.0 1.5 1.9 1.9 2.5
Dirk Willenbockel
14 German Development Institute
Sociopolitical drivers
The two key sociopolitical drivers in the scenario are the extent of international cooperation and attitudes toward environmental policies. As outlined in section 2, the lack of consensus among stakeholders about future desirable pathways for these drivers and hence uncertainty about their actual future pathways provide the main rationale for the choice of the scenario space, i.e. the main contrasting assumptions of the four scenarios are framed in terms of dif- ferent pathways for these drivers (Table 1).
Scientific and technological drivers
Technological change in the form of process innovations that determine total factor productiv- ity growth are built into the per-capita GDP growth projections by scenario as outlined above in the discussion of economic drivers. Specific technological developments with particular rel- evance for ecosystems include future trends in energy use efficiency, irrigation and water use efficiencies, crop yield improvements, cost reductions of new energy technologies and emis- sion control technologies.
The rate of technical progress is highest under the GO scenario, yet environmental considera- tions receive little attention in energy investments, as society is assumed to believe the envi- ronmental impacts of energy production to be either small or manageable by future technolog- ical change. With respect to irrigation efficiency and agricultural productivity, GO assumes that that market-oriented reform in the water sector could lead to greater investments in efficiency- enhancing water and agricultural technology, particularly in Asia and sub-Saharan Africa.
In contrast, in the TG scenario, technology development is geared towards the reduction or mit- igation of ecological problems, implying relatively high rates of technical progress in the de- velopment of energy-efficient technologies and low-carbon energy sources, yet lower rates of development for technologies in general.
Under AM, regionalization and higher barriers to trade and the dispersion of technologies slow down overall technological development up to 2025. Yet increased decentralized learning could at the same time build up a new basis from which technologies can be developed. There- fore, technologies under this scenario develop slowly at first but speed up later in the century.
With respect to irrigation efficiency, local adaptations – including water harvesting and other water conservation technologies as well as the increased application of agro-ecological ap- proaches – could raise efficiency levels in some regions and countries. Efficiency increases are achieved but remain geographically scattered. Similarly, local approaches are adopted for im- provements in energy efficiency and the use of low-carbon fuels.
Under the OS scenario, technical progress including efficiency improvements directly affect- ing ecosystems will be relatively slow throughout the whole period, especially in low-income countries. With respect to irrigation efficiency and agricultural productivity, the scenario nar- rative envisages government cuts in irrigation infrastructure expenditures due to government budget problems as a result of low growth. A central theme of OS is securing reliable energy supplies, and this leads to a focus on developing domestic energy sources. Slow diffusion of new technologies and barriers to global energy trade contribute to a continued intensive use of domestic fossil fuels. For China and India, this implies a continued reliance on coal. This sce- nario is similar in character to the IPCC A2 scenario.
Cultural and religious drivers
Cultural and religious drivers do not feature in the quantitative modelling analyses, but changes in culture are seen as an important part of the qualitative elements of the AM and the TG sce- narios. Both scenarios assume a general shift in the way ecosystems and their services are val- ued:
“In both cases decision-makers at various scales develop a proactive approach to ecosys- tem management, but they pursue different management strategies to reach this goal. In [TG], the supply of ecosystem services is maintained by controlling ecosystem functions via technology. In [AM], the aim is to create a set of flexible, adaptive management op- tions through a learning approach. Culturally diverse forms of learning about and adapt- ing to ecosystem changes are fostered. Devising ways of incorporating traditional eco- logical and local knowledge into management processes and protecting the cultural and spiritual values assigned to nature in various cultures become part of the developed strategies.”(Carpenter et al. 2005, 195).
Direct drivers
The direct drivers of ecosystems change are functions of the indirect drivers. Paths for the di- rect drivers endogenously determined in the simulation analysis include GHG emissions, cli- mate change, sea-level rise, air pollution emissions, land use and land cover change, use of ni- trogen fertilizers and nitrogen loading to rivers and coastal marine systems and the disruption of landscape by mining and fossil fuel extraction.8 Box 2 summarizes the pathways for the main direct drivers suggested by the model simulations for the scenarios under consideration.
8 The concept and categorization of direct drivers is not consistently applied across the different parts of the Scenario Report. E.g. while the presentation of the conceptual framework lists“natural, physical and bio- logical drivers”as only one of seven direct driver categories (Carpenter et al. 2005, 26), the chapter on “Dri- vers of Change” states that“(d)rivers in all categories other than physical and biological are considered in- direct. Important direct (physical and biological) drivers include changes in climate, plant nutrient use, land conversion, and diseases and invasive species”(ibid., 176). The chapter on “Changes in Ecosystems and their Drivers” offers yet another list of main direct driver categories (ibid., 315).
Box 2: Evolution of main direct drivers in the MEA scenarios Greenhouse gas emissions
Global annual GHG emissions rise from 10 gigatonnes of CO2equivalent (gt) in 2000 to 25 gt in 2050 under GO, to 20 gt under OS and to 18 gt under AM, and drop significantly to 7 gt under the TG sce- nario, which assumes strong climate change mitigation action. While annual emissions begin to decline beyond 2050 in GO and AM, they continue to climb under the OS scenario. The share of developing countries in total global GHG emissions rises strongly in all scenarios.
Climate change
The rise in global average surface temperature due to from 2000 to 2050 the atmospheric concentration of GHG as projected by the IMAGE model ranges from 1 °C under TG to 1.5 °C under OS. Global aver- age precipitation will increase over the twenty-first century.
The Scenario Report notes the large uncertainties surrounding climate model projections of spatial pre- cipitation patterns. Changes in rainfall are not systematically reported for all scenarios
(continued overleaf)
Dirk Willenbockel
16 German Development Institute
Box 2: Evolution of main direct drivers in the MEA scenarios (continued)
Source: Carpenter et al. (2005, 314–29) Sea level rise
The sea level is projected to rise by 15-20 cm from 2000 to 2050 and by 40-60 cm between 2000 and 2100.
Air pollution emissions of sulphur dioxide (SO2) and nitrogen oxide (NOx)
Under GO, emission trends are balanced between increasing sources of emissions and increasing com- mitments to emission controls as a result of increasing demand for clean air. Global SO2emissions are expected to stabilize while NOxemissions increase between 2000 and 2050. Most of this increase oc- curs in Asia, the former Soviet Union, Africa, and MENA. Under TG, there are strong reductions in air pollution emissions as a result of substantial investments in emission controls and the side benefits of climate change policies. Under AM, environmental awareness is higher than under GO Orchestration, but lower economic growth in developing regions implies less energy use but also less investment in emission control technology. The result is that SO2pollution declines in all regions except Asia. Trends for NOxare similar to those in the GO scenario. The level of SO2air pollution declines only slightly worldwide under the OS scenario. There is a significant decline in NOx-related pollution in OECD coun- tries, and a major increase elsewhere.
Land use and land cover change
In the first decades of the scenario period, all scenarios show an ongoing expansion of agricultural land replacing forest and grassland. This expansion occurs mainly in poorer countries, while agricultural land in the OECD and FSU actually declines. While rapid depletion of forest area continues under OS, under TG net forest cover increases. Production of biofuels, particularly under the TG scenario, is an impor- tant category of land use, especially in the FSU, OECD and Latin America. Under OS, there is a conti- nuous increase of agricultural area in poorer countries, particularly in sub-Saharan Africa and Latin America due to relatively fast population growth and a limited potential to import food in Africa. As a result, the depletion of forest area continues worldwide at a rate near the historic average, only to slow down after 2050 because of slowing population growth. Two thirds of the Central African forest present in 1995 will have disappeared by 2050. Asia and Latin America loose 40% and 25% of their forest are- as respectively. In other regions the rate of forest loss slows down.
AM, like OS, also assumes relatively slow yield improvement in the first decades. However, a lower in- crease in population and locally successful experiments in innovative agricultural systems mitigate a further expansion of agricultural land in other regions after 2040. This is particularly important for Afri- ca. Indeed, AM shows the lowest deforestation rates for this region of all four scenarios. In contrast, ho- wever, the relatively low yield improvement causes a virtual depletion of forest areas in South Asia up to 2100. Globally, the long-term deforestation rates in this scenario are slightly above those of TG. These changes in land use will have a tremendous impact on the vulnerability of different regions. By 2050, under OS, Africa and Asia have put virtually all productive land under cultivation to fulfil the demand for crops and animal products. This clearly indicates a high vulnerability to abrupt changes in the natu- ral system. A similar but less extreme situation occurs for Africa under GO and for Asia and Africa un- der both GO and TG.
These results indicate that land use change will continue to form a major pressure on ecosystem services in the four scenarios. At the same time, all four scenarios find the loss of natural forests to slow down compared with historic rates. This mainly results from increases in natural areas in industrial regions.
Use of nitrogen fertilizers and nitrogen loading to rivers and coastal marine systems
In three of the four scenarios, there is a further increase in nitrogen transport in rivers. The increase is in particular large under GO and AM. Only TG shows a decrease in nitrogen transport by rivers.
Disruption of landscape by mining and fossil fuel extraction
The biggest disruption by far will be caused by OS, where total fossil fuel use increases by more than a factor of 2.5 by 2100 compared with 2000, followed by GO with a rise in fossil fuel extraction of a factor of two over the same period. Fossil fuel use also nearly doubles under AM. The impact is likely to be the smallest under the TG scenario, because fossil fuel use substantially declines up to 2100.
3.2 Drivers of the IEA scenarios
The key underlying drivers of energy provision, energy use and energy-related carbon emis- sions in the IEA scenarios are population dynamics, economic growth and structural change, technological change and policies towards the development and implementation of cleaner and more efficient energy technologies. In contrast to the MEA scenarios, the assumed pathways for the demographic, economic and policy drivers do not vary across the IEA ACT scenarios.
Apart from the baseline scenario, the scenarios differ only with respect to the rates of techno- logical progress in the areas of energy efficiency and low-carbon energy technology for a giv- en path of policy effort in support of low-carbon growth. Thus, the various ACT scenarios do not contrast alternative policy strategies but explore the implications of alternative assumptions about policy effectiveness.
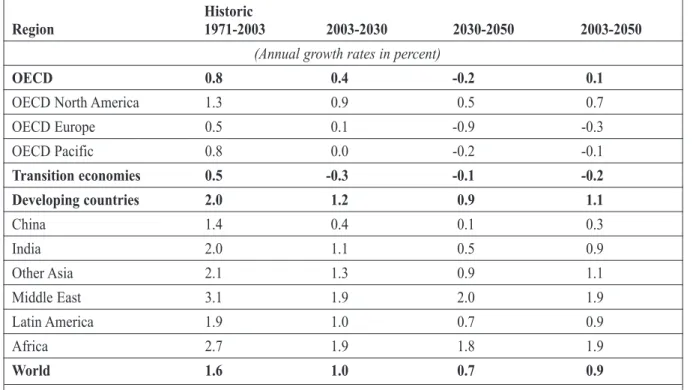
Demographic drivers
Population growth assumptions are based on United Nations (2004) projections. The global population rises to 9.1 billion in 2050. This figure is about 1 billion higher than the correspon- ding MEA projection for the OG scenario, but 0.5 billion lower than in the OS scenario and falls roughly in between the projections of the TG and AM scenarios shown in Table 1. Popu- lation growth slows over the projection period from 1% per year in 2003 to 2030 to 0.7% per year in 2030 to 2050. The population of the developing regions will continue to grow most rap- idly, by 1.1% per year from 2003 to 2050 (Table 5). The share of the world population living in today’s developing regions increases from 76% now to 83% in 2050.
Table 5: Population growth in the IEA scenarios
Source: IEA (2006, Table B-2)
Historic
Region 1971-2003 2003-2030 2030-2050 2003-2050
(Annual growth rates in percent)
OECD 0.8 0.4 -0.2 0.1
OECD North America 1.3 0.9 0.5 0.7
OECD Europe 0.5 0.1 -0.9 -0.3
OECD Pacific 0.8 0.0 -0.2 -0.1
Transition economies 0.5 -0.3 -0.1 -0.2
Developing countries 2.0 1.2 0.9 1.1
China 1.4 0.4 0.1 0.3
India 2.0 1.1 0.5 0.9
Other Asia 2.1 1.3 0.9 1.1
Middle East 3.1 1.9 2.0 1.9
Latin America 1.9 1.0 0.7 0.9
Africa 2.7 1.9 1.8 1.9
World 1.6 1.0 0.7 0.9
Dirk Willenbockel
18 German Development Institute
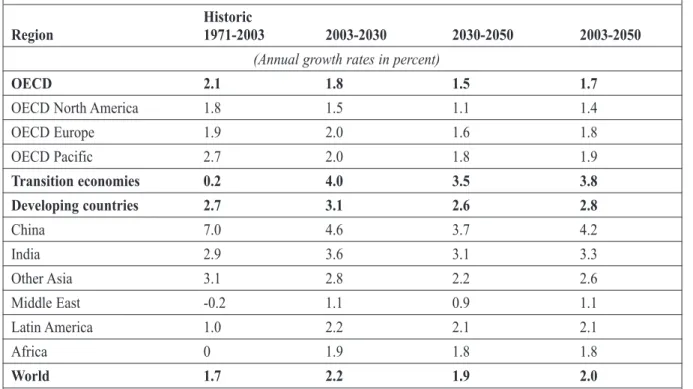
Economic drivers
Assumed absolute GDP growth rates are based on projections for the World Energy Outlook 2004 and 2005, which are in turn based on IMF projections. GDP growth is expected to slow gradually in all regions to 2050. Average annual global per-capita income growth over the en- tire 2003-50 period is on the order of 2.0%. This is considerably lower than global per-capita income growth under the MEA OG and TG scenarios but higher than under the OS and AM scenarios. Table 6 provides a breakdown by region. All regions are expected to experience a continuing shift in their economies away from energy-intensive heavy manufacturing towards lighter industries and services.
Policy drivers
The development and uptake of cleaner and more efficient energy technologies in the scenar- ios is driven by the following main types of policies:
(i) Support for the research and development of energy technologies that face technical chal- lenges and need to reduce costs before they become commercially viable;
(ii) Demonstration programmes for energy technologies that need to prove they can work on a commercial scale and under relevant operating conditions;
(iii) Deployment programmes for energy technologies which are not yet cost-competitive, but whose costs could be reduced through learning-by-doing;
Table 6: Per-capita GDP growth in the IEA scenarios
Source: Own calculations based on IEA (2006, Tables B-1 and B-2) Historic
Region 1971-2003 2003-2030 2030-2050 2003-2050
(Annual growth rates in percent)
OECD 2.1 1.8 1.5 1.7
OECD North America 1.8 1.5 1.1 1.4
OECD Europe 1.9 2.0 1.6 1.8
OECD Pacific 2.7 2.0 1.8 1.9
Transition economies 0.2 4.0 3.5 3.8
Developing countries 2.7 3.1 2.6 2.8
China 7.0 4.6 3.7 4.2
India 2.9 3.6 3.1 3.3
Other Asia 3.1 2.8 2.2 2.6
Middle East -0.2 1.1 0.9 1.1
Latin America 1.0 2.2 2.1 2.1
Africa 0 1.9 1.8 1.8
World 1.7 2.2 1.9 2.0