International Journal of
Molecular Sciences
Article
Photocycle Dynamics of the Archaerhodopsin 3 Based Fluorescent Voltage Sensor QuasAr1
Alfons Penzkofer
1,*, Arita Silapetere
2and Peter Hegemann
21
Fakultät für Physik, Universität Regensburg, Universitätsstraße 31, D-93053 Regensburg, Germany
2
Experimentelle Biophysik, Institut für Biologie, Humboldt Universität zu Berlin, Invalidenstraße 42, D-10115 Berlin, Germany; arita.silapetere@hu-berlin.de (A.S.); hegemann@rz.hu-berlin.de (P.H.)
* Correspondence: alfons.penzkofer@physik.uni-regensburg.de; Tel.: +49-941-943-2107
Received: 8 November 2019; Accepted: 19 December 2019; Published: 25 December 2019
Abstract: The retinal photocycle dynamics of the fluorescent voltage sensor QuasAr1 (Archaerhodopsin 3 P60S-T80S-D95H-D106H-F161V mutant from Halorubrum sodomense) in pH 8 Tris buffer was studied. The samples were photoexcited to the first absorption band of the protonated retinal Schiff base (PRSB) Ret_580 (absorption maximum at λ
max≈ 580 nm), and the retinal Schiff base photoisomerization and protonation state changes were followed by absorption spectra recordings during light exposure and after light exposure. Ret_580 turned out to be composed of two protonated retinal Schiff base isomers, namely Ret_580
Iand Ret_580
II. Photoexcitation of Ret_580
Iresulted in barrier-involved isomerization to Ret_540 (quantum yield ≈ 0.056) and subsequent retinal proton release leading to Ret_410 deprotonated retinal Schiff base (RSB). In the dark, Ret_410 partially recovered to Ret_580
Iand partially stabilized to irreversible Ret_400 due to apoprotein restructuring (Ret_410 lifetime ≈ 2 h). Photoexcitation of Ret_580
IIresulted in barrier-involved isomerization to Ret_640 (quantum yield ≈ 0.00135) and subsequent deprotonation to Ret_370 (RSB).
In the dark, Ret_370 partially recovered to Ret_580
IIand partially stabilized to irreversible Ret_350 due to apoprotein restructuring (Ret_370 lifetime ≈ 10 h). Photocycle schemes and reaction coordinate diagrams for Ret_580
Iand Ret_580
IIwere developed and photocyle parameters were determined.
Keywords: QuasAr1; Archaerhodopsin 3; genetically encoded fluorescent voltage sensor; absorption spectroscopic characterization; fluorescence studies; photocycle dynamics; photoisomerization;
deprotonation; reprotonation
1. Introduction
Tracking membrane potential of cells, especially neurons, using fluorescence methods is of high interest and is an active field of research (change of membrane voltage causes change of fluorescence efficiency) [1–10]. To determine membrane voltage, a variety of voltage sensitive dyes [11–13], genetically encoded calcium indicators (GECI) [4,14,15], and genetically encoded voltage indicators (GEVI) based on voltage sensing domains (VSD, composed of four trans-membrane helices and fused fluorescent proteins) [16–20] and on microbial rhodopsins (composed of seven trans-membrane α -helices with covalently bound retinal, using the intrinsic fluorescence of retinal [9,10,21–23] or the modified fluorescence from attached fluorescent proteins [19,23,24] or dyes [12]) are in use. Often, Förster-type resonance energy transfer (FRET) is involved in dye or fluorescent protein connection to VSDs and rhodopins [12,25].
All-optical electrophysiology in neuroscience was achieved by channelrhodopsin based optical perturbation of membrane potentials and the membrane potential readout with fluorescent voltage sensing domains [26–28].
Int. J. Mol. Sci.2020,21, 160; doi:10.3390/ijms21010160 www.mdpi.com/journal/ijms
Int. J. Mol. Sci.2020,21, 160 2 of 22
Most microbial rhodopsin voltage indicators are based on Archaerhodopsin 3 (Arch) from Halorubrum sodomense [29] and variants thereof obtained by mutations (Arch D95N [29], Arch D95N-D106E [27], Arch D95Q-D106E [30], Archer1 (=Arch D95E-T99C) [31], Archer2 (=Arch D95E-T99C-A225M) [31], QuasAr1 (=Arch P60S-T80S-D95H-D106H-F161V) [26], QuasAr2 (=QuasAr1 H95Q) [26], QuasAr3 (=QuasAr2 K171R) [28], paQuasAr3 (=QuasAr3 V59A) [28], Archon1 (=Arch T20S-G41A-V44E-P60S-T80P-D86N-D95Q-D106H-A136T-F161V-T183I-L197I-G241Q) [32], and Archon2 (=Arch T56P-P60S-T80P-D95H-T99S-T116I-F161V-T183I-L197I-A225C) [32]).
The mutations improved the fluorescence intensity dependence on membrane voltage and the membrane localization [26,28,31,32].
Here, a detailed study is presented of the photocycle dynamics of QuasAr1 (“Quality superior to Arch”) in pH 8 Tris buffer to better understand the photoexcitation and relaxation dynamics affecting the behavior of the fluorescent voltage sensor.
The analysis of the photocycle dynamics revealed that Ret_580 was composed of two protonated retinal Schiff base (PRSB) isomers, named Ret_580
Iand Ret_580
II, with different photocycle dynamics (different photoisomerization paths, isomerization yields, deprotonation rates, and protonation recoveries). Schemes of the photocycle were developed according to the experimental results.
While the photoisomerization occurred on a ten picoseconds timescale, the protonated retinal Schiff base deprotonation to neutral retinal Schiff base (RSB) in the formed isomeric states occurred on a ten seconds timescale. The reprotonation to the original state was found to be slow, of the order of an hour for the reformation of Ret_580
Iand of the order of ten hours for the reformation of Ret_580
II. The slow reformation of Ret_580
Iand Ret_580
IIwas competing with thermal apoprotein restructuring leading to RSB stabilization without reprotonation. The thermal dynamics of QuasAr1 was studied in a separate paper (apparent melting temperature determination, thermal activated ground-state protonated retinal Schiff base isomerization, deprotonation, and apoprotein restructuring) [33].
2. Results
The QuasAr1 samples in pH 8 Tris buffer were photoexcited to the first absorption band (protonated retinal Schiff base Ret_580) in the green-yellow-orange spectral range, and the retinal photoisomerization and protonation state changes were followed by absorption spectra recordings during light exposure and after light exposure. The temporal absorption coefficient development at fixed wavelengths was measured with high time resolution. Additionally, excitation wavelength dependent fluorescence emission quantum distributions were measured immediately after excitation light switch-off and after sample recovery in the dark (results presented in the Supplementary Materials). Emission wavelength dependent fluorescence excitation quantum distributions were also determined after sample recovery (results are shown in the Supplementary Materials).
2.1. Absorption Spectroscopic Photocycle Studies
QuasAr1 samples were excited with light emitting diodes LED 590 nm (excitation near absorption
maximum of Ret_580) and LED 530 nm (excitation near absorption maximum of protonated retinal
Schiff base photoisomer Ret_540 of Ret_580
I) as well as with a HeNe laser at 632.8 nm (excitation near
absorption maximum of protonated retinal Schiff base photoisomer Ret_640 of Ret_580
II). For the
excitation with LED 590 nm, photocycle studies with three different excitation intensities were carried
out to study the dependence of the photocycle dynamics on the excitation intensity. The excitations
with LED530 nm and a HeNe laser were carried out to study the influence of the excitation wavelength
within the broad S
0–S
1absorption band of the Ret_580 chromophores and of the formed photoisomer
excitations on the photocycle dynamics.
The results of the photocycle studies with LED 590 nm at high excitation intensity are presented below (Figures 1–4), while the results of the photocycle studies with LED 590 nm at medium intensity (Figures S1–S3) and at low intensity (Figures S4 and S5) as well as the results of the photocycle studies with LED 530 nm (Figures S6–S9) and with the HeNe laser (Figures S10–S13) are presented in the Supplementary Materials.
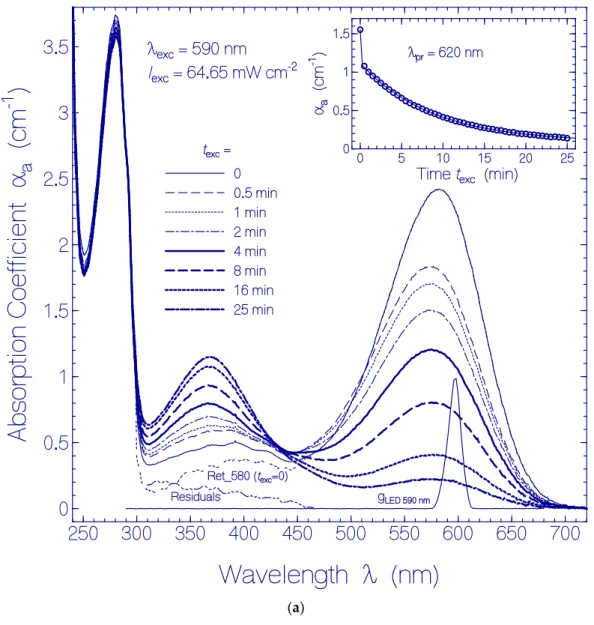
In Figure 1a, the development of absorption coefficient spectra of QuasAr1 in pH 8 buffer during light exposure with LED 590 nm ( λ
exc= 590 nm) of input intensity I
exc= 64.65 mW cm
−2is displayed.
The spectral light distribution g
LED 590 nm( λ ) of the LED 590 nm is included in the figure. The absorption coefficient curves belong to the exposure times listed in the legend. With increasing exposure time, the curves show the decrease of the absorption band around 580 nm and the dominant buildup of an absorption band around 370 nm. The triple-dotted curve belonging to t
exc= 0 (named Ret_580 (t
exc= 0)) shows the initial absorption coefficient spectrum of QuasAr1 deprived from retinal isomer contributions other than Ret_580 (dashed triple dotted curve named Residuals). The curves Ret_580 (t
exc= 0) and Residuals were determined in [33]. The inset in Figure 1a shows the temporal development of the absorption coefficient α
a(t
exc) at the probe wavelength λ
pr= 620 nm (long-wavelength absorption region of Ret_580). It indicates an initially fast absorption decrease (photoconversion of Ret_580
Icomponent) followed by a slow absorption decrease (photoconversion of Ret_580
IIcomponent).
Int. J. Mol. Sci. 2020, 21, x FOR PEER REVIEW 3 of 22
In Figure 1a, the development of absorption coefficient spectra of QuasAr1 in pH 8 buffer during light exposure with LED 590 nm (λ
exc= 590 nm) of input intensity I
exc= 64.65 mW cm
−2is displayed.
The spectral light distribution g
LED 590 nm(λ) of the LED 590 nm is included in the figure. The absorption coefficient curves belong to the exposure times listed in the legend. With increasing exposure time, the curves show the decrease of the absorption band around 580 nm and the dominant buildup of an absorption band around 370 nm. The triple-dotted curve belonging to t
exc= 0 (named Ret_580 (t
exc= 0)) shows the initial absorption coefficient spectrum of QuasAr1 deprived from retinal isomer contributions other than Ret_580 (dashed triple dotted curve named Residuals). The curves Ret_580 (t
exc= 0) and Residuals were determined in [33]. The inset in Figure 1a shows the temporal development of the absorption coefficient α
a(t
exc) at the probe wavelength λ
pr= 620 nm (long- wavelength absorption region of Ret_580). It indicates an initially fast absorption decrease (photoconversion of Ret_580
Icomponent) followed by a slow absorption decrease (photoconversion of Ret_580
IIcomponent).
(a)
Figure 1. Cont.
Int. J. Mol. Sci.2020,21, 160 4 of 22
Int. J. Mol. Sci. 2020, 21, x FOR PEER REVIEW 4 of 22
(b)
Figure 1. (a) Development of absorption coefficient spectra of a QuasAr1 sample in pH 8 Tris buffer during light exposure with LED 590 nm with input excitation intensity of I
exc= 64.65 mW cm
−2. The durations of light exposure are listed in the figure. The triple dotted curve named Ret_580 (t
exc= 0) in the wavelength range >310 nm shows the absorption coefficient contribution of Ret_580 to QuasAr1 before light exposure (taken from Figure 1 in [33]). The dashed triple-dotted curve named Residuals shows the absorption coefficient contribution of residual retinal isomers in QuasAr1 other than Ret_580 (taken from Figure 1 in [33]). The curve g
LED 590 nm(λ) = S
LED 590 nm(λ)/S
LED 590 nm(λ
max) shows the spectral distribution of the excitation light source LED 590 nm. The inset shows the temporal dependence of α
a(620 nm) versus exposure time t
exc. The data points are fitted by
(
,) (
,)
( ) (0) 1 exp / 1 exp /
a
t
rec a It
exc sat I IIt
exc sat IIα = α − Δ α − − τ − Δ α − − τ with α
a(0) = 1.554 cm
−1, Δα
I= 0.436 cm
−1, τ
sat,I= 0.015 min, Δα
II= 1.03 cm
−1, and τ
sat,II= 8.65 min. (b) Absorption coefficient spectra of formed species of QuasAr1 in pH 8 Tris buffer due to light exposure with LED 590 nm of input intensity I
exc= 64.65 mW cm
−2. The absorption contributions of Ret_580, α
aRet_580(λ, t
exc), and of the initial residuals, α
a,Residuals(λ,0), from Figure 1a are subtracted, i.e.,
,Ret_580 ,Residuals
( , ) ( , ) ( , ) ( , 0)
a
t
exc at
exc at
exc at
excα λ α λ α λ α λ
Δ = − − = . The approximate peak wavelength
positions of the retinal isomers Ret_640, Ret_540, Ret_460, Ret_410, and Ret_370 are indicated at the bottom. The inset shows the temporal development of Δα
aat λ
pr= 540 nm, 460 nm, 410 nm, and 370 nm versus exposure time t
exc.
More detailed information on the photoinduced retinal isomerization and deprotonation dynamics of Ret_580 during light exposure was obtained by subtracting the remaining Ret_580 absorption coefficient contributions α
a,Ret_580(λ,t
exc) at time t
excand the initial residual retinal isomers
Figure 1. (a) Development of absorption coefficient spectra of a QuasAr1 sample in pH 8 Tris buffer during light exposure with LED 590 nm with input excitation intensity of I
exc= 64.65 mW cm
−2. The durations of light exposure are listed in the figure. The triple dotted curve named Ret_580 (t
exc= 0) in the wavelength range >310 nm shows the absorption coefficient contribution of Ret_580 to QuasAr1 before light exposure (taken from Figure 1 in [33]). The dashed triple-dotted curve named Residuals shows the absorption coefficient contribution of residual retinal isomers in QuasAr1 other than Ret_580 (taken from Figure 1 in [33]). The curve g
LED 590 nm(λ) = S
LED 590 nm(λ)/S
LED 590 nm(λ
max) shows the spectral distribution of the excitation light source LED 590 nm.
The inset shows the temporal dependence of α
a(620 nm) versus exposure time t
exc. The data points are fitted by α
a( t
rec) = α
a( 0 ) − ∆α
I[ 1 − exp ( − t
exc/τ
sat,I)] − ∆α
II[ 1 − exp ( − t
exc/τ
sat,II)] with α
a(0) = 1.554 cm
−1, ∆α
I= 0.436 cm
−1, τ
sat,I= 0.015 min, ∆α
II= 1.03 cm
−1, and τ
sat,II= 8.65 min.
(b) Absorption coefficient spectra of formed species of QuasAr1 in pH 8 Tris buffer due to light
exposure with LED 590 nm of input intensity I
exc= 64.65 mW cm
−2. The absorption contributions
of Ret_580, α
aRet_580(λ, t
exc), and of the initial residuals, α
a,Residuals(λ,0), from (a) are subtracted,
i.e., ∆α
a( λ, t
exc) = α
a( λ, t
exc) − α
a,Ret_580( λ, t
exc) − α
a,Residuals( λ, t
exc= 0 ) . The approximate peak
wavelength positions of the retinal isomers Ret_640, Ret_540, Ret_460, Ret_410, and Ret_370 are
indicated at the bottom. The inset shows the temporal development of ∆ α
aat λ
pr= 540 nm, 460 nm,
410 nm, and 370 nm versus exposure time t
exc.
Int. J. Mol. Sci. 2020, 21, x FOR PEER REVIEW 6 of 22
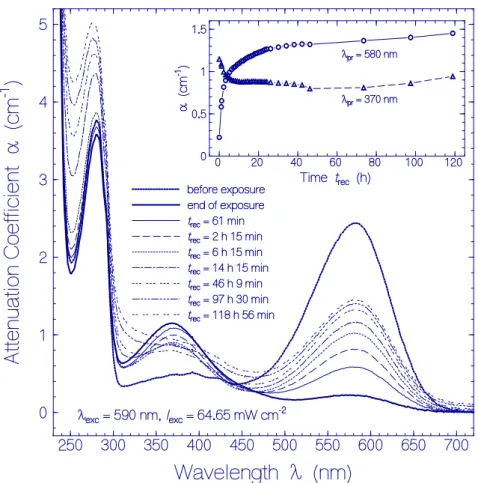
Figure 2. Attenuation coefficient spectra recovery of QuasAr1 in pH 8 Tris buffer after light exposure
with LED 590 nm (input excitation intensity I
exc= 64.65 mW cm
−2) for an exposure time of t
exc= 25 min (see Figure 1a). The durations of recovery t
recare listed in the Figure. The attenuation coefficient spectra before exposure (t
exc= 0) and at end of exposure (t
exc= 25 min) are included. The inset shows the attenuation coefficient recovery α (t
rec) at λ
pr= 580 nm and 370 nm.
The corresponding absorption coefficient spectra development (scattering contributions approximately subtracted) is shown in Figure 3a. The absorption band centered at 580 nm (Ret_580) recovered partly, and the formed absorption band around 370 nm (Ret_370 including Ret_410) disappeared partly. The absorption band around 280 nm (dominant tryptophan absorption) increased steadily due to thermal apoprotein restructuring [33]. The inset in Figure 3a shows the partial absorption coefficient recovery at λ
pr= 580 nm were the absorption is determined by Ret_580, and the partial absorption coefficient decrease at λ
pr= 370 nm due to reprotonation of Ret_370 to Ret_580. The only partial reconversion of Ret_370 to Ret_580 is due to a changeover from the reversible photocycle dynamics to the thermal irreversible deprotonation of Ret_580 and the Ret_370 ground-state potential energy lowering below the ground-state energy level of Ret_580 (changeover from Ret_370 to Ret_350, see discussion below) caused by the dynamic thermal apoprotein restructuring [33] during the slow recovery time of the photocycle process.
Figure 2. Attenuation coefficient spectra recovery of QuasAr1 in pH 8 Tris buffer after light exposure with LED 590 nm (input excitation intensity I
exc= 64.65 mW cm
−2) for an exposure time of t
exc= 25 min (see Figure 1a). The durations of recovery t
recare listed in the Figure. The attenuation coefficient spectra before exposure (t
exc= 0) and at end of exposure (t
exc= 25 min) are included. The inset shows the attenuation coefficient recovery α (t
rec) at λ
pr= 580 nm and 370 nm.
More detailed information on the photoinduced retinal isomerization and deprotonation dynamics of Ret_580 during light exposure was obtained by subtracting the remaining Ret_580 absorption coefficient contributions α
a,Ret_580(λ,t
exc) at time t
excand the initial residual retinal isomers contributions Residuals from the developing absorption coefficient spectra of Figure 1a.
The remaining Ret_580 absorption coefficient contributions are approximately determined by α
a,Ret_580( λ, t
exc) ≈ α
a,Ret_580( λ, t
exc= 0 ) × α
a( λ = 620 nm, t
exc) /α
a( λ = 620 nm, t
exc= 0 ) (the spectral shape of α
a,Ret_580is assumed to do not change with exposure time, the magnitude of α
a,Ret_580( λ = 620 nm, t
exc) is nearly given by the magnitude of α
a( λ = 620 nm, t
exc) of QuasAr1 since at λ = 620 nm absorption contributions from formed species are thought to be small). The resulting curves ∆α
a( λ, t
exc) = α
a( λ, t
exc) − α
a,Ret_580( λ, t
exc) − α
a,Residuals( λ, t
exc= 0 ) , which are displayed in the main part of Figure 1b, show the absorption coefficient spectra development of formed species of QuasAr1 due to the light exposure. New absorption bands are seen around λ ≈ 540 nm (PRSB Ret_540),
≈ 460 nm (PRSB Ret_460), ≈ 410 nm (RSB Ret_410), and ≈ 370 nm (RSB Ret_370). There is an indication
of a new absorption band around 640 nm (PRSB Ret_640). The absorption band of Ret_540 extends out
beyond λ
exc= 590 nm. The temporal developments of ∆ α
aat the probe wavelengths λ
pr= 540 nm,
460 nm, 410 nm, and 370 nm are depicted in the inset of Figure 1b. The absorption band of Ret_540
decreased with continued light exposure. It is thought that Ret_540 is formed by photoisomerization of
PRSB Ret_580
I(likely 13-cis isomer in specific apoprotein conformation Apoprotein
I) to PRSB Ret_540
(likely all-trans isomer in apoprotein conformation Apoprotein
I). The decrease of Ret_540 for t
exc> 30 s
is thought to be determined dominantly by deprotonation of Ret_540 to Ret_410. The absorption bands
Int. J. Mol. Sci.2020,21, 160 6 of 22
of Ret_460, Ret_410, and Ret_370 are overlapping. Ret_370 was built up during the whole time of light exposure. It is thought that Ret_580
II(likely all-trans isomer in specific apoprotein conformation Apoprotein
II) is converted to Ret_370 (likely formed by photoisomerization of all-trans retinal isomer to a cis isomer Ret_640 in specific apoprotein conformationApoprotein
IIand subsequent deprotonation, for details see discussion below). At λ
pr= 460 nm the absorption changes are dominated by the short-wavelength tail of Ret_540 and the long-wavelength tails of Ret_410 and Ret_370. The build-up of Ret_460 population is small and only indicated by a small absorption structure change around 460 nm.
The attenuation coefficient spectra development of the QuasAr1 sample used in Figure 1a after excitation light switch-off over a recovery time range of nearly five days (sample in the dark at room temperature) is displayed in Figure 2. The inset in Figure 2 shows the temporal attenuation coefficient development at λ
pr= 580 nm and 370 nm.
Int. J. Mol. Sci. 2020, 21, x FOR PEER REVIEW 7 of 22
(a)
Figure 3. Cont.
Int. J. Mol. Sci. 2020, 21, x FOR PEER REVIEW 8 of 22
(b)
Figure 3. (a) Absorption coefficient spectra recovery of QuasAr1 in pH 8 Tris buffer after light exposure with LED 590 nm (input excitation intensity I
exc= 64.65 mW cm
−2) for an exposure time of t
exc= 25 min (see Figure 1a). Immediately after the end of exposure, fluorescence emission spectra were measured. The durations of recovery t
recare listed in the figure. The absorption coefficient spectra before exposure (t
exc= 0) and at the end of exposure (t
exc= 25 min) are included. The inset shows the absorption coefficient recoveries α
a(t
rec) at λ
pr= 580 nm and 370 nm. The data points are fitted by α
a( t
rec) = α
a(0) + Δ α
I 1 exp − ( − t
rec/ τ
rec I,) + Δ α
II 1 exp − ( − t
rec/ τ
rec II,) with α
a(0,580 nm) = 0.22 cm
−1, Δα
I(580 nm) = 0.71 cm
−1, τ
rec,I(580 nm) = 1.52 h, Δα
II(580 nm) = 0.376 cm
−1, τ
rec,II(580 nm)
= 19.26 h, α
a(0,370 nm) = 1.15 cm
−1, Δα
I(370 nm) = −0.195 cm
−1, τ
rec,I(370 nm) = 2.96 h, Δα
II(370 nm) =
−0.358 cm
−1, and τ
rec,II(370 nm) = 26.7 h. (b) Absorption coefficient difference spectra development
,Ret_580 ,Residuals
( , ) ( , ) ( , ) ( , 0)
a
t
rec at
rec at
rec at
excα λ α λ α λ α λ
Δ = − − = of QuasAr1 in pH 8 Tris buffer after
light exposure with LED 590 nm of input intensity I
exc= 64.65 mW cm
−2for 25 min. The inset shows the temporal development of Δα
aat λ
pr= 640 nm, 540 nm, 460 nm, 410 nm, and 370 nm versus recovery time t
rec.
In order to see details in the absorption coefficient spectra development after excitation light switch-off in Figure 3a, the absorption coefficient spectra development
,Ret_580 ,Residuals
( , ) ( , ) ( , ) ( , 0)
a
t
rec at
rec at
rec at
excα λ α λ α λ α λ
Δ = − − = is displayed in Figure 3b (Ret_580
contribution and initial residual retinal contributions are subtracted from Figure 3a). The inset of Figure 3b shows the temporal development of Δα
a(t
rec) at the probe wavelengths λ
pr= 540 nm, 460
Figure 3. (a) Absorption coefficient spectra recovery of QuasAr1 in pH 8 Tris buffer after light exposure with LED 590 nm (input excitation intensity I
exc= 64.65 mW cm
−2) for an exposure time of t
exc= 25 min (see Figure 1a). Immediately after the end of exposure, fluorescence emission spectra were measured. The durations of recovery t
recare listed in the figure. The absorption coefficient spectra before exposure (t
exc= 0) and at the end of exposure (t
exc= 25 min) are included.
The inset shows the absorption coefficient recoveries α
a(t
rec) at λ
pr= 580 nm and 370 nm. The data points are fitted by α
a( t
rec) = α
a( 0 ) + ∆α
I[ 1 − exp ( − t
rec/τ
rec,I)] + ∆α
II[ 1 − exp ( − t
rec/τ
rec,II)] with α
a(0,580 nm) = 0.22 cm
−1, ∆ α
I(580 nm) = 0.71 cm
−1, τ
rec,I(580 nm) = 1.52 h, ∆ α
II(580 nm) = 0.376 cm
−1, τ
rec,II(580 nm) = 19.26 h, α
a(0,370 nm) = 1.15 cm
−1, ∆α
I(370 nm) = − 0.195 cm
−1, τ
rec,I(370 nm) = 2.96 h,
∆α
II(370 nm) = − 0.358 cm
−1, and τ
rec,II(370 nm) = 26.7 h. (b) Absorption coefficient difference spectra development ∆α
a( λ, t
rec) = α
a( λ, t
rec) − α
a,Ret_580( λ, t
rec) − α
a,Residuals( λ, t
exc= 0 ) of QuasAr1 in pH 8 Tris buffer after light exposure with LED 590 nm of input intensity I
exc= 64.65 mW cm
−2for 25 min.
The inset shows the temporal development of ∆α
aat λ
pr= 640 nm, 540 nm, 460 nm, 410 nm, and 370 nm
versus recovery time t
rec.
Int. J. Mol. Sci.2020,21, 160 8 of 22
Int. J. Mol. Sci. 2020, 21, x FOR PEER REVIEW 9 of 22
nm, 410 nm, 370 nm, and 640 nm. The absorption of Ret_370, Ret_410, and Ret_460 decreased within the first 20 h of light switch-off and then leveled off. Δα
a(640 nm,t
rec) indicates the formation of Ret_640 by thermal activation of isomerization of Ret_580
II[33].
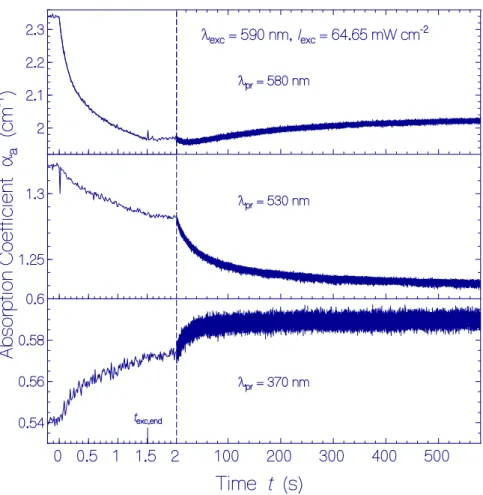
The temporal absorption coefficient developments with a time resolution of δt
res= 12.5 ms at λ
pr= 580 nm, 530 nm, and 370 nm are displayed in Figure 4 for a QuasAr1 sample in pH 8 Tris buffer. A fresh thawed sample was used. In the first run, the probe wavelength was set to λ
pr= 580 nm, the exposure time was t
exc= 1.5 s, and the time of recovery in the dark was set to 10 min. Then, it was followed immediately by the second run with the same exposure/dark parameters at λ
pr= 530 nm.
Next, it was followed immediately by the third run with the same exposure/dark parameters at λ
pr= 370 nm.
.
Figure 4. Temporal absorption coefficient development of QuasAr1 in pH 8 Tris buffer at the probe wavelengths λ
pr= 580 nm (top part, peak absorption of Ret_580), 530 nm (middle part, near peak absorption of Ret_540), and 370 nm (bottom part, peak absorption of Ret_370) before, during, and after photoexcitation with LED 590 nm of excitation intensity I
exc= 64.65 mW cm
−2for a duration of t
exc= 1.5 s. The same sample was used. Immediately after measurement at λ
pr= 580 nm, the measurement was continued at λ
pr= 530 nm, and then, at λ
pr= 370 nm. In the top left subfigure, the data points during light exposure are fitted by
( ) ( )
, ,
( ) (0) 1 exp / 1 exp /
a
t
exc a a It
exc I a IIt
rec IIα = α − Δ α − − τ − Δ α − − τ with α
a(0) = 2.34 cm
−1, Δα
a,I= 0.172 cm
−1, τ
I= 116 ms, Δα
a,II= 0.245 cm
−1, and τ
II= 907 ms. A fit of the right part of the middle subfigure with α
a( t t >
exc end,) = α
a( t
exc end,) − Δ α
a 1 exp − ( − − ( t t
exc end,) / τ
rel,Ret_540) gives αa(t
exc,end)
= 1.284 cm
−1, Δα
a= 0.0425 cm
−1, and τ
rel,Ret_540= 37 s. A fit of the right part of the bottom subfigure with
( )
( )
, , , ,Ret_640
( ) ( ) 1 exp /
a
t t
exc end at
exc end at t
exc end relα > = α + Δ α − − − τ gives α
a(t
exc,end) = 0.571 cm
−1, Δα
a= 0.017 cm
−1, and τ
rel,Ret_640= 19.3 s.
Figure 4. Temporal absorption coefficient development of QuasAr1 in pH 8 Tris buffer at the probe wavelengths λ
pr= 580 nm (top part, peak absorption of Ret_580), 530 nm (middle part, near peak absorption of Ret_540), and 370 nm (bottom part, peak absorption of Ret_370) before, during, and after photoexcitation with LED 590 nm of excitation intensity I
exc= 64.65 mW cm
−2for a duration of t
exc= 1.5 s.
The same sample was used. Immediately after measurement at λ
pr= 580 nm, the measurement was continued at λ
pr= 530 nm, and then, at λ
pr= 370 nm. In the top left subfigure, the data points during light exposure are fitted by α
a( t
exc) = α
a( 0 ) − ∆α
a,I[ 1 − exp ( − t
exc/τ
I)] − ∆α
a,II[ 1 − exp ( − t
rec/τ
II)] with α
a(0) = 2.34 cm
−1, ∆ α
a,I= 0.172 cm
−1, τ
I= 116 ms, ∆ α
a,II= 0.245 cm
−1, and τ
II= 907 ms. A fit of the right part of the middle subfigure with α
a( t > t
exc,end) = α
a( t
exc,end) − ∆α
ah 1 − exp
−
t − t
exc,end/τ
rel,Ret_540i
gives α
a(t
exc,end) = 1.284 cm
−1, ∆α
a= 0.0425 cm
−1, and τ
rel,Ret_540= 37 s. A fit of the right part of the bottom subfigure with α
a( t > t
exc,end) = α
a( t
exc,end) + ∆α
ah 1 − exp
−
t − t
exc,end/τ
rel,Ret_640i gives α
a(t
exc,end) = 0.571 cm
−1, ∆ α
a= 0.017 cm
−1, and τ
rel,Ret_640= 19.3 s.
The corresponding absorption coefficient spectra development (scattering contributions
approximately subtracted) is shown in Figure 3a. The absorption band centered at 580 nm (Ret_580)
recovered partly, and the formed absorption band around 370 nm (Ret_370 including Ret_410)
disappeared partly. The absorption band around 280 nm (dominant tryptophan absorption) increased
steadily due to thermal apoprotein restructuring [33]. The inset in Figure 3a shows the partial absorption
coefficient recovery at λ
pr= 580 nm were the absorption is determined by Ret_580, and the partial
absorption coefficient decrease at λ
pr= 370 nm due to reprotonation of Ret_370 to Ret_580. The only
partial reconversion of Ret_370 to Ret_580 is due to a changeover from the reversible photocycle
dynamics to the thermal irreversible deprotonation of Ret_580 and the Ret_370 ground-state potential
energy lowering below the ground-state energy level of Ret_580 (changeover from Ret_370 to Ret_350,
see discussion below) caused by the dynamic thermal apoprotein restructuring [33] during the slow
recovery time of the photocycle process.
In order to see details in the absorption coefficient spectra development after excitation light switch-off in Figure 3a, the absorption coefficient spectra development ∆α
a( λ, t
rec) = α
a( λ, t
rec) − α
a,Ret_580( λ, t
rec) − α
a,Residuals( λ, t
exc= 0 ) is displayed in Figure 3b (Ret_580 contribution and initial residual retinal contributions are subtracted from Figure 3a). The inset of Figure 3b shows the temporal development of ∆ α
a(t
rec) at the probe wavelengths λ
pr= 540 nm, 460 nm, 410 nm, 370 nm, and 640 nm.
The absorption of Ret_370, Ret_410, and Ret_460 decreased within the first 20 h of light switch-off and then leveled off. ∆ α
a(640 nm,t
rec) indicates the formation of Ret_640 by thermal activation of isomerization of Ret_580
II[33].
The temporal absorption coefficient developments with a time resolution of δt
res= 12.5 ms at λ
pr= 580 nm, 530 nm, and 370 nm are displayed in Figure 4 for a QuasAr1 sample in pH 8 Tris buffer.
A fresh thawed sample was used. In the first run, the probe wavelength was set to λ
pr= 580 nm, the exposure time was t
exc= 1.5 s, and the time of recovery in the dark was set to 10 min. Then, it was followed immediately by the second run with the same exposure/dark parameters at λ
pr= 530 nm.
Next, it was followed immediately by the third run with the same exposure/dark parameters at λ
pr= 370 nm.
The top part of Figure 4 shows the absorption development at λ
pr= 580 nm during and after light exposure. During light exposure, the absorption decreased dominantly by photoisomerization of Ret_580
Ito Ret_540. After excitation light switch-off, initially a minute absorption decrease is observed likely due to the conversion of Ret_540 to Ret_410 (absorption band of Ret_540 extends out to 580 nm).
The following slight absorption increase is thought to be due to partial reprotonation of Ret_410 to Ret_580
I(see discussion below).
The middle part of Figure 4 shows the absorption development at λ
pr= 530 nm in a second exposure of the sample. The absorption decrease during light exposure is due to the absorption decrease of the broad absorption band of Ret_580 which dominates the absorption at 530 nm. The weaker absorption decrease, as compared with λ
pr= 580 nm, is due to the formation of the absorption band of Ret_540 during light exposure. After light switch-off, the absorption at 530 nm decreased because of deprotonation of Ret_540 to Ret_410 (time constant τ
rel,Ret_540≈ 37 s, see discussion below). The spike at the position of light switch-on is thought to be an artifact caused by a photoinduced transient thermal grating [34,35] (the same effect was observed by replacing the QuasAr1 sample with a sample of rhodamine 6G in methanol).
The bottom part of Figure 4 shows the absorption development at λ
pr= 370 nm in a third exposure of the sample. After excitation light switch-on, the increase of absorption is slightly time delayed ( ≈ 0.1 s). After excitation light switch-off (t
exc,end= 1.5 s), the absorption continues to increase within the first 40 s, and then, levels off (time constant τ
rel,Ret_640≈ 17 s). The absorption dynamics is thought to be dominated by the conversion of Ret_640 to Ret_370 by proton release (see discussion below).
2.2. Quantum Yield of Photoconversion
The quantum yield of photoconversion φ
conof Ret_580 to other retinal isomers during light exposure is given [36] by the ratio of the number density ∆N
conof converted Ret_580 molecules to the number density ∆n
ph,absof absorbed photons by Ret_580, i.e.,
φ
con= ∆N
con∆n
ph,abs(1)
The number density ∆N
conis determined by
∆N
con= N
0∆α
a( λ
pr)
α
a,0( λ
pr) (2)
Int. J. Mol. Sci.2020,21, 160 10 of 22
where N
0is the initial number density of Ret_580, α
a,0( λ
pr) is the initial absorption coefficient of Ret_580 at the probe wavelength λ
pr, and ∆ α
a(λ
pr) is the absorption coefficient change of Ret_580 at λ
pr( λ
pris selected at a wavelength region where practically only Ret_580 is absorbing).
The initial number density N
0of Ret_580 is given by
N
0= α
a,0( λ
pr)
σ
a( λ
pr) (3)
where σ
a( λ
pr) is the absorption cross-section of Ret_580 at λ
pr. It is presented in Figure S2 of the Supplementary Materials to [33].
The number density ∆n
ph,absof absorbed photons by Ret_580 is determined by the excitation light intensity I
excat the excitation wavelength λ
exc, the time interval of light exposure δt
excand the absorption coefficient α
a( λ
exc) of Ret_580. It is given by
∆n
ph,abs= I
excδt
exchν
excα
a( λ
exc) (4)
where h ν
excis the photon excitation energy ( ν
exc= c
0/ λ
excis the photon frequency, c
0is the speed of light in vacuum, and h is the Planck constant).
The determined approximate quantum yields of photoconversion of Ret_580 versus exposure time are displayed in Figure 5. The φ
con(t
exc) curves give only approximate values of φ
con,Ret_580(t
exc) since α
a( λ
pr,t
exc) used in the calculations is only approximately equal to α
a,Ret_580( λ
pr,t
exc), and the used α
a( λ
exc,t
exc) is only approximately equal to α
a,Ret_580( λ
exc,t
exc). In the main subfigures, λ
pr= 620 nm was used where α
a(λ
pr,t
exc) is nearly equal to α
a,Ret_580(λ
pr,t
exc) during the whole exposure time.
In the insets of the subfigures, λ
pr= 580 nm was used. There, α
a(t
exc) was measured with high time resolution and for the short exposure times α
a( λ
pr,t
exc) remained nearly equal to α
a,Ret_580( λ
pr,t
exc).
The absorption coefficient data in the insets of Figure 1a ( λ
exc= 590 nm, I
exc= 64.65 mW cm
−2, and λ
pr= 620 nm), Figure S1a (λ
exc= 590 nm, I
exc= 14.07 mW cm
−2, and λ
pr= 620 nm), Figure S4a ( λ
exc= 590 nm, I
exc= 1.12 mW cm
−2, and λ
pr= 620 nm), Figure S6a ( λ
exc= 530 nm, I
exc= 114.2 mW cm
−2, and λ
pr= 620 nm), and Figure S10a ( λ
exc= 632.8 nm, I
exc= 15.56 mW cm
−2, and λ
pr= 620 nm) were employed for the main subfigures. The absorption coefficient curves in the top left parts of Figure 4 (λ
exc= 590 nm, I
exc= 64.65 mW cm
−2, and λ
pr= 580 nm), Figure S9 (λ
exc= 530 nm, I
exc= 114.2 mW cm
−2, and λ
pr= 580 nm), and Figure S13 ( λ
exc= 632.8 nm, I
exc= 15.65 mW cm
−2, and λ
pr= 580 nm) were employed for the insets in the subfigures.
All φ
con(t
exc) curves in Figure 5 show an initially fast decrease and a changeover to a near exposure time independent but excitation light intensity dependent low value. As was shown in [33]
and is discussed below, Ret_580 consists of two protonated retinal Schiff base isomers Ret_580
I(fraction κ
Ret_580I≈ 0.41 [33]) and Ret_580
II(fraction κ
Ret_580II≈ 0.59 [33]) with different ground-state
isomerization dynamics [33] and photoisomerization dynamics. The initially large quantum yield of
photoconversion is due to the photoisomerization of Ret_580
Ito Ret_540 and subsequent deprotonation
of Ret_540 to Ret_410. The low quantum yield of photoconversion after conversion of Ret_580
Iis
due to the low-efficient photoisomerization of Ret_580
IIto Ret_640 and subsequent deprotonation to
Ret_370. The excitation intensity dependent lowering of φ
con(t
exc) for t
exc> 0 is due to the generation
of the photoisomers Ret_540 and Ret_640 and their subsequent back photoisomerization of Ret_540 to
Ret_580
Iand Ret_640 to Ret_580
II(see discussion below).
Int. J. Mol. Sci.2020,21, 160 11 of 22
α
a(λ
pr,t
exc) used in the calculations is only approximately equal to α
a,Ret_580(λ
pr,t
exc), and the used α
a(λ
exc,t
exc) is only approximately equal to α
a,Ret_580(λ
exc,t
exc). In the main subfigures, λ
pr= 620 nm was used where α
a(λ
pr,t
exc) is nearly equal to α
a,Ret_580(λ
pr,t
exc) during the whole exposure time. In the insets of the subfigures, λ
pr= 580 nm was used. There, α
a(t
exc) was measured with high time resolution and for the short exposure times α
a(λ
pr,t
exc) remained nearly equal to α
a,Ret_580(λ
pr,t
exc). The absorption coefficient data in the insets of Figure 1a (λ
exc= 590 nm, I
exc= 64.65 mW cm
−2, and λ
pr= 620 nm), Figure S1a (λ
exc= 590 nm, I
exc= 14.07 mW cm
−2, and λ
pr= 620 nm), Figure S4a (λ
exc= 590 nm, I
exc= 1.12 mW cm
−2, and λ
pr= 620 nm), Figure S6a (λ
exc= 530 nm, I
exc= 114.2 mW cm
−2, and λ
pr= 620 nm), and Figure S10a (λ
exc= 632.8 nm, I
exc= 15.56 mW cm
−2, and λ
pr= 620 nm) were employed for the main subfigures.
The absorption coefficient curves in the top left parts of Figure 4 (λ
exc= 590 nm, I
exc= 64.65 mW cm
−2, and λ
pr= 580 nm), Figure S9 (λ
exc= 530 nm, I
exc= 114.2 mW cm
−2, and λ
pr= 580 nm), and Figure S13 (λ
exc= 632.8 nm, I
exc= 15.65 mW cm
−2, and λ
pr= 580 nm) were employed for the insets in the subfigures.
Figure 5. Quantum yield of photoconversion
conof Ret_580 of QuasAr1 in pH 8 Tris buffer to other retinal isomers during light exposure. (Top part) Photoexcitation with LED 590 nm using listed input light intensities (values derived from Figures 1a, S1a and S4a). (Middle part) Photoexcitation with LED 530 nm using excitation intensity of I
exc= 114.2 mW cm
−2(values derived from Figure S6a).
(Bottom part) Photoexcitation with He-Ne laser using I
exc= 15.56 mW cm
−2(values derived from Figure S10a). The curves in the insets are derived from the high time resolution absorption measurements (top part of Figure 4 for λ
exc= 590 nm, top part of Figure S9 for λ
exc= 530 nm, and top part of Figure S13 for λ
exc= 632.8 nm).
All
con(t
exc) curves in Figure 5 show an initially fast decrease and a changeover to a near exposure time independent but excitation light intensity dependent low value. As was shown in [33] and is discussed below, Ret_580 consists of two protonated retinal Schiff base isomers Ret_580
I(fraction
Figure 5. Quantum yield of photoconversion φ
conof Ret_580 of QuasAr1 in pH 8 Tris buffer to other retinal isomers during light exposure. (Top part) Photoexcitation with LED 590 nm using listed input light intensities (values derived from Figure 1a, Figures S1a and S4a). (Middle part) Photoexcitation with LED 530 nm using excitation intensity of I
exc= 114.2 mW cm
−2(values derived from Figure S6a). (Bottom part) Photoexcitation with He-Ne laser using I
exc= 15.56 mW cm
−2(values derived from Figure S10a). The curves in the insets are derived from the high time resolution absorption measurements (top part of Figure 4 for λ
exc= 590 nm, top part of Figure S9 for λ
exc= 530 nm, and top part of Figure S13 for λ
exc= 632.8 nm).
In the top part of Figure 5, the photoconversion of Ret_580 at λ
exc= 590 nm is displayed for three different excitation intensities. The initial quantum yield of photoconversion (for t
exc→ 0) is excitation intensity independent. It is φ
con(t
exc= 0) = φ
con,Ret_580I( t
exc= 0 ) κ
Ret_580I+ φ
con,Ret_580II( t
exc= 0 ) κ
Ret_580II≈ φ
con,Ret_580I( t
exc) κ
Ret_580I≈ 0.023 giving φ
con,Ret_580I( t
exc= 0 ) ≈ 0.056.
After complete photoconversion of Ret_580
I(t
exc> 1 min), the quantum yield of photoconversion is φ
con( t
exc> 1 min, I
exc) ≈ φ
con,Ret_580II( I
exc) which depends on the photoexcitation intensity. We find φ
con,Ret_580II( I
exc= 1.12 mW cm
−2) = (1.19 ± 0.11) × 10
−3, φ
con,Ret_580II( I
exc= 14.07 mW cm
−2) = (1.38 ± 0.084) × 10
−4, and φ
con,Ret_580II( I
exc= 64.65 mW cm
−2) = (4.53 ± 0.31) × 10
−5. This behavior is thought to be due to the low initial quantum yield of photoconversion φ
con,Ret_580II( t
exc→ 0, I
exc→ 0 ) and the excitation intensity dependent back photoisomerization of Ret_640 to Ret_580
II(see discussion below).
In the middle part of Figure 5, the approximate photoconversion of Ret_580 is displayed
for λ
exc= 530 nm and I
exc= 114.2 mW cm
−2. The initial quantum yield of photoconversion is
φ
con(t
exc= 0) ≈ φ
con,Ret_580I( t
exc= 0 ) κ
Ret_580I≈ 0.0093 giving φ
con,Ret_580I( t
exc) ≈ 0.023. For λ
exc= 530
the photoconversion of Ret_580
Iis lower than that for λ
exc= 590 nm indicating some excitation
Int. J. Mol. Sci.2020,21, 160 12 of 22
wavelength influence on the photoisomerization efficiency. After complete photoconversion of Ret_580
I(t
exc> 0.5 min) the quantum yield of photoconversion is φ
con( t
exc> 0.5 min, I
exc= 114.2 mW cm
−2) ≈ φ
con,Ret_580II( I
exc= 114.2 mW cm
−2) = (2.43 ± 0.143) × 10
−5, due to the excitation intensity dependent back photoisomerization of Ret_640 to Ret_580
II(see discussion below).
In the bottom part of Figure 5, the photoconversion of Ret_580 is displayed for λ
exc= 632.8 nm and I
exc= 15.56 mW cm
−2. The initial quantum yield of photoconversion is φ
con(t
exc= 0) ≈ φ
con,Ret_580I( t
exc= 0 ) κ
Ret_580I= 0.023 giving φ
con,Ret_580I( t
exc= 0 ) ≈ 0.056, as in the top part of Figure 5.
After complete photoconversion of Ret_580
I(t
exc> 1 min), the quantum yield of photoconversion is φ
con( t
exc> 1 min, I
exc= 15.56 mW cm
−2) ≈ φ
con,Ret_580II( I
exc= 15.56 mW cm
−2) = (4.48 ± 0.3) × 10
−4, due to the excitation intensity dependent back photoisomerization of Ret_640 to Ret_580
II(see discussion below).
2.3. Fluorescence Behavior
The excitation wavelength dependent fluorescence emission quantum distributions were measured immediately after excitation light switch-off and after sample recovery in the dark. Obtained fluorescence quantum distributions are shown in Figure S14a,b and fluorescence quantum yields are shown in Figure S15 of Section S2 of the Supplementary Materials for the QuasAr1 sample used in the photocycle experiments of Figure 1a ( λ
exc= 590 nm, I
exc= 64.65 mW cm
−2, and t
exc= 25 min).
Immediately after photoexcitation, the fluorescence quantum efficiency in the fluorescence wavelength region of the photoconversion products turned out to be reduced. After long-time recovery in the dark at room temperature, the fluorescence behavior changed over to the fluorescence behavior of the unexposed samples stored for a long time in the dark at room temperature [33].
The emission wavelength dependent fluorescence excitation quantum distributions of photoexcited QuasAr1 samples were determined after sample recovery in the dark at room temperature. Results are shown in Figure S16 of Section S3 of the Supplementary Materials. The fluorescence excitation spectra behaved similar to the unexposed samples stored for a long time in the dark at room temperature.
3. Discussion
The absorption and emission spectroscopic investigation of the thermal dynamics of the Archaerhodopsin 3 based fluorescent voltage sensor QuasAr1 [33] revealed that fresh thawed samples contained, as covalently bound chromophore, dominantly protonated retinal Schiff base (PRSB) Ret_580 (absorption maximum around 580 nm) with minor amounts of a PRSB isomer absorbing around 450 nm and deprotonated retinal Schiff base (RSB) isomers absorbing below 420 nm. Ret_580 was found to be composed of two isomers, Ret_580
Iof mole fraction κ
Ret_580I≈ 0.41 (likely having the 13-cis conformation in a specific Apoprotein
Istructure) and Ret_580
IIof mole fraction κ
Ret_580II≈ 0.59 (likely having the all-trans conformation in a specific Apoprotein
IIstructure). The photocycle dynamics of Ret_580 were studied experimentally above in Section 2 and in Section S1 of the Supplementary Materials by observing the absorption spectra development during light exposure and after light exposure. The light excitation wavelength and the light excitation intensity were varied.
From the experimental results, we try to resolve the photocycle dynamics of Ret_580
Iand Ret_580
IIand to extract photocycle parameters in the following: The photoexcitation dynamics and the recovery dynamics of Ret_580
Iwere faster than the photoexcitation dynamics and the recovery dynamics of Ret_580
II. These dynamics differences allow the separate characterization of the photocycle dynamics of Ret_580
Iand Ret_580
II.
Generally, the photoexcitation of rhodopsins causes retinal spatial cis-trans isomerization [37,38].
In the rhodopsin photocycle, the photoisomerization of protonated retinal Schiff base (PRSB) is followed
by deprotonation to neutral retinal Schiff base (RSB), and the cycle is closed by reprotonation and back
isomerization [37–42].
3.1. Photocycle Dynamics of Ret_580
IIn Figure 6a, a proposed scheme of the photocycle dynamics of the PRSB component Ret_580
Iis shown, and in Figure 7a the corresponding schematic reaction coordinate diagram is depicted.
Light absorption excites Ret_580
Iin its S
0ground state (likely PRSB
cis) to a local excited state position LE in the S
1first excited state (Ret_580
I*). From there, the S
1state cis-trans isomerization begins along a torsional reaction coordinate via the stationary point SP (Ret_580
I,SP*), and the funnel state Fu (Ret_580
I,Fu*) with S
1–S
0internal conversion (IC) to the S
0transition state TS
0(Ret_580
I,TS0) and further torsion towards the ground-state isomer Ret_540 (likely PRSB
trans). At the TS
0transition state, there occurs forward trans isomerization to Ret_540 with quantum yield of φ
iso,Ret_580Iand cis back isomerization with quantum yield φ
back,Ret_580I= 1 − φ
iso,Ret_580I. Continued light exposure causes Ret_540 photoisomerization with excitation to Ret_540*, S
1state twisting to Ret_540
Fu*, S
1–S
0internal conversion IC to Ret_580
TS0, forward isomerization to Ret_580
I(quantum yield φ
iso,Ret_540) and back isomerization to Ret_540 (quantum yield φ
back,Ret_540= 1 − φ
iso,Ret_540). Ret_540 (PRSB
trans) deprotonates to Ret_410 (RSB
trans) with a relaxation time constant of τ
rel,Ret_540. Ret_410 partly recovers back to Ret_580
Iby reprotonation and trans-cis isomerization (recovery time τ
rec,Ret_410→Ret_580Iand quantum yield of back recovery φ
rec,Ret_410→Ret_580I) and it partly relaxes to permanently stable Ret_400 (RSB
trans) caused by thermal apoprotein
Irestructuring [33]. The quantum yield of Ret_400 formation is φ
therm,Ret_410→Ret_400= 1 − φ
rec,Ret_410→Ret_580I.
The photodynamics of Ret_580
Iis described in Section S4.1 of the Supplementary Materials.
The parameters of the Ret_580
Iphotocycle dynamics derived in the analysis are collected in Table 1.
The speed of Ret_580
Icis-trans photoisomerization to Ret_540 is slowed down by a potential energy barrier along the S
1state torsional path from the local excited state LE to the funnel state Fu of internal conversion. The time constant of Ret_580
Icis-trans photoisomerization to Ret_540, τ
iso,Ret_580I→Ret_540is of the order of the Ret_580 average Strickler–Berg based fluorescence lifetime [43–45] of τ
F,SB,Ret_580≈ 61.5 ps [33] (separate fluorescence lifetimes for Ret_580
Iand Ret_580
IIwere not determined).
The quantum yield of Ret_580
I→ Ret_540 photoisomerization was found to be rather small and dependent on the photoexcitation wavelength (φ
iso,Ret_580I( 590 nm ) ≈ 0.056, φ
iso,Ret_580I( 530 nm )
≈ 0.023). The S
1–S
0internal conversion occurs at a reaction coordinate twist angle of less than 90
◦favoring the back isomerization to the original state (φ
back,Ret_580I( 590 nm ) = 1 − φ
iso,Ret_580I( 590 nm )
≈ 0.944, φ
back,Ret_580I( 530 nm ) = 1 − φ
iso,Ret_580I( 530 nm ) ≈ 0.977).
The metastable Ret_540 lifetime was found to be τ
rel,Ret_540= 39 ± 3 s. Ret_540 deprotonates to Ret_410. During light exposure, the population of Ret_540 accumulates and the light exposure causes photoexcitation and photoisomerization of Ret_540. The data analysis (Section S.4.1 of Supplementary Materials) gives a quantum yield of Ret_540 forward photoisomerization to Ret_580
Iof φ
iso,Ret_540( 590 nm ) ≈ 0.21 and φ
iso,Ret_540( 530 nm ) ≈ 0.125. The S
1–S
0internal conversion occurs at a
reaction coordinate twist angle of slightly larger than 90
◦favoring the back isomerization to the original
Ret_540 state (φ
back,Ret_540( 590 nm ) = 1 − φ
iso,Ret_540( 590 nm ) ≈ 0.79, φ
back,Ret_540( 530 nm ) = 1 −
φ
iso,Ret_540( 530 nm ) ≈ 0.875).
Int. J. Mol. Sci.2020,21, 160 14 of 22
Int. J. Mol. Sci. 2020, 21, x FOR PEER REVIEW 14 of 22
(a)
(b)
Figure 6. Schemes of photocycle dynamics of retinal components Ret_580I
(a) and Ret_580
II(b) of QuasAr1 in pH 8 Tris buffer. IC, internal conversion and ISO, isomerization.
Figure 6. Schemes of photocycle dynamics of retinal components Ret_580
I(a) and Ret_580
II(b) of
QuasAr1 in pH 8 Tris buffer. IC, internal conversion and ISO, isomerization.
(a)
(b)
Figure 7. Schematic reaction coordinate diagrams for Ret_580I