Thermophoresis of biological and biocompatible systems
Inaugural-Dissertation zur
Erlangung des Doktorgrades
der Mathematisch-Naturwissenschaftlichen Fakult¨at der Universit¨at zu K¨oln
vorgelegt von Doreen Niether aus Eberswalde-Finow
K¨oln, 2018
(Gutachter) Prof. Dr. Simone Wiegand Prof. Dr. Guillaume Galliero
Tag der m¨undlichen Pr¨ufung: 17.05.2018
i
Abstract
Thermophoresis, or thermodiffusion, is mass transport driven by a temperature gradient.
This work focuses on thermodiffusion in a biological context, where there are two major applications for the effect: accumulation of a component in microfluidic devices through a combination of thermodiffusion and convection, and monitoring of protein binding reac- tions through the sensitivity of thermodiffusion to complex formation. Both applications are investigated, the first as an accumulation process in the context of origin-of-life theories and the second in light of the question what we can learn from the observed changes in thermodiffusion about modifications of the hydration shell upon complex formation. While thermodiffusion in non-polar liquids can be predicted with reasonable accuracy, the descrip- tion of aqueous systems is complicated as their concentration and temperature dependence is often anomalous. The underlying goal of this work is to gain a better understanding of the interactions between components in an aqueous mixture and how they influence thermo- diffusion.
We find that the temperature dependence of a solute’s thermodiffusion correlates with its
hydrophilicity and argue that the temperature sensitivity of hydrogen bonds, which domi-
nate the interactions in aqueous solutions, might induce a temperature dependence of the
chemical potential. Such a temperature dependence is as of yet not considered in theore-
tical descriptions of thermodiffusion. Numerical calculations show that the thermophoretic
accumulation process, as of yet only considered for the formation of RNA, can accumulate
formamide to high concentrations that would allow the formation of prebiotic molecules. A
heuristic model is developed to illuminate the mechanism behind the accumulation. Cyclo-
dextrins and streptavidin were investigated as model systems for biological complexes. It is
feasible that the exquisite sensitivity of thermodiffusion to interactions with the surrounding
solvent allows inferences about changes in the protein’s hydration shell upon complex forma-
tion. Preliminary measurements on streptavidin-biotin show a decreased hydrophilicity of
the complex, which is in qualitative agreement with increased entropy of the hydration shell
upon complex formation calculated from calorimetric and neutron scattering experiments.
Kurzzusammenfassung
Thermophorese, oder Thermodiffusion, ist Massentransport, der durch einen Temperaturgra- dienten hervorgerufen wird. F¨ur Thermodiffusion in einem biologischen Kontext, auf welcher der Fokus dieser Arbeit liegt, gibt es im Wesentlichen zwei Anwendungen: die Akkumulation einer Komponente in mikrofluidischen Systemen durch eine Kombination aus Thermodiffu- sion und Konvektion und die Detektion von Bindungsreaktionen ¨uber die Ver¨anderung in der Thermodiffusion eines Proteins, wenn ein Ligand bindet. Beide Anwendungen werden hier untersucht, Erstere als Anreicherungsprozess im Kontext von Theorien zur Entstehung des Lebens und Letzere im Bezug auf die Frage, inwieweit die beobachteten ¨ Anderung der Thermodiffusion R¨uckschl¨usse auf Modifikation der Hydrath¨ulle durch die Komplexbildung zulassen. W¨ahrend die Thermodiffusion von unpolaren Fl¨ussigkeiten inzwischen im Wesent- lichen vorhersagbar ist, wird die Beschreibung von w¨assrigen Systemen durch Anomalien der Konzentrations- und Temperaturabh¨angigkeit verkompliziert. Das grundlegende Ziel dieser Arbeit ist deshalb, ein besseres Verst¨andnis der Wechselwirkungen zwischen Komponenten einer w¨assrigen L¨osung und ihres Einflusses auf die Thermodiffusion zu erm¨oglichen.
Es konnte gezeigt werden, dass es eine Korrelation zwischen der Temperaturabh¨angigkeit der
Thermodiffusion eines gel¨osten Stoffes und seiner Hydrophilie gibt. Dies kann in der Tem-
peraturempfindlichkeit von Wasserstoffbr¨uckenbindungen begr¨undet sein, welche die Wech-
selwirkungen in w¨assrigen Systemen dominieren und zu einer Temperaturabh¨angigkeit des
chemischen Potentials f¨uhren k¨onnen. Eine solche Temperaturabh¨angigkeit wird bisher in
theoretischen Beschreibungen der Thermodiffusion vernachl¨assigt. Numerische Rechnungen
zeigen, dass der thermophoretische Anreicherungsprozess, welcher bislang nur unter dem
Gesichtspunkt der Bildung von RNA betrachtet wurde, auch Formamid zu hohen Kon-
zentrationen akkumulieren kann, welche die Bildung von pr¨abiotischen Molek¨ulen zulassen
w¨urden. Es wurde ein heuristisches Modell entwickelt, um den Mechanismus der Akkumula-
tion zu erl¨autern. Cyclodextrine und Streptavidin wurden als Modellsysteme f¨ur biologische
Komplexe untersucht. Die hohe Empfindlichkeit der Thermodiffusion gegen¨uber den Wech-
selwirkungen mit dem umgebenden L¨osungsmittel sollte Aussagen ¨uber Ver¨anderungen in
der Hydrath¨ulle des Proteins durch Ligandenbindung zulassen. Vorl¨aufige Untersuchungen
an Streptavidin-Biotin zeigen eine reduzierte Hydrophilie des Komplexes, was in qualitativer
Ubereinstimmung mit einer Erh¨ohung des entropischen Beitrags der Hydrath¨ulle ist, wie er ¨
aus kalorimetrischen und Neutronenstreu-Experimenten berechnet wurde.
Contents
1 Introduction 1
1.1 Introduction to thermodiffusion . . . . 1
1.1.1 Contributions to the Soret effect . . . . 2
1.1.2 Thermodynamic thermodiffusion models . . . . 4
1.1.3 Simulations . . . . 6
1.1.4 Thermodiffusion in aqueous systems . . . . 7
1.2 Applications . . . . 8
1.2.1 Thermogravitational columns . . . . 9
1.2.2 Microscale thermophoresis . . . 10
1.3 Experimental Details . . . 12
1.3.1 Description of the IR-TDFRS setup . . . 12
1.3.2 Contrast factors . . . 14
1.3.3 Sample preparation . . . 14
1.4 Outline of the thesis . . . 16
2 Accumulation of Formamide in Hydrothermal Pores to Form Prebiotic
Nucleobases 19
3 Heuristic Approach to Understanding the Accumulation Process in
Hydrothermal Pores 27
iii
4 Unravelling the Hydrophobicity of Urea in Water Using Thermodiffusion:
Implications for Protein Denaturation 39
5 Thermophoresis of Cyclic Oligosaccharides in Polar Solvents 49
6 Role of Hydrogen Bonding of Cyclodextrin-Drug Complexes Probed by
Thermodiffusion 59
7 Thermodiffusion as a Probe of Protein Hydration for Streptavidin and the
Streptavidin-Biotin Complex 71
8 Discussion and Conclusion 79
8.1 Discussion . . . 79
8.1.1 Thermophoretic accumulation . . . 80
8.1.2 Influence of hydrophilicity . . . 81
8.1.3 Thermodiffusion of complexes . . . 87
8.2 Conclusion . . . 89
8.2.1 Accumulation in a hydrothermal pore . . . 89
8.2.2 Hydrophilicity and the temperature dependence of S T . . . 90
8.2.3 Change of thermodiffusion behaviour upon complex formation . . . 91
8.3 Outlook . . . 92
Acknowledgement 95 Bibliography 97 Appendix 105 Supporting Information . . . 105
Declaration of Individual Contribution . . . 150
Erkl¨arung zur Dissertation . . . 153
1 Introduction
1.1 Introduction to thermodiffusion
Thermodiffusion is mass transport driven by a temperature gradient. It is also known as thermophoresis or Ludwig-Soret-effect and was first reported by Carl Ludwig in 1856 [1].
Over twenty years later, it was systematically investigated in electrolyte solutions by Charles Soret [2]. Soret developed phenomenological equations describing the thermodiffusion based on Fick’s diffusion equations. In a binary mixture it can be described as a mass flux ⃗ j along a temperature gradient ∇ T with
⃗ j = − ρD ∇ c − ρc ( 1 − c ) D T ∇ T, (1.1)
where D T is the thermal diffusion coefficient, ρ is the mass density and c is the concentration given as mass fraction [3]. Along the concentration gradient ∇ c that arises from the ther- modiffusion, Fickian diffusion takes place characterised by the diffusion coefficient D. With a stable temperature gradient, a steady state is reached where Fickian and thermodiffusion flux cancel each other out and ⃗ j becomes zero. Then the concentration gradient over the temperature gradient is proportional to a constant value
S T ≡ D T
D = − 1 c ( 1 − c )
∆c
∆T , (1.2)
which is defined as the Soret coefficient S T with a unit of K − 1 . The thermophobic component
of the mixture, which enriches at the cold side, has a positive Soret coefficient, while the
thermophilic one enriches on the warm side and has a negative S T .
Figure 1.1: Contributions to the Soret effect.
1.1.1 Contributions to the Soret effect
Thermodiffusion has been observed in mixtures of any kind: in homogenous gases, liquids and solids as well as in heterogeneous mixtures like gas bubbles in liquids, colloids and aerosols [4,5]. Experimental findings show that the thermodiffusion behaviour of a substance is sensitive to a large number of parameters. The main factors are illustrated in Fig. 1.1.
The influence of a particle’s mass, size and moment of inertia are the only parameters that
play a role in an ideal gas. These three factors contribute to the so-called isotope Soret
effect. The name derives from experiments that investigated isotope mixtures in order to
observe species of different mass that are chemically identical [6, 7]. The meaning of the
term has been widened since, as it could be shown that there is a fixed contribution to the
1.1 Introduction to thermodiffusion 3
Soret coefficient that is only dependent on the differences of mass M i and moment of inertia I i between the components i of a non-polar mixture [8, 9]. However, to avoid confusion, the isotope Soret effect will be termed mass-inertia contribution to the Soret coefficient S m T in the following text. Equations to characterise S m T show some variations [4], most common is
S T m = a M M 1 − M 2
M 1 + M 2 + b I I 1 − I 2
I 1 + I 2 , (1.3)
which is derived from descriptions of gaseous mixtures and adjusted for liquids by the factors a M and b I [10].
In non-ideal gases and liquids, the interactions between particles have to be considered, which demands complex theoretical models. Especially in the case of aqueous systems, strong hydrogen bonds cause an anomalous concentration and temperature dependence of molecular interactions that impedes predictions of the thermodiffusion behaviour. These interaction contributions, because they depend on the chemical nature of the components, are called the chemical contribution to the Soret effect S chem T [8]. The observed Soret coefficient is a sum of these two contributions:
S T = S m T + S chem T . (1.4)
Even for mixtures of noble gases a temperature dependence of the thermodiffusion can be observed [11]. The thermal diffusion factor α = S T ⋅ T is then theoretically described by
α = α hard ⋅ R T , (1.5)
where α hard is the theoretical value for hard spheres and R T a correction factor (R T < 1) that contains the temperature dependence by its proportionality to an interaction potential. Using a Lennard-Jones potential, the theoretical description fits the experimental data qualitatively.
It has been pointed out that this temperature dependence might be one of the strongest tests for interaction potentials [12].
Note that Grew et al. [11] found for the noble gas mixtures that α increases with rising
temperature. Prigogine et al., on the other hand, found for alcohols in organic solvents
that S T ∝ 1 / T 2 , implying α ∝ 1 / T [13]. Obviously, the investigated systems in both cases are
vastly different: in the case of the noble gases S chem T is caused by a certain permeability of the
gas atoms, in the organic mixtures the chemical contribution is due to specific interactions caused by polarity of the molecules. This just illustrates that, as already implied by Fig. 1.1 the chemical contribution S chem T can be a sum of different effects specific to the investigated system.
In the following section a short overview of thermodiffusion models is presented.
1.1.2 Thermodynamic thermodiffusion models
In the case of ideal gases the kinetic theory of gases can be applied to predict thermodiffusion of the heavier component towards the cold side [14]. Thermodiffusion in solids can be described by considering the heat of transport for the jump from a neighbouring lattice position into a vacancy caused by crystal defects [15]. For the case of liquids and non-ideal gases, where inter-particle interactions are neither zero, nor as well-defined as in a crystalline solid, the microscopic understanding of thermodiffusion is still lacking. Existing theoretical models are based in kinetic theory, non-equilibrium thermodynamics and combinations of both. They use interaction potentials or heats of transport to account for interactions, but due to inaccuracy of these expressions they are not reliable in predicting thermodiffusion behaviour, especially for polar systems.
As the last paragraph already suggests, there are two principle approaches to describe the thermodiffusion of liquids: (1) one can start from an ideal gas and add terms to include molecular interactions, or (2) one can start from the non-equilibrium framework that des- cribes crystals and try to define some analogy to the jumps between lattice positions that might apply to a liquid in order to arrive at a heat of transport. The interaction strength is estimated by correlation with equilibrium or dynamic characteristics of the mixture.
As thermodiffusion in liquids has kinetic and thermodynamic contributions, the success of
either approach depends on the system under consideration. While the solvent in colloidal
mixtures can be treated as a continuum, such assumptions might lead to large errors in
molecular mixtures, where the size of components is comparable. For very weak molecular
interactions kinetic theory approaches might hold with some corrections, while the activation
energy needed for mass transport becomes a dominating factor when interactions are strong.
1.1 Introduction to thermodiffusion 5
predictions for the thermal diffusion coefficient with
D T = λ D S β , (1.6)
where D S is the self-diffusivity of the solvent, β its thermal expansion coefficient and λ a factor to adjust for non-ideality. Interestingly, D S and β are exclusively dependent on the solvent and λ is taken to be only weakly dependent on the solute, making D T in dilute colloid solutions dependent only on solvent properties. The correlations of D T with D S [17] and with β [18–20] have been confirmed experimentally.
A number of models that are based only on equilibrium properties of the mixture under consideration are based on the works of Haase, who drew an analogy between mass transport due to pressure and due to a temperature gradient [21]. Kempers provided the groundwork in non-equilibrium thermodynamics and proposed a Gedankenexperiment in which two bulbs are held at different temperatures and connected by a valve that allows mass transport.
His expression for the thermal diffusion factor α contains a thermodynamic and a kinetic contribution and yields good agreement with experimental data on gases and some organic solvents [22].
Models following the second approach are based on the works of Denbigh [23] and Rutherford and Drickamer [24]. Strongly influenced by the concept of activation energies in chemical processes, they propose that the heat of transfer must be proportional to an activation energy for molecular motion. There are then different approaches to approximate this value with the activation energy of viscous flow [13,25–27] or with the activation energy of self-diffusion calculated in equilibrium molecular dynamics simulations [28, 29].
Inspired by the additivity found in case of the mass-inertia contribution, Hartmann et al.
[25, 26] found an additivity for the heats of transport of the pure components for binary mixtures of organic solvents. Good agreement with experimental data was achieved by calculating the Soret coeffient with
S T = Q 1 − Q 2
RT 2 [ 1 + ( ∂ ln γ 1 / ∂ lnx 1 ) p,T ] , (1.7)
where R is the gas constant, γ 1 is the activity coefficient and x 1 the concentration of compo-
nent 1. Q 1 and Q 2 are the molar absolute reduced heats of transport of the respective pure
components, values that have been calculated from experimental data relative to an arbi- trary offset (Q tetralin = 0) and give a scale of thermophobicity for the investigated compounds.
While this approach works well for non-polar liquids, predictions of S T for mixtures with a polar component are not as successful.
There is a special difficulty in describing with reasonable accuracy associating mixtures, meaning mixtures that show strong interactions such as the hydrogen bonds formed in alcohol-water mixtures. One proposed model [27] uses the activation energy of viscous flow, but takes into account the anomalous concentration dependence observed in the viscosity of associating mixtures. Microscopically, the effect can be understood by the formation of clusters with varying size and alcohol content, that lead to varying activation energies of molecular motion depending on alcohol/water ratio.
1.1.3 Simulations
One of the problems in designing experiments is that thermodiffusion is sensitive to many parameters of the investigated molecules, some of which cannot be altered in reality with- out altering others as well. Here lies one major advantage of simulations as parameters can be changed systematically and independently. The second advantage is the possibi- lity to get microscopic insight, which can help to characterise and understand molecular interactions. The main simulation methods are equilibrium and non-equilibrium molecular dynamics (EMD and NEMD, respectively) [30, 31].
The additivity of chemical and mass-inertia contribution in molecular mixtures has been corroborated by simulation results and it has been shown that the concentration dependence of S T is due to the chemical contribution [33]. The impact of paramter variation on the mass- inertia contribution has also been studied in detail [34]. Simulations for colloidal systems have been done with NEMD [35] and on a mesoscopic scale [36].
In Ch. 4 of this work NEMD simulations [32] have been used to test the influence of solute- solvent interactions on the temperature dependence of the Soret coefficient and to obtain a microscopic picture of the molecular mixture at different concentrations and temperatures.
Another aim of simulations is the numerical determination of the Soret coefficient, but apart
from very non-polar mixtures [37] only qualitative agreement can be reached when simula-
1.1 Introduction to thermodiffusion 7
high sensitivity of thermodiffusion to even small deviations of the simulated from the real system is a problem. However, the fast development in recent years due to better nume- rical techniques and more accurate molecular force fields makes the simulation approach promising.
1.1.4 Thermodiffusion in aqueous systems
From a phenomenological point of view, the striking difference in the thermodiffusion behavi- our of non-polar and polar mixtures is the strong temperature and concentration dependence of the latter ones. Often, a sign change of the Soret coefficient, i.e. a change from thermo- phobic to thermophilic behaviour, can be observed [40, 41].
Since aqueous systems are of great importance for biotechnological applications, many such systems have been investigated experimentally [41–49]. For a large number of aqueous solu- tions a common temperature dependence of the Soret coefficient S T is observed [41]: at low temperatures, there is a rapid increase of S T that flattens out at high temperatures. Often, the solute is thermophilic (S T < 0) at low temperatures and there is a sign change to a positive S T (thermophobic behaviour) at a certain temperature T ∗ , which is specific to the mixture.
A qualitative explanation of this behaviour has been attempted by Wang et al. [42]: At low temperatures, where the enthalpy contribution dominates, a minimisation of free energy is realised by a largely undisturbed hydrogen-bond network of water, leading to a preference for the solute to be on the warm side. At higher temperatures, the entropy contribution dominates and the high translational and orientational entropy of water leads to enrichment on the warm side.
Iacopini and Piazza [50] have proposed the empirical equation
S T ( T ) = S T ∞
⎡ ⎢
⎢ ⎢
⎢
⎣
1 − exp ⎛
⎝ T ∗ − T
T 0
⎞
⎠
⎤ ⎥
⎥ ⎥
⎥
⎦
, (1.8)
which is able to characterise experimental results that follow the typical behaviour with three
fitting parameters: S ∞ T is the Soret coefficient that is approached at high temperatures, T ∗
the temperature at which the sign change occurs, and T 0 characterises the slope of the
curve and therefore the temperature sensitivity of S T . It was suggested that the last two
parameters are not independent from each other and T ∗ / T 0 = const., at least for chemically similar systems [51].
While this work focuses on uncharged systems it should be noted that thermodiffusion is strongly influenced by charge. In the case of charged colloids in water the Soret coefficient becomes a function of the Debye screening length [52, 53] and can also be expressed in dependence of the surface potential [54]. Ion-specific effects consistent with the Hofmeister series have been observed when electrolytes are added even in low concentrations to nano particles [55]. This demonstrates the sensitivity of thermophoresis to changes in the particle- solvent interactions, but has to be investigated in more detail.
There is no clear microscopic picture based on these observations, but a rise of S T is generally associated with a weakening or breaking of hydrogen bonds [56]. Attempts to correlate the number of hydrogen-bond sites with S T have yielded a linear dependency for solute molecules of a homologous series [57]. These observations will be discussed further in Ch. 5-7.
There are, however, some mixtures that do not follow the typical behaviour described above.
This is mainly the case for polar molecular mixtures at high concentrations, but can also be observed for some compounds, such as ethanol/water [58], at low concentrations. This behaviour has been connected with microstructural heterogeneities and is discussed in detail in Ch. 4 of this work.
1.2 Applications
The earliest applications for thermodiffusion are methods that use its sensitivity to molecular properties such as size, mass, charge and interactions with the solute for separation. In 1939, Clusius and Dickel reported isotope separation of chlorine gas in a thermogravitational column [6]. Later, this technique was used to enrich uranium in the Manhattan project [59].
Due to high energy costs and the technical difficulties in maintaining the almost 15 m high columns, other methods for isotope separation have replaced thermogravitational columns in technical applications.
A method to fractionate and characterize polymers, the Thermal Field Flow Fractionation
(th-FFF), was reported to fractionate polystyrene in 1967 [60] and has been successfully
1.2 Applications 9
In nature, vertical and horizontal temperature gradients in hydrocarbon reservoirs lead to a separation of components and modelling of the spacial composition of these deposits demands that thermodiffusion is considered when planning the extraction [62]. It has also been shown that thermodiffusion has to be considered in combustion processes [63].
Two fields of application that are important for aqueous systems are presented in more detail below.
1.2.1 Thermogravitational columns
Thermogravitational columns were the first application for thermodiffusion, as well as one of the first methods used to measure the effect. Given that the thermophobic component also has the higher density, they enhance the de-mixing effect of thermodiffusion by combining it with a convection flow (see Fig. 1.2). This is realised by applying a temperature gradient horizontally across the column, leading to a convectional stream that flows down on the cold side and up on the warm side of the column. The thermophobic component of the mixture is driven towards the cold side, and carried down by convection, the thermophilic component is carried up on the warm side. Depending on flow speed and geometry of the column, a steady state is reached after some time with a concentration gradient in vertical direction along the column that is proportional to the Soret coefficient.
Thermodiffusion has also been proposed as a mechanism that might have played a role in the origin of life [64]. One central issue in this context is the so-called concentration problem, posing that any organic matter in the primordial ocean would have been present only in very small concentrations, making hydrolysis the dominating reaction pathway and effective polymerisation virtually impossible. This same problem is expressed from another viewpoint when thermodynamics are considered: the formation of structure that is necessary for even the simplest building blocks of life is connected with a reduction of entropy and will therefore only occur spontaneously under non-equilibrium conditions. The solution to this problem is an accumulation process of some kind, driven by a non-equilibrium setting. In a mechanism similar to thermal columns, mineral pores near hydrothermal vents could have trapped and enriched prebiotic molecules, making polymerisation reactions possible [65].
The key difference is that these pores are not closed, like the thermal columns, but are open
Figure 1.2: Schematic of a thermal column. Thermodiffusion of the thermophobic compo- nent towards the cold side (left) is combined with circular convective flow (right), resulting in a concentration gradient vertically along the column.
on the top to a reservoir with a fixed concentration of the thermophobic component, so that this component can diffuse into the pore and be accumulated at the bottom.
Similar geometries are also promising for microfluidic applications. One example is the optimisation of polymerase chain reaction (PCR) in a capillary [66]. A slightly more complex convectional pattern allows the accumulation of replicated DNA fragments in the capillary, while the reaction is continually fed and the necessary temperature cycling provided by the convectional stream that circulates the molecules through hot and cold regions.
1.2.2 Microscale thermophoresis
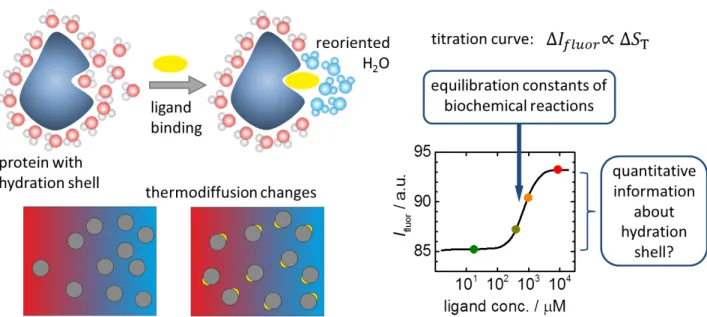
A relatively new application for thermophoresis in the field of life sciences, but already one of
the most important ones, is the so-called Microscale thermophoresis (MST) [44–47]. In this
experiment a laser is pointed into a solution with fluorescently labelled biomolecules, e.g. a
protein. The solution heats up in the lit area, thermodiffusion sets in, and a fluorescence
intensity I fluor is measured that is proportional to S T of the protein. When a ligand is titrated
into the solution, the thermodiffusion behaviour of the protein changes and with it the
1.2 Applications 11
Figure 1.3: Schematic principle of Microscale thermophoresis (MST): ligand binding causes changes in the hydration shell of the fluorescently labelled protein. The resulting change in thermodiffusion can be observed as a titration curve. The concentration dependence of the change is used to calculate the association constant K a , the amplitude, which is usually not examined further, should allow inferences about changes in hydration.
of the binding reaction can be calculated from the dependence on ligand concentration (see Fig. 1.3).
The strong change of S T upon ligand binding is due to its sensitivity towards changes in the
hydration shell, since ligand molecules are usually very small compared to proteins, so that
the mass change can be neglected. What exactly occurs in the hydration shell when a ligand
binds is not known and might be specific to the protein. It should, however, be possible to
extract information about the changes occurring in the hydration shell from the amplitude
of the S T -change. This inspired the investigation of complexes presented in this work.
1.3 Experimental Details
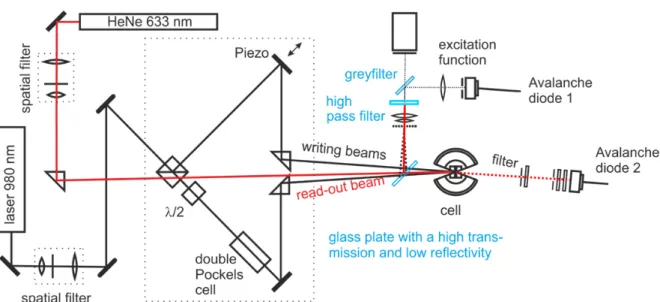
1.3.1 Description of the IR-TDFRS setup
The thermodiffusion data presented in this work was measured by infra-red Thermal Diffu- sion Forced Rayleigh Scattering (IR-TDFRS) [67, 68]. This technique is especially useful to measure thermodiffusion behaviour in binary aqueous solutions [69]. An infra-red laser beam (λ = 980 nm) is split and the two beams are crossed at a small angle inside the sample, so that the interference leads to a periodic intensity grating in the solution. The infra-red light is absorbed by the water [70] and results in a periodic heat grating approximately 100 µ s after the laser is switched on. The mass transport due to thermodiffusion is well separated on the time scale, setting in after well over 1 ms, even for very small solutes. The thermo- diffusion of the solute leads to a concentration grating overlaying the temperature grating.
Both, the temperature and the concentration differences in the grating, result in a refractive index contrast. A read-out beam (λ = 633 nm) that crosses the grating is scattered and the heterodyne intensity of the refracted beam is measured against time. This intensity is proportional to the refractive index contrast of the grating and described by
ξ het ( t ) = 1 − exp ( − t τ th
) − A τ − τ th
{ τ [ 1 − exp ( − t τ
)] − τ th [ 1 − exp ( − t τ th
)]} , (1.9)
where τ th = 1 /( q 2 D th ) and τ = 1 /( q 2 D ) are the heat and mass diffusion times, respectively, with the thermal diffusion coefficient D th , the mass diffusion coefficient D, and the grating vector q.
Equation 1.9 is fitted to the measured intensity curve (see Fig. 1.4) and the Soret coefficient S T can be calculated from the amplitude of the concentration signal A with
S T = A c ( 1 − c )
( ∂ n / ∂ T ) p,c
( ∂ n / ∂ c ) p,T , (1.10)
given that the contrast factors ( ∂ n / ∂ T ) p,c and ( ∂ n / ∂ c ) p,T , that is the change of refractive
index with temperature and concentration, are known.
1.3 Experimental Details 13
Figure 1.4: Normalized intensity signal averaged over several measurements. The Soret coefficient S T can be calculated from the amplitude of the concentration signal A.
Figure 1.5: Sketch of the IR-TDFRS setup. The writing beams (980 nm) are black, the
read-out beam (633 nm) is red.
run continuously, phase shift of the grating by 180 ○ is achieved with the Pockels cell. A small fraction of the writing beam is reflected before the sample into a CCD camera and an avalanche diode to measure the grating period and monitor the excitation function, respecti- vely. The refracted read-out beam passes through an IR-filter and its intensity is detected by the second avalanche diode and recorded over time. An example for the normalized signal is shown in Fig. 1.4.
1.3.2 Contrast factors
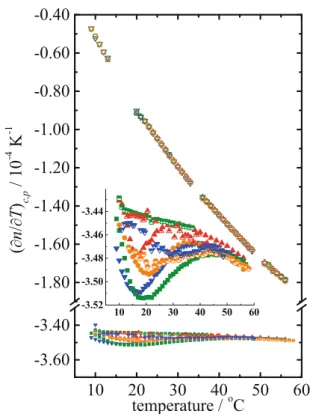
The contrast factors ( ∂ n / ∂ T ) p,c and ( ∂ n / ∂ c ) p,T are necessary to quantify the concentration gradient that sets in through thermodiffusion. They are measured separately for each sam- ple investigated by IR-TDFRS. The refractive index change with temperature at constant pressure and concentration ( ∂ n / ∂ T ) p,c is measured interferometrically [71] in a temperature range of 5K around several temperatures, always including the highest and lowest tempe- rature investigated with TDFRS. The measurement was done twice to make sure that no change occured in the sample. The data was fitted with a 2 nd -order polynomial to average the data sets and interpolate for temperatures not measured directly. The refractive index change with concentration at constant pressure and temperature ( ∂ n / ∂ c ) p,T was measured on dilution series with an Abbe refractometer (Anton Paar ABBEMAT RXA 158) with an accuracy of 0.00002 nD and a temperature control of ∆T = ± 0.03 K. The refractometer uses a wavelength of 589.3 nm (sodium line), shorter than the wavelength of the read-out beam in our IR-TDFRS setup (HeNe-laser, 632.8 nm). This causes a small systematic error in the refractive index increment in the order of 0.5-1% [72, 73]. The refractive index n was plotted against concentration and the slope ( ∂ n / ∂ c ) p,T determined with a linear fit. This was done for 4-5 temperatures, in-between values were interpolated.
1.3.3 Sample preparation
Formamide/water: Solutions were prepared using formamide ( ≥ 99.5%, Sigma-Alrich,
89555 Steinheim, Germany) and water (Millipore). 1-10 mL of the sample were prepared
each time, components were measured by volume (error < 0.5%). All solutions were filtered
1.3 Experimental Details 15
There was no change when the solutions were stored in the fridge, but after long measure- ments (> 3 d) at higher temperatures a small rise of n could sometimes occur. This might be due to evaporation of water or a hydrolysis of the formamide. In both cases, the result is a slight uncertainty concerning the formamide concentration during TDFRS-measurements.
However, repeated measurements of the same samples over time show no systematic change of the measured S T , which leads to the conclusion that the change is too small to impact TDFRS-results.
Urea/water: Urea ( ≥ 99.0%, Fluka, Sigma-Aldrich, 89555 Steinheim, Germany) and water (Millipore) were used. 5-10 g of solution were prepared each time by weighting of the components. Accuracy of the scales was ± 0.2 mg. All solutions were filtered (0.2 µm) to remove dust. Again, a slight rise of the refractive index could be observed for long measurements.
Cyclodextrins: Samples were prepared using α -cyclodextrin ( > 98.0%, Tokyo chemical in- dustry), β -cyclodextrin (99.0%, Tokyo chemical industry), γ -cyclodextrin ( > 98.0%, Tokyo chemical industry), methyl-β -cyclodextrin (with 55% of hydroxyl groups randomly methyla- ted, no specification was given for the purity by Tokyo chemical industry), water (Millipore), and formamide ( ≥ 99.5%, Sigma-Alrich, 89555 Steinheim, Germany). All samples were pre- pared to have a cyclodextrin mass fraction of (1.0 ± 0.01)%. Approximately 2 mL solution were prepared at a time, stirred for an hour at room temperature and filtered (0.2 µ m).
Cyclodextrins-ASA complexes: Additionally to the cyclodextrins described above, heptakis(2,6-di-O-methyl)-β -cyclodextrin (m-β -def, >98.0%, Sigma-Aldrich) and acetylsali- cylic acid (ASA, ≥ 99.0%, Sigma-Aldrich) were used. As before, samples had a cyclodextrin concentration of (1.0 ± 0.01) wt%, ASA was added in equimolar amounts. For some samples m-β -def and unmethylated β -cyclodextrin were mixed to achieve intermediate degrees of methylation. Samples were stirred for an hour at RT and filtered (0.2 µ m). A systematic change of the S T -measurements due to aspirin hydrolysis could not be observed.
Streptavidin-biotin complexes: Streptavidin Streptomyces Avidinii Recombinant pro-
duced in E. coli (Prospec, 7670308 Rehovol, Israel) with the amino acid sequence MAE
AGITGTWYNQLGSTFIVTAGADGALTGTYESAVGNAESRYVLTGRYDSAPATDGSG
TALGWTVAWKNNYRNAHSATTWSGQYVGGAEARINTQWLLTSGTTEANAWKSTL
VGHDTFTKVKPSAAS and a molecular weight of 52 kDa (tetramer) was used. It was
cleaned with PD-10 comlumns, lyophilized and then kept at -20 ○ C. The biotin was pur-
chased as lyophilized powder with ≥ 99% purity (Sigma-Aldrich, 89555 Steinheim, Ger- many). The buffer stock solution has the following composition: 250 mM TrisHCl (Tris[hydroxymethyl]aminomethane, ≥ 99.9%, Sigma-Aldrich, 89555 Steinheim, Germany;
Hydrochlorid acid 37%, Merck, 64271 Darmstadt, Germany), 1.2 M NaCl ( ≥ 99.5%, Merck, 64271 Darmstadt, Germany), 50 mM KCl ( ≥ 99.5%, Merck, 64271 Darmstadt, Germany), 30 mM MgCl 2 ( ≥ 99.0%, Merck, 64271 Darmstadt, Germany).
For IR-TDFRS experiments the buffer stock solution was diluted with Milipore water 1:9 by volume and filtered (0.2 µ m) to remove dust. The concentrations of SA in buffer solution was 50 mg/mL (SA weight fraction 0.048 ± 0.001). For the samples with biotin, the ligand was dissolved beforehand in a larger amount of buffer, so that it could be weighted with reasonable error, then this solution was added to the SA. The samples were vortexed 5- 10 min, then centrifuged at 60 rpm for 20 min. The solution was carefully extracted with a syringe and put into the Quartz cells used for IR-TDFRS. The samples were left standing at RT for ∼ 12 h, because a good contrast for measuring could usually not be found before.
1.4 Outline of the thesis
This thesis focuses on thermophoresis in a biological context, more precisely on the question how changes in the hydration shell of the solute influence the temperature dependence of thermophoresis in aqueous systems. The work consists of two main parts.
The first part investigates the concentration and temperature dependence of thermodiffusion
of formamide and urea in water (chapters 2-4). At high concentrations both systems show
a deviation from the usual temperature dependence of the Soret coefficient S T in aqueous
solutions. Due to the fact that formamide is considered as a likely educt in the formation
of prebiotic molecules on the early earth, the experimental data was used to simulate the
accumulation of formamide in a hydrothermal pore. The results show that accumulations
of up to 85 wt% formamide are possible, a concentration which would allow the formation
of more complex organic molecules. In the following chapter these simulations are revisited
to gain a better understanding of the accumulation mechanism in the pore and how it is
influenced by pore geometry. Finally, the unusual temperature dependence at high concen-
trations is addressed for the urea/water system in chapter 3. Non-equilibrium molecular
1.4 Outline of the thesis 17
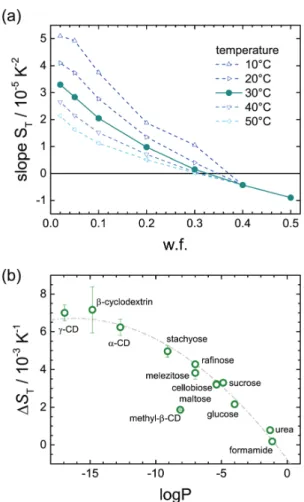
system caused by a rising urea concentration. The results help to rationalise the correlation between the temperature dependence of S T and hydrophilicity of the solute (∆S T vs. logP), an observation that is explained more closely in chapter 6.
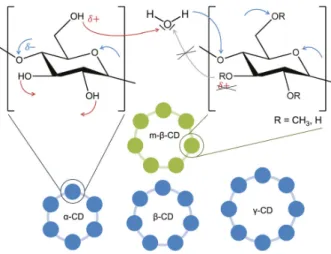
The second part of the thesis (chapters 5-7) is concerned with the question how complex formation leads to changes in thermodiffusion of biomolecules and if inferences can be drawn from these changes about the hydration shell. Chapter 5 introduces cyclodextrins, cyclic oli- gosaccharides that are interesting for drug delivery, because they form complexes with several small drug molecules. First, the thermodiffusion of different cyclodextrins is investigated in two polar solvents, water and formamide. The following chapter focuses on the complex formation with aspirin, showing a strong connection between thermodiffusion behaviour and hydrophilicity. In Ch. 7 preliminary results are shown investigating the streptavidin-biotin complex as a model for protein-ligand complexes. While the thermodiffusion behaviour and especially its temperature dependence are very sensitive to changes in the hydration shell and allow some qualitative statements, complimentary methods and further investigation are necessary to quantify the results.
The discussion gives an overview of the work, highlighting the insights into accumulation in a hydrothermal pore, influence of hydrophilicity of a solute on its thermodiffusion, and changes of thermodiffusion upon complex formation. The observed correlation between hyd- rophilicity and the temperature dependence of thermodiffusion is discussed in more detail.
Additional experimental results on the thermodiffusion of streptavidin-biotin are presented
and discussed.
2 Accumulation of Formamide in
Hydrothermal Pores to Form Prebiotic
Nucleobases
form prebiotic nucleobases
Doreen Niether
a, Dzmitry Afanasenkau
a, Jan K. G. Dhont
a,b, and Simone Wiegand
a,c,1a
Institute of Complex Systems-3 Soft Condensed Matter, Forschungszentrum Juelich GmbH, D-52428 Juelich, Germany;
bDepartment of Physics, Heinrich-Heine-Universitaet Duesseldorf, D-40225 Dusseldorf, Germany; and
cDepartment für Chemie - Physikalische Chemie, Universitaet zu Koeln, 50939 Cologne, Germany
Edited by David A. Weitz, Harvard University, Cambridge, MA, and approved March 1, 2016 (received for review January 7, 2016) Formamide is one of the important compounds from which prebiotic
molecules can be synthesized, provided that its concentration is sufficiently high. For nucleotides and short DNA strands, it has been shown that a high degree of accumulation in hydrothermal pores occurs, so that temperature gradients might play a role in the origin of life [Baaske P, et al. (2007) Proc Natl Acad Sci USA 104(22):
9346 − 9351]. We show that the same combination of thermophoresis and convection in hydrothermal pores leads to accumulation of formamide up to concentrations where nucleobases are formed.
The thermophoretic properties of aqueous formamide solutions are studied by means of Infrared Thermal Diffusion Forced Rayleigh Scattering. These data are used in numerical finite element calcu- lations in hydrothermal pores for various initial concentrations, am- bient temperatures, and pore sizes. The high degree of formamide accumulation is due to an unusual temperature and concentration dependence of the thermophoretic behavior of formamide. The ac- cumulation fold in part of the pores increases strongly with increas- ing aspect ratio of the pores, and saturates to highly concentrated aqueous formamide solutions of ∼85 wt% at large aspect ratios.
Time-dependent studies show that these high concentrations are reached after 45–90 d, starting with an initial formamide weight fraction of 10
−3wt % that is typical for concentrations in shallow lakes on early Earth.
concentration problem | hydrothermal vents | molecular evolution |
origin-of-life problem | thermophoresis
T hermophoresis has been suggested as an active transport mechanism to reach high concentrations of prebiotic molecules to culminate in the formation of RNA (1). A still open question is whether thermophoresis can also be a possible mechanism to form prebiotic nucleobases from simple molecules such as hydrogen cy- anide (HCN) and formamide (FA). Already for almost 50 years, FA has been discussed as an important compound from which prebiotic molecules originate (2 – 7). It has been shown that all known nucleobases can be synthesized from aqueous FA solu- tions (4). In diluted HCN solutions, polymerization of HCN to form nucleobases becomes favored over hydrolysis of HCN at concentrations of 0.03 – 0.3 wt % (8). To our knowledge, there are no similar studies of diluted FA solutions. Taking into account the faster hydrolysis of FA (3), we estimated that a 100-times- higher concentration between 3 wt % and 33 wt % should be sufficient for the synthesis of prebiotic molecules in aqueous solutions. In the ocean during the early stages of Earth, the natural occurring concentrations at a low temperature (10 °C) and a pH between 6 and 8 are estimated to be only on the order of 10
−9wt %, whereas, in shallow lakes (depth 10 m), due to vaporization and FA input from the atmosphere, higher con- centrations of about 10
−3wt % are possible (3). Still, these natural concentrations are far too small compared with those required for the formation of nucleobases.
In this work, we perform numerical calculations for the spatial and time dependence of the concentration of aqueous FA solutions in hydrothermal pores exposed to a temperature gradient to in- vestigate whether it is possible to reach sufficiently high FA
concentrations that are necessary to initiate the synthesis of pre- biotic nucleobases. The dependence of the highest FA concen- tration in part of the pore is analyzed as a function of the initial FA concentration, which is the reservoir concentration within the shallow lake, at various ambient temperatures, initial con- centrations, and aspect ratios of the pores. The highest FA concentration within the pore relative to the initial FA concen- tration defines the so-called accumulation fold. The con- centration dependence and temperature dependence of the thermodiffusion and mass diffusion coefficients of FA in aque- ous solutions as determined by means of Infrared Thermal Diffusion Forced Rayleigh Scattering (IR-TDFRS), as well as other revelant physical properties of FA solutions, are used as an input to these calculations. In contrast to the previous study (1) for nucleotides and short DNA fragments, we do not find an exponential increase of the accumulation fold with increasing pore aspect ratio. Instead, the accumulation fold increases ex- ponentially only at relatively small aspect ratios, sharply in- creases at intermediate aspect ratios, and, finally, saturates to highly concentrated FA solutions on the order of 85 wt % at relatively large aspect ratios. The sharp increase of the accu- mulation fold with increasing pore size is found to be essentially independent of the initial, shallow lake concentration.
Thermophoresis, also known as the Ludwig − Soret effect or thermodiffusion, is the migration of particles or molecules induced by a temperature gradient (9). In a binary fluid mixture, this mass transport is described by a contribution of the form ∼ −D
T∇ ~ T to the mass flux~ j , where D
Tis the thermodiffusion coefficient. When D
T> 0, mass transport occurs from high to low temperature. The total mass flux is thus given by
Significance
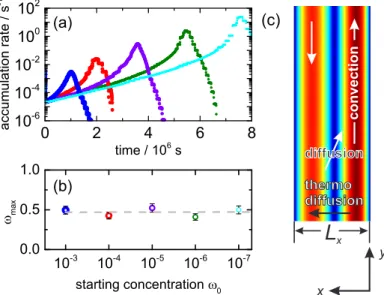
The aim of this article is to show that prebiotic nucleobases can be formed in hydrothermal pores, through a significant accumulation of formamide resulting from a combination of thermophoresis and convection. We performed numerical finite element calcula- tions for initial formamide concentrations that correspond to early Earth shallow lake conditions and reveal that formamide accu- mulates at the bottom of hydrothermal pores in about 45–90 d to high concentrated formamide solutions. The conclusion from these findings is that the combination of thermophoretic mass transport and convection is the missing link, which makes the synthesis of prebiotic nucleobases in porous rocks in contact with shallow lakes under early-earth conditions possible.
Author contributions: D.N. and S.W. designed research; D.N., D.A., J.K.G.D., and S.W. per- formed research; D.N., D.A., and S.W. analyzed data; D.N., J.K.G.D., and S.W. wrote the paper; and D.N., D.A., and S.W. performed simulations.
The authors declare no conflict of interest.
This article is a PNAS Direct Submission.
1To whom correspondence should be addressed. Email: s.wiegand@fz-juelich.de.
This article contains supporting information online atwww.pnas.org/lookup/suppl/doi:10.
1073/pnas.1600275113/-/DCSupplemental.
EARTH,ATMOSPHERIC, ANDPLANETARYSCIENCES
~ j = −D ∇ ~ c − cð 1 − cÞD
T∇ ~ T , [1]
where the first term describes mass transport due to gradients in the concentration c , with D the Fickian or mass diffusion coef- ficient. For a time-independent temperature gradient, a steady state is reached when the mass fluxes due the Fickian diffusion and thermodiffusion contributions cancel each other. The ratio of the resulting concentration gradient and the applied temperature gradient is characterized by the Soret coefficient S
T= D
T=D . A larger Soret coefficient implies a larger concentration gradient for a given temperature gradient.
Several theoretical approaches exist to describe thermodiffu- sion (or thermophoresis) of liquid mixtures, polymer solutions, and colloidal suspensions (10 – 13). The review by Würger (11) introduces theoretical concepts for colloids, and the book chapter by Wiegand (13) gives an overview on the basic physics of the effect. An excellent agreement between experimental results and theoretical models has been found for charged spherical and rod- like colloids (14, 15), whereas the interfacial effects as they occur in microemulsions are still not fully understood (16, 17). So far, no microscopic particle-based theory exists to describe ther- mophoresis on a microscopic level for liquid mixtures, such as aqueous FA solutions. Simulations have been performed to in- vestigate the effects of attractive and repulsive interactions be- tween uncharged and charged colloidal particles (18, 19), to study the influence of chain length and stiffness of polymers (20), or to study specific interactions as they occur in aqueous mixtures (21).
Due to their importance in biotechnology, many aqueous systems have been studied experimentally. Although the charge contri- butions to the thermophoretic movement of the solute molecules are well understood, the contributions of the hydration layer, although of high importance (for example in protein − ligand in- teractions), are not yet understood. It is known that the Soret coefficient S
Tof the solute molecules increases when hydrogen bonds break. There are two mechanisms that can lead to a breaking of hydrogen bonds between solute and water molecules.
One possibility is to add an ingredient with a strong affinity to water, so that the bonds open (22). Alternatively, an increase of the temperature disrupts the hydrogen bonds between water and the solute. This leads, for aqueous solutions of biological and synthetic molecules, to a similar temperature dependence of S
T(23), which can be described by an empirical equation proposed by Iacopini et al. (24).
S
TðTÞ = S
∞T"
1 − exp T
*− T T
0!#
, [2]
with fitting parameters S
∞T, T
*, and T
0. Recently, it has been shown that the number of hydrogen bond sites of solute mole- cules plays a key role for describing the temperature dependence of S
Tand the thermodiffusion coefficient D
T. It turns out that S
Tdepends linearly on the difference of donor and acceptor sites of the solute molecule belonging to a homologous series (25). Hy- drogen bonding certainly plays an important role also in aqueous FA solutions.
Experimental Results
The Soret coefficient of FA/water mixtures was measured by means of IR-TDFRS in the temperature range from 10 °C to 70 °C and in the FA weight fraction range from ω = 0.02 to ω = 0.9. Such measurements require the refractive index of FA solutions as a function of temperature and concentration ( SI Appendix , Refractive Index Contrast Measurements ). Fig. 1 shows the measured Soret coefficients as a function of temperature for various concentra- tions. S
Tis always positive, which indicates that FA is thermophobic and enriches in the cold regions. Specific to the FA/water system
is the sign change of the slope of the temperature dependence from positive to negative on increasing the FA concentration.
At low concentrations ( ω< 0.2), the temperature dependence can be described by Eq. 2 (see the dotted lines in Fig. 1), whereas Eq. 2 is not applicable at higher concentrations, where the Soret coefficient increases with increasing FA concentration.
Qualitatively, the often-found temperature dependence of the Soret coefficient as described by Eq. 2 might be explained as follows. At low overall temperatures, the system tries to minimize its local free energy, F = U − T · S , by forming hydrogen bonds, thus minimizing the internal energy U with a relatively small entropic contribution, so that the water molecules accumulate at the cold side. At higher temperatures, where the entropic con- tribution is dominant, the system minimizes its free energy by maximizing the orientational and translational entropy S , which leads to an enrichment of water molecules on the warm side (26).
At higher FA concentrations, Eq. 2 can no longer be used, and it turns out that the temperature dependence can be described empirically by a simple exponential decay,
S
TðTÞ = S
∞T+ S
0T· exp ð−T=T
0Þ , [3]
which corresponds to the dashed curves at high concentrations in Fig. 1. Deviations from Eq. 2 have also been observed for other systems. The most prominent example is the system eth- anol/water (27), but, also, dimethyl sulfoxide (DMSO)/water (28) does not follow the general trend at low concentrations.
In contrast to FA/water, for high ethanol and DMSO concen- trations, an increase of S
Twith increasing temperature and a decrease for low concentrations is oberved. Also, Maeda et al.
(25) observed a decrease for various types of crown ethers of S
Twith increasing concentration.
As a consequence of the temperature and concentration de- pendence shown in Fig. 1, FA accumulates in colder regions for all concentrations, whereas, with increasing concentration, the driving force for accumulation in these regions increases. One could expect that this leads to a self-amplifying mechanism leading to significant FA accumulation. The FA molecule HCONH
2is a weak base, as it can bind protons to its negatively charged oxygen and the amino group. The pK
a≈ 20 value of FA is very large, so that the fraction of molecules carrying a positive elementary charge is typically as small as 10
−13. There is thus no measurable charge contribution to the thermodiffusive motion of FA. The molecular dynamic simulations in ref. 29 offer the possibility of understanding the temperature and concentration dependence of aqueous FA solutions in more detail. In Fig. 2, we replot the average number of water − water (W − W), FA − water (FA − W),
Fig. 1. The Soret coefficient as a function of temperature for various FA concentrations (ω is the weight fraction of FA). The dotted lines for the three low concentrations are fits according to Eq. 2, and the dashed lines are fits to Eq. 3.
2 of 6 | www.pnas.org/cgi/doi/10.1073/pnas.1600275113 Niether et al.
21
water molecules decreases with increasing FA concentration.
Accordingly, the number of FA − FA bonds increases. Note that, for pure water, the number of W − W bonds is slightly larger than the number of FA − FA bonds for pure FA, but both solvents show a strong tendency to form hydrogen bonds. With increasing FA concentration, the number of FA − W hydrogen bonds de- creases. Around a weight fraction of 0.13, the number of FA − W bonds is equal to the total number of H bonds that FA forms.
This is precisely the concentration range where the slope of the temperature dependence of S
Tin Fig. 1 changes from positive to negative. This indicates that the temperature dependence as given in Eq. 2 is valid as long as FA molecules are mostly surrounded by water molecules. As soon as FA − FA hydrogen bonds between FA molecules are formed, the temperature dependence of S
Tchanges from increasing to decreasing with increasing temperature. A possible explanation is that FA at higher concentrations migrates in temperature gradients as entire FA clusters. With increasing con- centration, larger and heavier clusters are formed, which have a larger Soret coefficient, whereas, for increasing temperature, the clusters become smaller due to thermal motion, which leads to a decrease of the Soret coefficient.
As mentioned above, the systems ethanol/water and DMSO/
water also do not follow Eq. 2 . Compared with FA, both ethanol and DMSO have a much lower hydrogen bond capability, which is only roughly two bonds per molecules, whereas the water hydrogen bond capability lies between 3.5 and 4 per water molecule (30, 31).
Both aqueous mixtures show microheterogeneous structures at low concentration (31, 32), which are not formed in the case of FA/
water due to their almost equal ability to form hydrogen bonds. As in the case of the crown ethers, the solute molecules are not well interlinked with water molecules. According to computer simula- tions (33) and near-infrared spectroscopy (34), the water molecules form a clathrate-like structure around the crown ether. Only two water molecules are doubly hydrogen-bonded (bridging) to the crown ether oxygen atoms. In contrast, proteins are often linked to water by 50 – 100 hydrogen bonds (35), so that the hydrogen bonds of the solute molecules at low concentrations are not influenced by other solute molecules. In conclusion, we can state that Eq. 2 only holds if the solute molecules are well connected to water by hydrogen bonds and no microheterogeneous structures or cages are formed.
Fig. 3 shows the Soret coefficient of FA as a function of the FA weight fraction ω . The concentration dependence can be described by an empirical equation, which has the form of the so-called Hill equation (36, 37),
S
TðωÞ = ω
aK + ω
a+ S
0T, [4]
where a , K , and S
0Tare fitting parameters (the dashed lines in Fig.
3). In contrast to many other systems, S
Tfor FA increases with concentration. The change in the slope of curves at different temperatures leads to a common intersection at a weight fraction of 0.13. Such an intersection point is often found for associated mixtures (28).
Accumulation in Hydrothermal Pores
The stronger accumulation of FA for larger concentrations and lower temperatures raises the question whether it is possible to accumulate sufficient FA by thermophoresis and convection in hydrothermal pores, such that chemical reactions can be initiated to form nucleobases as prebiotic molecules from FA. Using com- mercial finite element software (COMSOL Multiphysics Modeling Software), we solved the coupled Navier − Stokes, diffusion, and heat transfer equations in two dimensions, and determined the accumulation of FA in similar hydrothermal pores as in ref. 1. The diffusion equation includes both convection and thermophoresis.
Numerical calculations use as an input the experimentally de- termined concentration and temperature dependence of the thermal diffusion and mass diffusion coefficients as obtained from the IR-TDFRS measurements, as well as the viscosity, the specific mass density, the heat conductivity, and the heat capacity of FA/water mixtures ( SI Appendix , Temperature and Concentra- tion Dependence ). Details on the mesh sizes that were used in the calculations can be found in SI Appendix , Numerical Calculations .
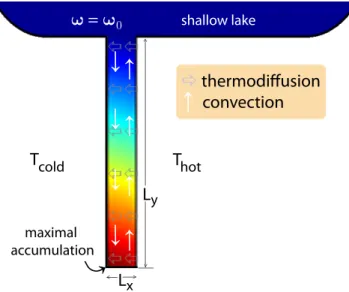
Fig. 4 shows a contour plot of the concentration profile in a pore with aspect ratio 10 in the stationary state. At the top of the pore, the FA concentration is constant, reminiscent of the con- centration in a shallow lake. This is also the initial concentration within the pore, before the temperature gradient is switched on.
The right side of the pore is warmer compared with the left side, with a temperature difference of 30 K for all calculations. The maximum concentration in the stationary state within the dark red-colored region at the bottom corner of the pore defines the accumulation fold that is of interest here. This is the region where possible formation of nucleobases from FA will take place.
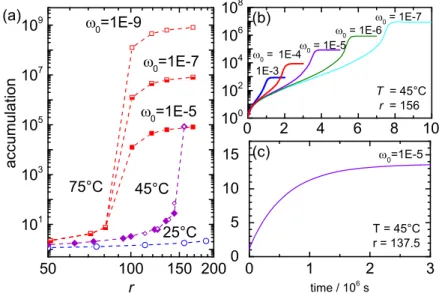
Fig. 5 A shows the accumulation fold as a function of the height to width aspect ratio r . For comparison with literature results, we first performed calculations for an aqueous nucleotide solution
Fig. 2. Average number of H bonds in an FA−W mixture as a function of FA weight fraction ω taken from ref. 29. The lines connect the points. The black symbols mark the average number of H bonds between W−W (black squares) and FA−FA (black circles). The total number of FA hydrogen bonds (white circles) is the sum of FA−FA and FA−W bonds. It becomes equal to the average number of H bonds between FA and W (gray circles) in dilute so- lution around ω =0.13.
Fig. 3. Soret coefficient as a function of the FA weight fraction, ω, for various temperatures. The solid lines correspond to a fit according to Eq. 4.
EARTH,ATMOSPHERIC, ANDPLANETARYSCIENCES
(see Fig. 5, the green solid dots), with an initial concentration of ω
0= 10
−5. In this calculation for the nucleotide, literature values for S
T= 0.015 K
−1, as well as for D = 400 μ m
2= s were used, whereas the physicochemical properties of pure water were used for the solvent properties, as done in ref. 1. For low aspect ratios, we find good agreement with the exponential function (see Fig. 5, solid line), as proposed in ref. 1. to describe the aspect ratio de- pendence of the accumulation fold. At high accumulation folds, however, we find the expected deviations from an exponential accumulation as the nucleotide concentration approached 100%
saturation. The concentration and temperature dependence of the Soret coefficient and the mass diffusion coefficient of nucleotide solutions for somewhat elevated concentrations is not known.
Additionally the solubility of nucleotides is limited, therefore the last data point in Fig. 5 A , corresponding to a concentration of
35 wt %, is marked as an open circle to indicate the uncertainty of this data point.
In contrast to nucleotides, FA and water are miscible at any fraction, so that the entire concentration range is accessible. We studied three different mean temperatures, T
mean= 25 °C, 45 °C, and 75 °C, for the optimal pore widths of 180 μ m, 160 μ m, and 100 μ m, respectively, to achieve an efficient accumulation ( SI Appendix , Numerical Calculations ). The initial concentration was varied between ω
0= 10
−9and ω
0= 10
−5, corresponding to FA concentrations as predicted for oceans and shallow lakes under early Earth conditions (3). After an initial exponential increase of the accumulation fold with the pore aspect ratio, we observe, for all studies, a steep increase followed by a plateau when the ac- cumulation fold reaches 1 =ω
0of a pure FA solution, as can be seen from Fig. 5 A . This saturation plateau is approached at lower aspect ratios for larger temperatures, thus favoring an accumula- tion in wider pores at lower ambient temperatures.
Fig. 5 B shows the time dependence of the accumulation fold for three initial concentrations ω
0, for the same temperature of T
mean= 45 °C and the same pore aspect ratio of 156. For an initial concentration ω
0= 10
−5, the saturation plateau is reached 45 d after switching on the temperature gradient. Reducing the initial concentration to ω
0= 10
−7prolongs the saturation time to 90 d. These are reasonable time ranges to establish regions of sufficiently high FA concentration to synthesize nucleobases.
Discussion
FA is a naturally occurring substance on the early Earth (2 – 8), with relatively high concentrations on the order of 10
−3wt % in shallow lakes due to the stronger evaporization of water compared with FA, which has a much higher boiling point of T
boil= 210 °C (3). Numerical finite element calculations for initial FA concen- trations that correspond to early Earth shallow lake conditions reveal that FA accumulates at the bottom of hydrothermal pores with aspect ratios between about 100 and 200 and a width in the range of 100 – 200 μ m in about 45 d to high concentrated FA so- lutions ( ω ≈ 85 wt %). The conclusion from these findings is that the combination of thermophoretic mass transport and convection
Fig. 4. Contour plot of the concentration profile in a pore with aspect ratio 10 connected to a reservoir in the stationary state. The vertical and hori- zontal arrows mark the convective and thermodiffusive flow, respectively.
A B
Fig. 5. (A) Accumulation fold of FA as a function of the aspect ratio r for various initial weight fractions, ω
0, and temperatures as indicated in comparison with the accumulation fold for a single nucleotide. The solid line has been calculated using equation 1 in ref. 1, and the dots refer to COMSOL simulations using the physical chemistry properties of water. The accumulation fold of FA at 25 °C, 45 °C, and 75 °C has been determined at a optimal width of 180 μm, 160 μm, and 100 μm, respectively (SI Appendix, Numerical Calculations). All curves show an initial exponential increase, which levels of if the accumulation becomes so strong that it is close to the pure component. (B) Time-dependent study of the accumulation as a function of time for various initial concen- trations, ω
0, at a width of 160 μm and a height of 25 mm. (Inset) Time to reach the concentration plateau, τ
plateau, as a function of the dependence of the accumulation for different initial concentrations ω
0.
4 of 6 | www.pnas.org/cgi/doi/10.1073/pnas.1600275113 Niether et al.