Inaugural-Dissertation zur
Erlangung des Doktorgrades
der Mathematisch-Naturwissenschaftlichen Fakultät der Universität zu Köln
vorgelegt von
Eva Berg
aus Freiburg i. Br.
Köln 2014
Prof. Dr. Peter Kloppenburg
Tag der mündlichen Prüfung:
9. Juli 2014
Animals move through a complex environment and therefore constantly need to adapt their behavior to the surroundings. For this purpose, they use sensory information of various kind. As one strategy to gain tactile cues, animals perform leg searching movements when loosing foothold. The kinematics of these searching movements have been well investigated in the stick insect. In this thesis, the modification of stick insect searching movements following a tactile cue are explored as an example of a sensory- motor system that adapts to environmental conditions. Furthermore, the premotor neuronal network underlying the generation of searching behavior is investigated.
Searching movements were studied in animals with a single intact leg that was free to move in the vertical plane. After several cycles of searching movements, a stick was introduced into the plane of movements such that animals would touch it with its distal leg. As is known from previous studies, in such a situation stick insects try to grasp the object that they touch. In my experiments, the stick was retracted as soon as a brief contact with the animals’ leg had occurred. Therefore, animals could not grasp the stick.
I could show that following this short tactile cue, stick insects modify their search- ing movements to target the former position of the object (PO). Targeting occurs by a change in two parameters of searching movements: animals (i) shift the average leg position of their searching movements towards the PO and (ii) confine searching movements to the PO by a reduction in movement amplitude. These two parameters, position and amplitude, can be changed independently of each other. Searching move- ments are flexibly adjusted to different locations of the object which demonstrates the targeted response to be a situation-dependent adaptive behavior. The targeted response outlasts the tactile stimulus by several seconds suggesting a simple form of short term memory of the PO as proposed for targeted movements of other insects.
Vision is not necessary for a targeted response. Instead, tactile cues from leg sensory organs are important. Two proprioceptive organs, the trochanteral hairplate (trHP) and the femoral chordotonal organ (fCO), are crucial for targeting. Other sensory organs like tactile hairs and campaniform sensilla are dispensable. The brain is not necessary for a targeted response, therefore the adaptation of searching movements is likely to be mediated on the thoracic level.
The premotor neuronal network underlying searching movement generation was inves- tigated using the same single-leg preparation as described above. Nonspiking interneu- rons (NSIs) of the premotor network were recorded intracellularly during searching movements. Additionally, EMG recordings of the four main leg muscles that generate searching movements in the vertical plane were recorded.
searching movements. Each NSI acts on a specific set of parameters.
The same NSIs that were recorded during searching also were recorded during walking behavior. In comparison, NSI membrane potential modulations during searching are smaller in amplitude and more undulated than during walking. In contrast, fast tran- sitions in NSI membrane potential are closely coupled to step phase transitions during walking. The most prominent difference in NSI membrane potential occurs during step phase (when walking) as compared to flexion phase (during searching). This difference might be attributed to load signals from campaniform sensilla. Analogous to results of previous studies in the stick insect, this highlights the importance of sensory feedback in shaping the motor output.
Finally, NSIs were recorded intracellularly while animals with their searching leg made contact with the stick that was introduced into the plane of movement. First results indicate that the response of a given NSI to this contact is characteristic and depends on the direction of touch.
Tiere bewegen sich in einer komplexen Umwelt und müssen daher fortwährend ihr Verhalten an die Gegebenheiten anpassen. Zu diesem Zweck greifen sie auf sensorische Informationen vielfältiger Art zurück. Um taktile Informationen zu erhalten, führen viele Tiere Suchbewegungen mit ihren Beinen aus, wenn sie Bodenkontakt verlieren.
Diese Suchbewegungen sind für die Stabheuschrecke auf Verhaltensebene bereits gut beschrieben. In der hier vorliegenden Arbeit untersuche ich, wie Stabheuschrecken ihre Suchbewegungen auf einen taktilen Stimulus hin ändern. Dabei betrachte ich Suchbewegungen und ihre Veränderungen beispielhaft für ein sensomotorisches System, das an einen Stimulus aus seiner Umwelt adaptiert. Des Weiteren untersuche ich das prämotorische neuronale Netzwerk, das zur Erzeugung der Suchbewegung beiträgt.
Um Suchbewegungen zu untersuchen, wurden Tiere mit nur einem intakten verbleiben- den Bein verwendet. Die Tiere konnten das Bein in der vertikalen Ebene frei bewegen.
Nach einigen ungestörten Suchzyklen wurde ein Stab in die Bewegungsebene geführt, den die Tiere im folgenden Suchzyklus mit der distalen Tibia berührten. Wie aus Ergebnissen vorheriger Untersuchungen bekannt ist, versuchen Tiere in einer solchen Situation, den Stab zu greifen. In den hier vorgestellten Experimenten wurde der Stab aus der Bewegungsebene entfernt, sobald die Tiere ihn mit dem Bein berührt hatten.
Die Stabheuschrecken konnten den Stab daher nicht greifen.
Ich konnte zeigen, dass Stabheuschrecken ihre Suchbewegungen in Folge dieser kurzen Berührung verändern und an die Stelle zielen, an der sie den Stab berührten. Diese Anpassung erfolgt durch Veränderung zweier Parameter der Suchbewegung: zum Einen (i) verschieben die Tiere die mittlere Position ihrer Suchbewegungen zu der Position der vorangegangenen Stabberührung (PO) hin, zum Anderen (ii) verringern sie die Ampli- tude ihrer Suchbewegungen und beschränken somit ihre Bewegungen auf den Bereich der Stabberührung. Die beiden Parameter, Bewegungsposition und Bewegungsampli- tude, können unabhängig voneinander verändert werden. Die Suchbewegungen werden an verschiedene Positionen der Stabberührung angepasst, was zeigt, dass die gezielte Antwort eine flexible, situationsabhängige Reaktion ist. Die gezielte Antwort über- dauert den kurzen Stimulus um mehrere Sekunden und deutet somit die Existenz einer Art Kurzzeitgedächtnis für die Position der Stabberührung an. Eine solche Art von Gedächtnis wurde bereits für gezielte Beinbewegungen anderer Insekten vorgeschlagen.
Visuelle Informationen sind für die beschriebene gezielte Reaktion nicht nötig. Statt- dessen spielen taktile Reize eine wichtige Rolle. Zwei propriozeptive sensorische Or- gane, das trochanterale Haarfeld (trHP) und das femorale Chordotonalorgan (fCO), sind für eine gezielte Reaktion von entscheidender Bedeutung. Andere sensorische Organe, wie taktile Haare oder campaniforme Sensillen, sind entbehrlich. Das supra-
Das Membranpotential bereits bekannter sowie neu identifizierter NSIs, die Motoneu- rone erregen, wird phasisch moduliert während das Tier Suchbewegungen ausführt.
Somit sind diese NSIs Teil des prämotorischen Netzwerkes zur Erzeugung von Such- bewegungen. NSIs, die, wie in vorherigen Studien beschrieben, an der Generierung von Laufbewegungen beteiligt sind, wurden hier als an der Generierung von Suchbe- wegungen beteiligt beschrieben. Durch Strominjektion herbeigeführte Manipulationen im Membranpotential einzelner NSIs können zu Veränderungen der Suchbewegungen führen. Veränderte Parameter umfassen die Position, Amplitude und Geschwindigkeit der Bewegung, sowie die Koordination der verschiedenen Beingelenke. Ein einziger, bestimmter NSI zeigt einen generellen Einfluss auf Suchbewegungen, indem er deren Generierung fördert oder unterdrückt. Es konnte gezeigt werden, dass einzelne NSIs spezifische Parameter beeinflussen.
Das Membranpotential der NSIs wurde sowohl während Suchbewegungen, als auch während Laufbewegungen aufgezeichnet. Im Vergleich zeigt sich, dass das Membran- potential während Suchbewegungen wesentlich schwächer und wellenförmig moduliert wird als während Laufbewegungen. Während des Laufens treten schnelle, starke Än- derungen im Membranpotential auf, die eng an die Übergänge der verschiedenen Lauf- phasen gebunden sind. Der stärkste Unterschied im Membranpotential der NSIs tritt im Vergleich von Stemmphase (während des Laufens) und Flexionsphase (während des Suchens) auf. Dieser Unterschied könnte durch Belastungsinformationen der campani- formen Sensillen verursacht sein. Dies hebt, wie bereits die Ergebnisse früherer Studien, den wichtigen Beitrag sensorischer Information zur Erzeugung motorischer Aktivität hervor.
Im letzten Teil der Arbeit wurde das NSI Membranpotential aufgezeichnet, während die Tiere mit ihrem suchenden Bein den Stab berühren, der in die Bewegungsebene geschoben wurde. Erste Ergebnisse deuten an, dass während des Kontakts das Mem- branpotential einzelner NSIs charakteristisch moduliert wird und diese Modulation von der Richtung der Berührung abhängt.
Abstract / Zusammenfassung i
Abbreviations vii
1 Introduction 1
2 Materials and Methods 9
2.1 Kinematic and electromyographic analysis of targeted searching move- ments . . . 9 2.2 Electrophysiological analysis of the premotor network for leg searching
movements . . . 13
3 Results 18
3.1 Kinematic analysis of targeted searching movements . . . 18 3.1.1 Qualitative analysis of searching movements . . . 19 3.1.2 Quantitative analysis of searching movements . . . 21 3.1.3 Contribution of CTr and FTi joints to targeted searching move-
ments . . . 24 3.1.4 Trochanteral muscle activity underlying targeted searching move-
ments . . . 25 3.1.5 Persistency of changed searching movements . . . 26 3.1.6 Necessity of the brain for targeted searching movements . . . 28 3.1.7 Role of leg sensory signals in targeted searching movements . . . 30 3.1.8 Targeted searching movements of the middle leg . . . 35 3.2 Activity of premotor nonspiking interneurons during searching move-
ments . . . 39 3.2.1 Nonspiking interneurons influencing the coxa-trochanter joint . . 40 3.2.2 Nonspiking interneurons influencing the femur-tibia joint . . . . 50 3.2.3 Nonspiking interneurons influencing multiple leg joints . . . 65
4.1 Kinematic analysis of targeted searching movements . . . 101 4.1.1 Undisturbed searching movements . . . 101 4.1.2 Targeted movements . . . 102 4.1.3 Comparison with other systems and considerations of possible
underlying cellular mechanisms . . . 105 4.2 Activity of premotor nonspiking interneurons during searching and walking106
4.2.1 Modulation of searching behavior by manipulations in nonspiking interneurons . . . 109 4.2.2 Comparison of NSI physiology during searching and walking . . 116 4.2.3 NSI physiology during and after object contact . . . 119
Bibliography 122
Appendix 134
List of Figures 137
List of Tables 138
angleα overall joint angle
angleβ coxa-trochanter-joint angle angleγ femur-tibia-joint angle CPG central-pattern-generator
CS campaniform sensilla
CTr coxa-trochanter-joint
EMG electromyogram
fCO femoral chordotonal organ
FTi femur-tibia-joint
MN motoneuron
NSI nonspiking interneuron
PO position of object
RMP resting membrane potential SEG subesophageal ganglion
sRMP resting membrane potential for searching behavior;
leg resting midair
ThC thorax-coxa-joint
trHP trochanteral hair plate TTa tibia-tarsus-joint
wRMP resting membrane potential for walking behavior;
leg resting on treadwheel
substrate, air or water flow. To name just a few examples, lampreys show escape swimming when tactile stimulation mimics a predator (Islam and Zelenin, 2008), hawk moths adapt their flight path in order to track odor plumes (Rutkowski et al., 2009), cockroaches walk over or tunnel under a shelf depending on tactile information and surrounding light conditions (Harley et al., 2009), and walking stick insects use differ- ent gaits depending on the ascending slope of the ground (Grabowska et al., 2012).
For the purpose of adaptation, sensory information of various modality is used which can provide information in the long distance range (visual, auditory, olfactory cues) or short distance. As such, in vertebrates and invertebrates tactile cues play a prominent role in the exploration of the environment (Prescott et al., 2011). For example, humans use their hands for haptic exploration (Cote, 2014), harbor seals (Grant et al., 2014) and rodents (Diamond et al., 2008) use whiskers to palpate objects. Many insects con- stantly use antennal exploration to gain information about their environment during locomotion (cockroach: Camhi and Johnson, 1999; Harley et al., 2009; Baba et al., 2010; cricket: Honegger et al., 1990; Horseman et al., 1997; stick insect: Dürr, 2001;
Schütz and Dürr, 2011). As another form of tactile exploration, insects also perform leg searching movements when losing ground contact, e.g. when approaching a gap.
Such leg searching movements have been reported for stick insects (Bläsing and Cruse, 2004a,b; Dürr, 2001), locusts (Pearson and Franklin, 1984), cockroaches (Delcomyn, 1987) and fruit flies (Pick and Strauss, 2005).
1Parts of the introduction are already published in “E. Berg, A. Büschges, and J. Schmidt (2013) Single pertubations cause sustained changes in searching behavior in stick insects” J. Exp. Biol.
216, 1064-1074. The authors contributions are: EB, AB, and JS designed research; EB performed experiments, analyzed data and prepared figures; EB, AB, and JS wrote manuscript. Parts of the introduction are taken from the publication literally or with minor modifications. Additional sections were added where necessary.
In the present thesis, I investigated leg searching movements of the stick insect Cu- niculina impigra, first, on a kinematic level in order to test whether searching move- ments are adapted in response to tactile stimulation. Second, I electrophysiologically investigated the premotor neuronal network underlying the generation of searching movements. This will be introduced in the following in more detail.
Leg searching movements In the stick insect, the behavioral context and kinematics of leg searching movements have already been described by Karg et al. (1991) and Dürr (2001). Searching movements were shown to be rhythmic stereotyped movements which consist of several cycles (Karg et al., 1991; Dürr, 2001). Movements in all three main leg joints contribute to searching (Dürr, 2001). These are the thorax-coxa (ThC) joint for pro- and retraction of the leg, the coxa-trochanter (CTr) joint for levation and depression of the femur, and the femur-tibia (FTi) joint for extension and flexion movements of the tibia. During searching, movements in the CTr and FTi joint rhythmically move the tarsus from a dorsolateral position to a ventromedial position (Dürr, 2001). Imposed on this movement is a retraction of the leg with low amplitude oscillations (Dürr, 2001).
The coordination of leg joints during searching has been described in detail for the CTr and FTi joint in a single-leg-preparation that was restricted to move in the vertical plane (Karg et al., 1991). A downward movement is initiated by a depression of the femur which is followed by a flexion movement of the tibia. During the subsequent upward movement, levation and extension occur simultaneously. Correspondingly, the antagonistic pools of motoneurons (MNs) supplying the CTr and FTi joint are each alternatingly active (Fischer et al., 2001; Schmidt et al., 2001). The protractor and retractor coxae muscles moving the ThC joint (Dürr, 2001) and correspondingly their innervating MNs (Fischer et al., 2001) are alternatingly active with a much slower frequency. Therefore, each of the two MN pools is active for several cycles of searching movements (Fischer et al., 2001).
Adaptation of searching movements – analysis on the kinematic level
As one form of behavioral adaptation limb movements of animals can be targeted. Ex- amples shown in vertebrates include reaching movements of monkeys (Georgopoulos, 1996) and targeted scratching movements of dogs (Sherrington, 1906), cats (Sherring- ton, 1910), and turtles (Mortin et al., 1985).
Targeted movements of body appendages (limbs and antennae) are also found in inver- tebrates like insects. These movements may be directed towards non-transient stimuli, like cricket antennal movements that follow a visual cue (Honegger, 1981), but also
On a shorter time scale, locusts perform targeted hind leg scratching movements that outlast the tactile stimulus on their wing (Matheson, 1997, 1998). Furthermore, locusts walking on a ladder target their front legs to rungs under visual control (Niven et al., 2010). When a rung has been relocated during a front leg’s swing phase, searching movements are performed at the original location of a rung. Because of this observation and the absence of immediate modification of the step, a memory for the rung position has been suggested (Niven et al., 2010).
Inspired by these experiments, I became interested in the mechanisms employed by a sensory-motor system to adapt to such an unexpected event. A stick insect searching for foothold in a bush may touch a leave or a twig that moves out of reach after the first contact, e.g. because of the elasticity of the material. I hypothesized that a change in searching strategy, i.e. searching movements confined to the former location of the object to regain contact, may result after such an event. Such a change in searching strategy would provide the opportunity to identify mechanisms underlying adaptation of movements in a largely intact sensory-motor system. As one aspect, such a change could employ a short-term memory in the range of seconds, as inferred from rung- searching locusts. Therefore, I aimed to study how searching movements of a stick insect’s leg are changed in response to a transient contact of the leg with an object.
Generation of searching movements – analysis on the neuronal network level As mentioned above, the kinematics of stick insect searching movements have been de- scribed (Karg et al., 1991; Dürr, 2001) and the motoneuronal activity during searching movements was investigated (Fischer et al., 2001; Schmidt et al., 2001). The contribu- tion of the premotor network to searching movement generation has not been a subject of research yet. At the premotor level, searching movements are likely generated by an interplay between central rhythm generating networks (central-pattern-generators;
CPGs) which produce a basic motor pattern and modulating influences that shape the pattern. Such an interplay has been shown to underly many rhythmic behaviors in both vertebrates and invertebrates e.g. swimming (lamprey: Grillner, 2003; tadpole:
Roberts et al., 1998; mollusc: Getting et al., 1980), flight (locust: Robertson and Pear- son, 1985; Ausborn et al., 2007), walking (cat: Grillner and Zangger, 1979; rodent:
Kiehn, 2006), crawling (leech: Eisenhart et al., 2000), scratching (turtle: Robertson et al., 1985), respiration (Smith et al., 1991; Feldman et al., 2013), heartbeat (leech:
Kristan et al., 2005), and stomach movements (crustacean: Marder and Bucher, 2007).
Generating a central rhythm CPG networks are able to produce rhythmic activity in the absence of movement related sensory feedback that might pattern activity (e.g.
Marder and Calabrese, 1996). Different mechanisms can underly rhythm generation (e.g. Marder and Bucher, 2001). In some networks, endogenously bursting pacemaker neurons produce rhythmicity (e.g. pyloric rhythm in the crustacean stomatogastric ganglion: Miller and Selverston, 1982; vertebrate respiration: Smith et al., 1991). In other networks rhythmic activity emerges from the interplay of synaptic interconnec- tivity and intrinsic properties of the constituent neurons (e.g. lamprey: Grillner, 2003, leech heartbeat: Calabrese et al., 1989).
The CPG networks are located close to the muscles they control (Büschges et al., 2011), e.g. CPGs generating limb movements are located in the spinal and ventral nerve chord, respectively (e.g. turtle: Robertson et al., 1985; locust: Berkowitz and Laurent, 1996a). CPG activity can be elicited by application of neuroactive substances like pilocarpine or N-methyl-D-aspartate (NMDA) on the isolated nervous system. This
“fictive behavior” in some animals largely resembles the motor pattern observed during a specific behavior in the intact animal (lamprey: Grillner, 2003; crayfish: Mulloney and Smarandache-Wellmann, 2012). In other animals, e.g. the stick insect, only certain aspects of the behavior are reflected (Büschges, 2005).
In several studies, a modular organization of motor networks has been suggested (re- view: Tresch et al., 2002; Grillner, 1981). According to this conception, a network responsible for the generation of a behavior can be subdivided into several smaller net- works which are responsible for the generation of a part of the behavior. For example, results from the walking mudpuppy (Cheng et al., 1998) or scratching turtle (Stein, 2008) suggest that pools of extensor and flexor MNs can be independently controlled to be rhythmically active. The complex rhythmic motor activity of a multi-segmented limb therefore is thought to arise from the concerted action of such modules.
A modular organization of CPGs is supported also by results of studies in the stick in- sect. Pharmacological activation of the networks that control limb movements resulted in alternating activity of antagonistic motoneuron pools with different frequencies in each leg joint (Büschges et al., 1995). Thus, in the stick insect each joint is thought to be controlled by a separate CPG producing alternating activity in antagonistic MN pools.
tively. For example, in the lamprey tonic excitation from the mesencephalic locomotor region (MLR) elicits rhythmicity of swim MNs in the spinal cord (Sirota et al., 2000;
Grillner, 2003). In insects, descending drive from head ganglia, i.e. supraesophageal and subesophageal ganglion, was shown to maintain ongoing motor behavior (Kien and Altman, 1984; Ridgel and Ritzmann, 2005; Gal and Libersat, 2006). Gal and Libersat (2006) showed that “walking-related behaviors” in the cockroach, i.e. walk- ing, righting, swimming as opposed to “flight-related”, are promoted by inputs from the subesophageal ganglion. On the thoracic level, a tonic depolarization that is found throughout rhythmic activity in MNs (Büschges et al., 1994; Ludwar et al., 2005) is thought to be the physiological correlate of the received descending drive (Ludwar et al., 2005). A tonic depolarization is seen also in several nonspiking interneurons (NSIs) (Ludwar et al., 2005; Rosenbaum, 2013).
Intrasegmental sensory signals have been shown to influence timing and magnitude of the centrally generated motor output in both vertebrates and invertebrates (reviews:
e.g. Büschges, 2005; Pearson, 2000). For example, during stick insect walking, signals regarding load and position of the leg were shown to control step phase transitions (Akay et al., 2004; Cruse, 1985) and the strength of the muscle activation during stance (Akay et al., 2001). Load, movement, and position signals are shown to have access to individual joint CPGs of the own or adjacent leg joint (Bässler, 1986; Hess and Büschges, 1999; Bucher et al., 2003; Akay et al., 2004). For example, flexion movement signals of the FTi joint were shown to elicit levator MN activity and terminate depressor MN activity in the CTr joint (Hess and Büschges, 1997, 1999). Such inter-joint reflexes therefore contribute to movement coordination in the multi-segmented leg.
Sensory neurons provide input to spiking and nonspiking interneurons and rarely have direct connections with motoneurons (Burrows, 1987b; Burrows and Pflüger, 1988;
Pearson et al., 1976). Sensory neurons always make excitatory synapses but can pro- vide inhibitory effects indirectly via intercalated neurons (section 7.10 Burrows, 1996).
Sensory signals are processed state dependent (Bässler, 1986; Hess and Büschges, 1997;
Akay et al., 2007). This is, signal processing has been shown to depend on whether animals are in a resting or active state, e.g. walk (Bässler, 1986; Hess and Büschges, 1997) or on the walking direction (Akay et al., 2007). State dependent differences in signal processing can concern the strength of the effect elicited by the signal (Hess and
Büschges, 1997) or can even invert its sign: For example, flexion signals of the femoral chordotonal organ (fCO), a proprioceptor that measures movement and position of the FTi joint, excites theextensor tibiae muscle in the resting animal but inhibits ex- tensor activity in the active state (Bässler, 1986). In the stick insect, intrasegmental sensory signals are shown to have a strong impact on the motor activity and overrule intersegmental signals (Borgmann et al., 2012).
Local premotor interneurons Local premotor interneurons are subdivided into two classes according to their membrane properties and thus usual mode of information transfer: spiking local interneurons and nonspiking local interneurons. Both classes re- ceive and integrate sensory information from inter- and intrasegmental sensory neurons and are shown to control MN activity (stick insect: e.g. Büschges, 1989, 1990; locust review: Burrows, 1996). Local spiking interneurons have received little attention in the stick insect but were well investigated in the locust (Burrows, 1996).
In insects, nonspiking interneurons (NSIs) were first described in the walking system of the cockroach (Pearson and Fourtner, 1975) and intensively studied in locusts but also in stick insects (Siegler, 1985; Burrows, 1996; Büschges, 1990; Büschges et al., 1995;
Driesang and Büschges, 1996; Hess and Büschges, 1997; von Uckermann and Büschges, 2009). The defining property of NSIs is their graded transmitter release according to gradual changes in their membrane potential (Burrows and Siegler, 1978). Therefore, NSIs affect their postsynaptic neurons in a finely tuned fashion. Wilson and Phillips (1982) showed that NSIs are able to tonically release transmitter thereby permanently influencing their postsynaptic neurons. Not much is known about the transmitters that are released; however, GABA has been shown to be important (Wildmann et al., 2002).
Especially from studies in the locust, NSIs are known to receive excitatory signals from local sensory neurons (Burrows et al., 1988; Laurent and Burrows, 1988), input from spiking local interneurons (Burrows, 1987a), intersegmental projections (Laurent and Burrows, 1989a) and other NSIs (Burrows, 1979). NSIs process signals in distributed antagonistic pathways (Büschges, 1990; Bässler, 1993a). For example, as shown in the stick insect, NSIs that –when depolarized– provide excitatory synaptic drive to exten- sor MNs may be depolarized or hyperpolarized by the same sensory signal (Büschges, 1990). Therefore, in a given behavior some pathways support, others oppose the on- going movement (Büschges, 1990; Bässler, 1993a; von Uckermann and Büschges, 2009;
Rosenbaum, 2013).
In the stick insect, NSIs contribute to leg movement and posture control. NSIs that are able to affect MN activity were shown to receive load, movement, and tactile sensory signals from sensory organs of the own or other leg joints (Akay, 2002; Büschges,
phase transitions (Büschges, 1995).
In more recent studies NSI activity has been described during walking behavior, when animals were stepping on a treadwheel (Schmitz et al., 1991; von Uckermann and Büschges, 2009; Rosenbaum, 2013). In certain NSIs, the strength of the membrane potential modulations was shown to correlate with stepping velocity (von Uckermann and Büschges, 2009; Rosenbaum, 2013). In a few studies, NSIs were shown to influence behavioral output; mostly they could disrupt stepping of the leg (Schmitz et al., 1991;
Kittmann et al., 1996; von Uckermann and Büschges, 2009).
This thesis In the first part of this thesis, I tested whether stick insects adapt their searching movements to a transient tactile stimulus on the leg. I hypothesized that indeed, searching movements are confined to the former position of an object animals briefly touched with their leg. If the hypothesis proves true, this paradigm might allow to investigate in a largely intact sensory-motor system how e.g. sensory organs, changes in muscle activity, or moto- and premotor neurons contribute to movement adaptations.
In the second part, I aimed to extend the present knowledge regarding neuronal activ- ity underlying searching movements by investigating premotor nonspiking interneuron activity. This is particularly interesting for several reasons:
First, NSIs are described to be part of the centrally activated leg joint control networks (Büschges, 1995) and have been shown to participate in the generation of walking behavior (von Uckermann and Büschges, 2009; Rosenbaum, 2013). However, whether NSIs contribute to the generation of searching movements is as yet unknown. Assuming that the premotor network for joint control is involved in the generation of multiple leg movements, I postulate that NSIs which contribute to the generation of walking behavior also contribute to the generation of searching behavior.
Second, NSIs were shown to exert drive on postsynaptic MNs (Büschges 1990; Hess and Büschges 1997; Akay 2002; Rosenbaum, 2013) and to modify certain aspects of centrally generated “fictive” motor rhythms (Büschges, 1995). Furthermore, the mem- brane potential modulations of certain NSIs during walking behavior correlated with stepping velocity (von Uckermann and Büschges, 2009; Rosenbaum, 2013). However,
this does not imply causality. As yet, whether single NSIs can actually change the behavioral output was investigated only in few cases (Schmitz et al., 1991; Kittmann et al., 1996; von Uckermann and Büschges, 2009). Therefore, I aimed to test whether single identified NSIs can modify searching movements. The results are interesting also with respect to the kinematic analysis of targeted movements described in the first part of the thesis.
Third, if NSIs are involved in the generation of walking and searching behavior, their membrane potential modulations are likely to differ because of different sensory signals they receive during either behavior. A comparison of NSI membrane potential modu- lations during both behaviors might indicate which are the characteristic differences.
This might suggest sensory signals that shape the motor pattern towards either walking or searching activity.
Experiments All experiments were performed with a single-leg-preparation as pre- viously described by Karg et al. (1991). This preparation is advantageous because it prevents intersegmental sensory information. A restriction of leg movements to the vertical plane facilitates movement analysis. For experiments regarding the modifi- cation of searching movements upon object contact, a stick was introduced into the plane of leg movements. When animals touched the stick during searching movements they initiated stereotyped grasping movements in order to hook the stick with the claw (Bässler et al., 1991). However, during my experiments the stick had immediately been retracted, therefore animals could not hook the object. Because the preparation is stationary, intracellular recordings could be performed during ongoing searching be- havior. For recordings during walking behavior, a treadwheel was added to the setup such that animals could perform stepping movements. Additionally, leg movements were continuously videotaped and leg muscle activity electromyographically recorded.
Cologne. Animals were kept at constant temperature (22–24°C), 60% humidity and under a 12 h:12 h light:dark cycle. Experiments were performed at room temperature (20–24°C) and under dimmed light conditions.
2.1 Kinematic and electromyographic analysis of targeted searching movements
1Preparation
For experiments, all legs except the left front leg were cut off mid-coxa. Animals were mounted dorsal side up with insect pins or dental cement (Protemp II, 3M ESPE, Seefeld, Germany) on a foam platform, the coxa of the remaining leg being located on the edge of the platform. The leg was fixed at an angle of 90° with respect to the body axis by applying dental cement to the thorax–coxa (ThC) joint. Movements of all other leg joints (coxa–trochanter (CTr), femur–tibia (FTi), tibia–tarsus (TTa) and tarsal joints) were not restricted, thus the animal could freely move its leg in the vertical plane. Animals were not able to touch the ground. Accordingly, when analyzing searching movements of the middle leg, all legs except the middle leg were cut and the middle leg was fixed as described previously.
1Major parts of the methods section concerning behavioral and electromyographic analysis of targeted leg searching movements are already published: E. Berg, A. Büschges, and J. Schmidt (2013)Single perturbations cause sustained changes in searching behavior in stick insectsJournal of Experimental Biology 216, 1064-1074. The authors contributions to the paper are as follows: EB, AB, and JS designed research; EB performed experiments, analyzed data and prepared figures; EB, AB, and JS wrote manuscript. Except for minor modifications, the methods section is taken literally from the paper. Methods of experiments not included in the paper were added in the appropriate parts -i.e. methods concerning ablation of femoral chordotonal organ or supraesophageal ganglion, as well as movement analysis of the mesothoracic leg.
Ablation experiments For experiments regarding the influence of vision, the animals’
view was either blocked by a black paperboard between head and leg or their eyes were covered with black ink.
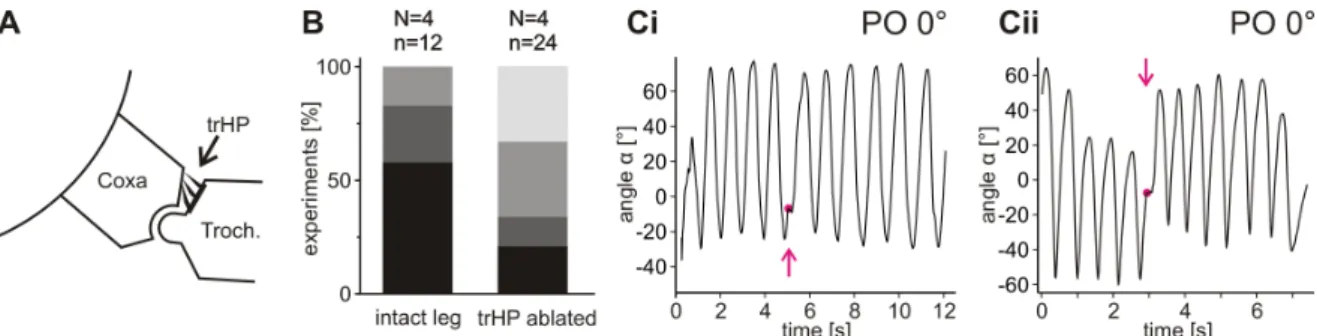
In several experiments, the trochanteral hairplate (trHP, termed BF1 by Wendler, 1964) was shaved off with a razor blade (Akay et al., 2001). Success of the ablation was verified by means of a scanning electron microscope (Quanta FEG 250 ESEM, FEI) after the experiments.
The influence of tibial and tarsal sensory information (tactile hairs, campaniform sen- silla) was eliminated by cutting the leg distal to the FTi joint. The tibial stump was hollowed out with an insect pin to prevent signals from campaniform sensilla (CS) groups 6A and 6B (Zill et al., 2011), which are located just distal to the FTi joint.
The tibia was replaced by a wooden stick of appropriate length and mass to serve as prosthesis. Values for length and mass had been obtained beforehand from mean values of several animals.
In some experiments additionally all trochanteral and femoral CS were ablated by indentation of the cuticle with a pin. Success of ablation was verified by means of a scanning electron microscope (Quanta FEG 250 ESEM, FEI) after the experiments.
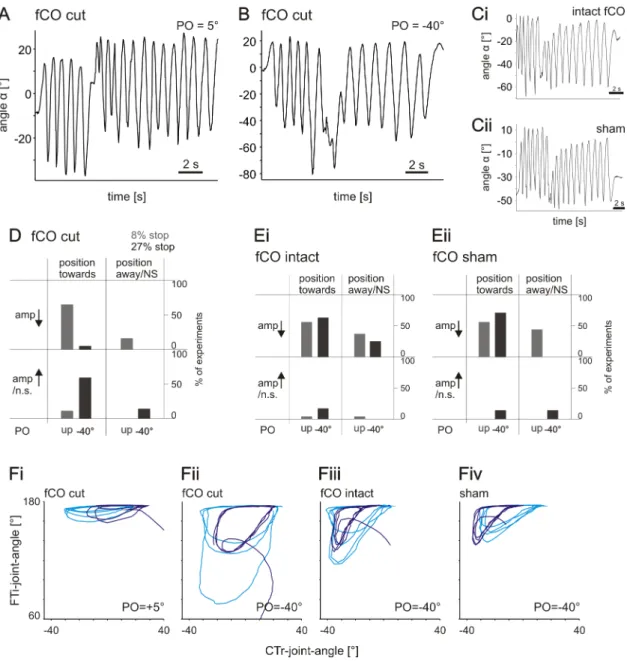
In order to prevent the femoral chordotonal organ’s (fCO) influence, a small opening was cut into the dorsal femoral cuticle approximately mid-femur, such that the cu- ticle could be opened like a door. Then, the fCO receptor apodeme was cut. Lost hemolymph was replaced by saline (pH 7.2, Weidler and Diecke, 1969) and the opening closed again. For “sham”-experiments, the same procedure was applied except for ac- tually cutting the apodeme. After “sham”-experiments had been recorded, searching movements of these animals were also recorded with cut fCO-apodeme.
To ablate the supraesophageal ganglion (henceforth "brain"), a window was cut into the frontal head cuticle between the eyes. The circumesophageal connectives between brain and subesophageal ganglion were cut to remove the brain from the head (Fig. 3.10).
Electromyograms For recordings oflevator and depressor trochanteris muscle activ- ity, two copper wires (57 μm, insulated except for the tip) were inserted into each muscle through small holes in the dorsal and ventral posterior coxa of the front leg before fixation of the coxa (Rosenbaum et al., 2010).
Experimental setting
Searching movements were elicited by slightly touching the animal at the abdomen with a paintbrush (‘tickling’) or by a puff of air directed at the antennae or abdomen.
Dr. Kremer Farbmühle, Aichstetten, Germany) at the very tip to make it detectable during video analysis of the leg’s movements. In random order, the stick was introduced into the plane of leg movements in one of four different positions (henceforth ‘position of object’ (PO); see Fig. 3.1 C). The experimental setting for the analysis of middle leg searching movements was the same; the position of the stick was adapted to the position of the middle leg accordingly.
Data acquisition and analysis
Video Leg movements were recorded from a frontal view at a frame rate of 50 Hz (AVT Marlin, Allied Vision Technologies, Stadtroda, Germany) and stored on a com- puter using firmware (AVT ActiveCam). If electromyogram (EMG) signals were ob- tained simultaneously, then both film and EMGs were recorded using Spike2 software (Version 5.20, CED, Cambridge, UK). Yellow fluorescent markers (fluorescent pigment, Dr. Kremer Farbmühle, Aichstetten, Germany) were applied to the leg (Fig. 3.1 C) to facilitate the analysis of leg movements. Pigment fluorescence was evoked by LED illumination (λ=395 nm) and filtered by a high-pass filter (λ>575 nm) mounted on the camera lens.
Movements were tracked using WinAnalyze (Version 2.2 2D, Mikromak, Berlin, Ger- many) or MATLAB (Version 7.11, MathWorks, Natick, MA, USA) using a custom- written program (StickAnalyze, written by Dr. Till Bockemühl, Zoological Institute, University of Cologne, Cologne, Germany). As the size of animals varied, positions of the leg were not expressed in coordinates but as an angle, α, which was formed by a straight line from the coxa to the distal end of the tibia and a horizontal that was set by the coxa and a reference marker to the right side of the animal (Fig. 3.1 C).
Positions above the horizontal were defined as positive values ofα, positions below the horizontal as negative values. When considering positions of the CTr and FTi joints, I used angles β and γ, respectively. The coordination of the CTr and FTi joints during searching movements is very stereotyped; movements in both joints are generally cou- pled (Fig. 3.1 B; see Results). Because of this coupling, the sameαis generally defined by very similarβand γvalues in each animal and the distal tibia repeatedly moves on very similar trajectories during consecutive searching cycles (Fig. 3.1 A). Therefore, α
sufficiently describes the position of the most distal third of the tibia, which was the location of contact with the stick.
Calculation of average leg position before and after contact with the object For each experiment, average leg position as the average α was calculated for four consecutive searching cycles directly before and after leg contact with the object. α values were obtained for each video frame in four cycles. For example, four searching cycles in 2.4 s give 120αdata points. The average of these gives the average leg position.
For each experiment, the pooled data points obtained from four cycles before and after leg contact with the object were used to test for statistical significance of differences of the means (Mann–Whitney U-test,α=0.05). Amplitudes were calculated for half-cycles of searching movements. Thus, eight values obtained from four cycles before touching the object were pooled and compared with eight values after touching (Mann–Whitney U-test,α=0.05). No pause occurred within each of the four searching cycles and animals were not ‘tickled’ along the way. Animals were only included in analyses if at least one experiment was performed with the PO above the horizontal (0, +15 and +25 deg) and one with PO=–40 deg. If the distance from the PO to average leg position before touching was <10°, the experiment was excluded from the statistical analysis of the change of average leg position, but included in all other analyses. In experiments regarding the influence of the fCO on a change in searching movements after contact, experiments with less than four cycles before leg contact were included in the analysis in order to increase the number of experiments. Experiments had a minimum of 2.5 searching cycles in experiments with cut fCO-apodeme, "sham"-operated apodeme and corresponding intact leg.
Statistical analyses were conducted in SPSS (IBM, Armonk, NY, USA) and MATLAB.
Curves were fitted to the amplitude and average leg position data sets, respectively, in MATLAB. Data points directly after touch were left out of the fit if the maximum deviation of values from control occurred in the second cycle instead of the first after touch (amplitudes: one data point in 7 of 23 cases; average leg position: three data points in 3 of 21 cases). The mean angular speed was calculated by averaging the absolute values of the first derivation ofαfrom one minimum of the leg position to the next minimum.
Electromyograms EMG signals were amplified (custom-built amplifier, model 102 Electronics workshop, Zoological Institute, University of Cologne, Cologne, Germany) 3000–10,000 times according to signal amplitude and filtered (low-cut 100 Hz, high-cut 2 kHz). The data were digitized with a rate of 12.5 kHz (Micro 1401k II, CED) and stored using Spike 2 (Version 5.20, CED, Cambridge, UK).
touching the object. Figures were created in Origin (Version 6.0, Microcal Software, Northampton, MA, USA) or MATLAB and modified in Corel Draw (Version 13, Corel, Ottawa, CA).
A single experiment consisted of four searching cycles before touching the object and four cycles after touching the object.
N = number of animals, n = number of experiments (throughout the section concerned with behavioral and electromyographic analysis).
2.2 Electrophysiological analysis of the premotor network for leg searching movements
In order to investigate the activity of the premotor network during searching move- ments, intracellular recordings of nonspiking interneurons (NSIs) were performed si- multaneously with video recordings as described previously. Again, muscle activity was recorded from levator and depressor trochanteris muscles and in addition from extensor and flexor tibiae muscles. Due to the better accessibility of the mesothoracic ganglion as compared to the prothoracic ganglion, these experiments were performed with the single middle leg preparation.
Preparation and experimental setting
The animal was placed on a platform, all legs except the left middle leg were cut, and the coxa of the left middle leg was fixed as described previously (section sec. 2.1). Therefore, the animal was free to move its middle leg in the vertical plane. Searching movements were elicited by ‘tickling’ or a puff of air directed at the antennae or abdomen, as described above (sec. 2.1).
To additionally allow walking movements, a custom made treadwheel could be added to the setup during the experiment. It was composed of two styrofoam drums of 40 mm diameter, 28 mm width and 50 mm center distance that were connected by a belt of crepe tape. The two drums were each mounted on a micro-DC motor (DC1516,
Faulhaber, Schönaich, Germany) of which one supported the treadwheel’s movements to reduce friction. The second motor can serve as tachometer but its output was not recorded during these experiments (for details see Gabriel et al., 2003). The treadwheel was placed rectangular to the platform, i.e. the body axis of the animal, beneath the middle leg. Therefore, the animal could perform steps with fixed ThC joint. The tread- wheel height was adjusted such that the femur position was approximately horizontal when the FTi position was 90°.
The treadwheel was also used to test the influence of FTi joint position and movement, i.e. information from the femoral chordotonal organ, on the membrane potential of NSIs. For this purpose, the treadwheel was manually moved back and forth when the leg was resting on it, thereby flexing and extending the FTi joint (i.e. elongating and relaxing the fCO-apodeme) while the CTr joint was not moved.
Data acquisition
Video recordings Leg movements were recorded in the same way as described in sec. 2.1, except for a different software (Spike2 Video Recorder, implemented in Spike2, Version 7.09, CED, Cambridge, UK) that was used to specify (the same) recording parameters. A custom written Spike2 sequencer script was used to trigger the recording with 50 Hz. The trigger signal was recorded in Spike2 in order to detect if any video frames were lost during the recording.
Electromyographic recordings The activity of levator and depressor trochanteris muscles was recorded as described in the previous section sec. 2.1. Additionally, the ac- tivity ofextensor andflexor tibiaemuscles was either recorded simultaneously with one pair of copper wires inserted trough holes into the proximal posterior femur at medium height or with separate pairs of wires inserted dorsally and ventrally, respectively. The wires were attached to the cuticle by dental cement (Protemp II, 3M ESPE, Seefeld, Germany). EMG signals were recorded and digitized as described above (sec. 2.1).
Intracellular recordings The animal was opened by a dorsal midline incision from prothorax to metathorax. The cuticle was fixated to remain open with minuten pins.
The gut was left intact but pulled and placed beside the animal. The cavity was filled with saline (pH 7.2, Weidler and Diecke, 1969). Fat tissue and tracheae were removed to expose the mesothoracic ganglion. The nerves nl2 (nervus lateralis 2;
containing protractor coxae MNs), nl5 (retractor coxae MNs), nervus anterior and posterior were cut on both sides. The nervus cruris contralateral to the intact leg was crushed several times with a forceps to prevent afferent and efferent signals. The
glass (GB 100TF-8P, Science Products, Hofheim, Germany) using a Sutter Micropuller (P-1000, Sutter Instruments, Novato, CA, USA) and filled with 3M KAc/ 0.1M KCl electrolyte. Signals were recorded in bridge mode (intracellular amplifier SEC-10L, npi electronics, Tamm, Germany) using Spike2 software (Version 7.09, CED) on a personal computer.
Intracellular stainings For experiments in which neurons were stained in addition to electrophysiological characterization, 5% neurobiotin (Vector Laboratories Inc, Burling- ame, CA, USA) was added to the electrode solution. Neurons were filled with this so- lution by applying depolarizing current pulses (+2 nA, 400 ms pulse duration, 1 Hz) for up to 15 minutes. The ganglion was removed from the animal while 45-60 minutes were allowed for dye diffusion. Afterwards the ganglion was fixated for 20 minutes with 4%
paraformaldehyde (PFA) in 0.1M phosphate-buffered saline (PBS) and 5% Triton X (Fluka, Buchs, Switzerland) and then fixated for 2-16 hours in 4% PFA. The ganglion was washed (3x15 minutes with PBS) and then treated with Streptavidin-Cy3 (1:500 in PBS, Sigma-Aldrich, St. Louis, MO, USA) in 0.5% Triton X and 2% normal goat serum (Vector Laboraties Inc, Burlingame, CA, USA) over night on a shaker at 4°C.
After washing (3x15 minutes with PBS) and dehydration with an ascending ethanol series (50%, 70%, 90%, 2x100%; 10 minutes each) the ganglion was mounted on a concavity object slide in methylsalicylate and scanned with a confocal laser scanning microscope (LSM 510 meta, Carl Zeiss, Germany). Throughout the thesis, images of the stainings are shown from a dorsal view and the anterior side of the ganglion is oriented towards the upper margin of the image.
Identification of nonspiking interneurons The neuron’s membrane potential mod- ulations were recorded from their neuropilar aborizations. The output connections of NSIs were determined by observing the effect of depolarizing and hyperpolarizing current puls injections onto EMG recordings and leg movements. The membrane po- tential modulations during walking, as well as the response to stimulation of the fCO (via treadwheel), was used to match the neurons to identified neurons that had already been described previously (e.g. Büschges, 1990; Sauer, 1996; Hess and Büschges, 1997;
Stein and Sauer, 1998; Akay, 2002; von Uckermann and Büschges, 2009; Rosenbaum, 2013).
Neurons were considered nonspiking if they fulfilled the following criteria: 1) No spike occurred throughout the whole recording, i.e. a) no spikes could be evoked by unspe- cific stimulation of the abdomen or antennae when activating the animal to perform searching or walking movements; b) no spike was induced by stimulation of sensory organs; c) there was no rebound spike after hyperpolarizations; d) there was no spike when changing the membrane potential by injections of depolarizing current. 2) Nev- ertheless, when de- or hyperpolarized by current injections the neuron affected the leg motoneurons by eliciting activity in EMG recordings or leg movements (see also Burrows and Siegler, 1976; Hengstenberg, 1977; Burrows, 1981; Wilson, 1981; Siegler, 1985; Büschges, 1990). Morphologically, neurons were classified according to their soma location and their main processes, i.e. primary and secondary neurites.
All NSIs shown in this thesis had a clear and reproducible influence on leg motoneurons shown either by eliciting activity in one or more EMG recordings and/or leg movements when de- or hyperpolarized by current injections. The analyses of recordings of 53 NSIs were included in this work, of which 41 NSIs were stained.
Data analysis
Video recordings were processed as described in the previous section (sec. 2.1) and the position signals of both CTr and FTi leg joints, as well as the overall angleα, were im- ported into the corresponding Spike2 file containing EMG and intracellular recordings.
Electromyographic and intracellular recordings together with position information were analyzed with Spike2 and Matlab (Version 7.11, MathWorks, Natick, MA, USA) using custom written scripts, and Microsoft Office Excel 2007. Figures were prepared with MATLAB (Version 7.11, MathWorks, Natick, MA, USA) and Corel Draw (Version 13, Corel, Ottawa, CA).
For NSIs that were recorded at least three times, average membrane potential, peak- to-peak potentials, and standard deviations were calculated as weighted means. When quantifying the effect of tonic de- or hyperpolarizing current injection during ongoing searching behavior, current pulses were included in the analysis if 1) the pulse was given during ongoing searching behavior; 2) the pulse had a duration of at least two searching cycles. Changes in searching movements were considered to be an effect of current injection if they started within two cycles of searching movements from start of current injection. Changes in CTr and FTi joint coordination were evaluated regarding the center of the trajectories (when FTi was plotted against CTr joint position). If this center moved horizontally or vertically along the x- or y-axis, this was not considered
3.1 Kinematic analysis of targeted searching movements
1When slightly touched on the abdomen or activated by a puff of air, stick insects performed stereotypical searching movements in the vertical plane with their fore- leg (Fig. 3.1 A,B) (Karg et al., 1991). Searching movements covered a wide range of 75±17 deg (measured asα; see Fig. 3.1 C; N=14, n=76, ~300 cycles) and were centered on a rather stable average leg position. As described by Karg et al. (1991), downward movements started with depression of the CTr joint whereas the FTi joint remained fully extended or was finishing its extension movement from the previous searching cycle. Approximately halfway down the searching range, CTr movements slowed down whereas the FTi joint started to flex (Fig. 3.1 A, black lines). During upward move- ments, the FTi joint was extended together with a simultaneous or immediately fol- lowing elevation of the CTr joint (Fig. 3.1 A, magenta lines). The coordination of both joints was highly consistent throughout consecutive cycles of searching movements, as can be seen when the FTi angle (γ) is plotted against the CTr angle (β), which results in closely matching trajectories (Fig. 3.1 B).
1Major parts of the section concerning behavioral and electromyographic analysis of targeted leg searching movements are already published: Berg, Büschges, and Schmidt Single perturbations cause sustained changes in searching behavior in stick insects Journal of Experimental Biology 216, 1064-1074, 2013. The authors contributions to the paper are as follows: EB, AB, and JS designed research; EB performed experiments, analyzed data and prepared figures; EB, AB, and JS wrote manuscript. Except for minor modifications, this results section is taken literally from the paper. Results of experiments not included in the paper were added in the appropriate parts -i.e.
results concerning ablation of femoral chordotonal organ, campaniform sensilla, or supraesophageal ganglion, as well as movement analysis of the mesothoracic leg.
Figure 3.1– (A) Schematic of leg kinematics during downward (black) and upward (ma- genta) movement of an undisturbed searching cycle. (B) Movements of the femur–tibia (FTi) joint plotted against movements of the coxa–trochanter (CTr) joint for several cy- cles of searching movements. Arrows indicate upward and downward movements of the leg. Coordination of both joints movements are very stereotyped. (C) Schematic draw- ing of the experimental setup (modified from von Uckermann and Büschges, 2009). The leg is shown from the camera’s perspective. Magenta circles indicate the four different positions of the object (POs); yellow circles denote markers. Angle α gives the position of the distal tibia relative to the body, angleβ gives the position of the coxa–trochanter joint and angleγ gives the position of the femur–tibia joint.
3.1.1 Qualitative analysis of searching movements
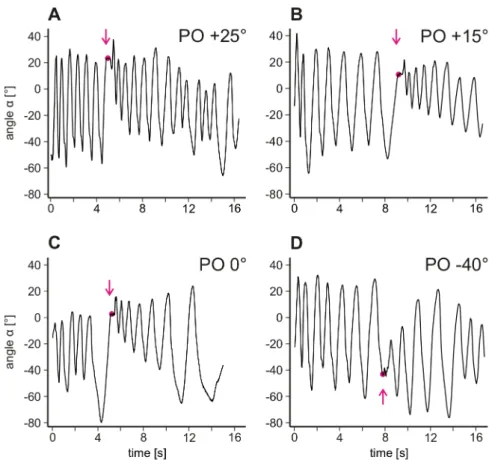
To determine whether searching movements are modified after touching an object with the leg, after four cycles of undisturbed searching movements, a stick was moved into the plane of movement from behind such that the animal would eventually touch it with its distal tibia. Immediately after contact, the stick was retracted and searching movements were observed. The stick was alternately placed in one of four positions (Fig. 3.1 C). Upon touching the object, generally two parameters of the searching move- ments changed. Fig. 3.2 shows these changes in searching movements of a single ani- mal for all four POs. Searching trajectories are plotted as angles (α) over time. First, upon touching the object, the average leg position was shifted towards the PO. It was shifted upward if the PO was located above the average leg position before touching (Fig. 3.2 A–C) and downward if the PO was located below (Fig. 3.2 D). Subsequently, searching movements were gradually shifted back towards the initial average leg po- sition. Second, upon touching the object, the amplitude of searching movements was instantly decreased and gradually increased again. The combined occurrence of these changes may be interpreted as a targeted searching movement that wanes over time.
Henceforth, movements that shifted towards POs and that were reduced in amplitude
Figure 3.2 – Searching movements plotted as angle α over time. All four experiments are recorded from the same animal and examples are shown for each of the four different POs used: +25° (A), +15° (B), 0° (C) and −40° (D). Magenta arrows indicate the point in time when the object was touched, and magenta circles indicate the PO. The large amplitude before contact in C is an outlier with no relation to the subsequent contact.
will be named targeted searching movements. Movements that showed changes in only one or none of the two parameters were considered non-targeted.
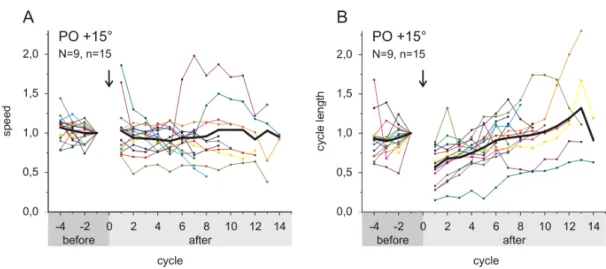
The mean angular speed of leg searching cycles did not change after touching the ob- ject (Fig. 3.3 A). Single experiments (colored lines) could show a decrease or increase in speed; however, these changes were not systematic, as average data (black line) were not different from control values (Fig. 3.3 A). As a consequence of the unchanged angular speed and the decrease in amplitude, the cycle duration of searching move- ments instantly decreased upon touching an object and subsequently increased again (Fig. 3.3 B). Fig. 3.3 shows the results for targeted searching movements at a PO of +15° (N=9, n=15). Curve progression was similar for non-targeted searching move- ments as long as the amplitude of movements decreased (N=4, n=5; not shown). If the amplitude was not decreased, both angular speed and cycle duration tended to in- crease (N=2, n=2). Despite their overall stereotypy, searching movements in different experiments displayed a considerable amount of variability regarding initial average leg position and size of amplitude (compare cycles of undisturbed searching movements in Fig. 3.4). Also, average leg position and amplitude of searching movements could
Figure 3.3 – Mean angular speed (A) and cycle duration (B) of searching movements plotted over cycle number. Values are normalized to the last cycle before touching the object. Cycles before touch (−4 to −1) are highlighted in dark gray on the x-axis; cycles after touch (cycle 1 to end) are highlighted in light gray. Colored curves depict single experiments; black curves show mean values. Arrows indicate the point in time when the object was touched. N, number of animals; n number of experiments.
Figure 3.4– Average leg position and movement amplitude may change independently after contact with the object. Searching movements plotted as angleαover time for two experiments with a PO of 0°. Magenta arrows indicate the point in time when the object was touched, and magenta circles indicate the PO. (A) Amplitudes change but average leg position remains constant. (B) Average leg position changes but amplitudes remain constant.
be altered independently of each other. Fig. 3.4 A shows an experiment in which the amplitude changed but average leg position remained the same, whereas in Fig. 3.4 B only the average leg position was changed.
3.1.2 Quantitative analysis of searching movements
For a quantitative measure of the observed changes, I tested for differences in average leg position and amplitude between four cycles directly before and after touching the object. The results show that the average leg position was significantly shifted towards the PO in most cases for all four POs (73–91% of experiments, Mann–Whitney U-test,
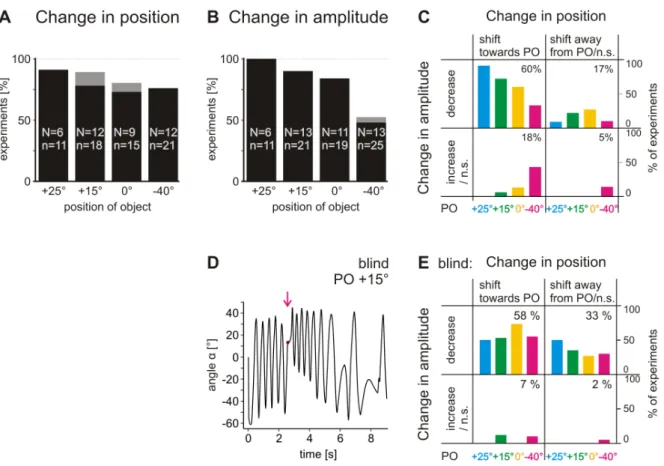
Figure 3.5– Changes in average leg position and movement amplitude upon touching the object. (A) Change in position. Black bars, percentage of experiments in which aver- age leg position shifted significantly towards the PO; gray bars, percentage of experiments in which average leg position shifted significantly away from the PO. Experiments are sep- arated according to the respective POs of +25°, +15°, 0° or −40°. Non-significant changes are indicated by gaps between bars and the 100% line. (B) Change in amplitude. Black bars, percentage of experiments in which amplitudes significantly decreased; gray bars, percentage of experiments in which amplitudes significantly increased. (C) Frequency of appearance of different combinations of changes in average position and changes in amplitude for the different POs. POs are indicated by color. Left quadrants: average leg position was significantly shifted towards PO. Right quadrants: average leg position was significantly shifted away from PO or not significantly (n.s.) shifted. Upper quadrants:
amplitudes decreased significantly. Lower quadrants: amplitudes increased significantly or did not change significantly. Numbers in quadrants give the mean relative frequency of the combined occurrence of a change in position and in amplitude. PO +25°: N=6 an- imals, n=11 experiments; PO +15°: N=12, n=18; PO 0°: N=9, n=15; PO −40°: N=12, n=21. (D) Searching movements of a blindfolded animal plotted as angleα over time for an experiment with a PO of +15°. (E) Experiments with blindfolded animals grouped according to the combination of changes in leg position and amplitude after contact with the object. Other details as in C. PO 25°: N=3, n=8; PO 15°: N=7, N=17; PO 0°: N=6, n=15; PO −40°: N=7, n=20.
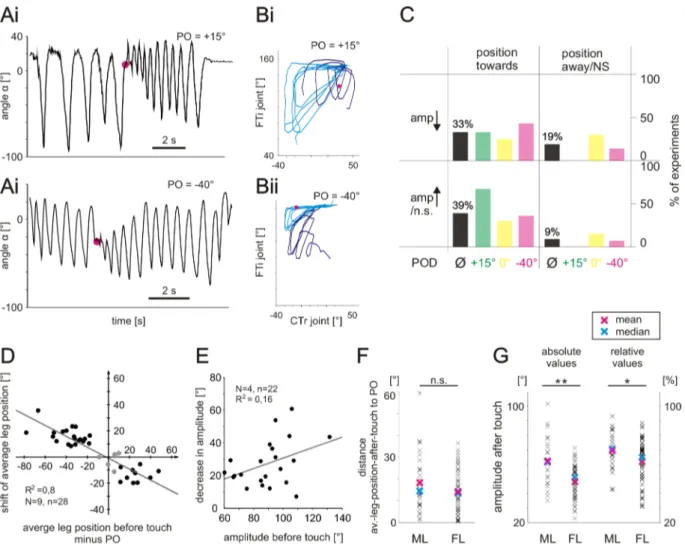
Figure 3.6– Extent of changes in average leg position and movement amplitude. (A) The magnitude of shifts in average leg position depends on the difference from the PO to the average leg position before touch. Each data point denotes the extent of shift of leg position for one experiment. Data points in the upper left (lower right) quadrant come from experiments in which the PO was located above (below) the average leg position before touch. (B) Magnitude of decrease in movement amplitude depends on amplitude before touch. The regression line is drawn in gray. N, number of animals; n, number of experiments.
P<0.05; Fig. 3.5 A). Only rarely was the average leg position significantly shifted away from the PO (gray bars) or not significantly shifted at all. Also, the amplitude of leg movements was decreased significantly in the majority of experiments for POs of +25°, +15° and 0° (84–100% of experiments, P<0.05; Fig. 3.5 B, black bars). When disturbed at PO=–40°, the amplitude decreased significantly in 48% of experiments (P<0.05). A more comprehensive view on leg searching movements is provided in Fig. 3.5 C, which displays the frequency of appearance of different combinations of changes in average position and changes in amplitude for the different POs. Targeted searching move- ments, that is a shift of average leg position towards the PO and at the same time a reduction of amplitude, occurred in the majority of experiments (60–91%) for POs of +25°, +15° and 0° (upper left quadrant of Fig. 3.5 C). Only for a PO of −40° was a targeted response not the predominant behavior, as the amplitudes of movements were often not decreased significantly (magenta columns in upper and lower left quad- rants in Fig. 3.5 C). Searching movements that, upon touching the object, were not shifted towards the PO and did not show decreased amplitudes only occurred in 5%
of experiments (lower right quadrant). Visual information was not necessary for the generation of targeted searching. In experiments performed with blindfolded animals (N=8, n=76), both average leg position and amplitude changed in the same way as in sighted animals (Fig. 3.5 D). Evaluation of the frequencies of different combinations of changes in both parameters resulted in an average percentage of targeted responses
Figure 3.7– Searching movements plotted asγ(FTi angle) againstβ(CTr angle). Cyan trajectories depict four cycles of searching movements before contact with the object; dark blue trajectories depict four cycles after contact. Magenta circles indicate leg joint angles when objects were touched (and thus the PO). Black lines show leg kinematics of half a cycle of undisturbed searching movements of the respective experiment. (A) Experiments from the same animal, with POs of +15° (Ai) and –40° (Aii). (B) Experiments from another animal, with POs of +25° (Bi) and –40° (Bii).
(58%; Fig. 3.5 D) very similar to that in sighted animals (60%; Fig. 3.5 C). In animals that responded with targeted searching movements to touching the object, the mag- nitudes of shifts were highly correlated with the distance between the PO and the average leg position before touching the object (R2=0.916, P<0.001; Fig. 3.6 A). This high correlation indicates the shift towards PO as a flexible situation dependent adap- tive behavior. On average, leg positions were shifted by 62±23%. For amplitudes, the magnitudes of changes were moderately correlated with the size of the amplitude before touch (R2=0.609, P<0.001; Fig. 3.6 B). On average, amplitudes changed by 38±14%.
3.1.3 Contribution of CTr and FTi joints to targeted searching movements
So far, leg positions have been described by a single angle, α. The coordination of the CTr and FTi joints during searching movements is very stereotyped, movements in both joints are generally coupled (Fig. 3.1B). Thus, α is a sufficiently precise single parametric measure of the overall leg movements to demonstrate the targeted response that animals perform upon touching an object. However, α does not describe how each of the two involved joints, CTr and FTi, contribute to the leg trajectories dur- ing searching movements and especially to the changes in searching movements upon touching an object. Thus, I plotted angle γ (FTi joint) against angle β (CTr joint);
four examples from two animals are shown in Fig. 3.7. As can be seen in Fig. 3.7, upon contact with the object, the movements of both joints were changed regarding their center and amplitude. The extent to which they contributed to the leg’s new trajectory mainly depended on the PO: upon contact in an upper position, changes in α were mainly due to a decrease in FTi joint movements (Fig. 3.7 Ai,Bi). Maximal
contact with an object, the stereotyped coordination pattern of both joints basically did not change. Rather, leg movements were confined to a section of the previous work- ing range of searching movements while retaining the inter-joint coordination of the respective section. I never observed that amplitudes (α) were decreased by increased movements at the CTr joint and compensating increases in movements at the FTi joint.
While the point of contact with the object did not change from animal to animal and a single animal’s joint coordination was rather stereotypical, joint anglesβand γcould vary among animals for a givenα (compare Fig. 3.7 Aii and 7Bii).
3.1.4 Trochanteral muscle activity underlying targeted searching movements
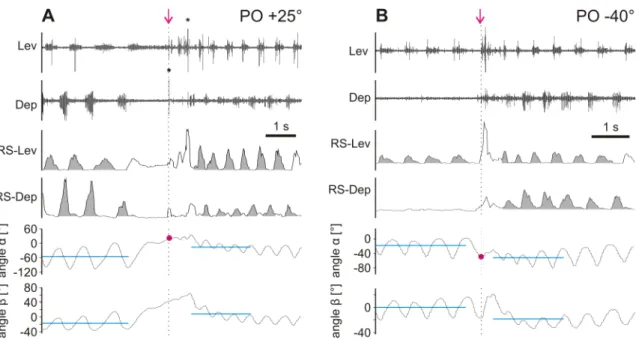
In order to analyze the muscle activity underlying the observed changes in searching movements, EMGs of levator and depressor trochanteris were recorded. The antago- nists showed alternating bursting activity correlated with femoral levation and depres- sion (Fig. 3.8, top two traces). Rectification and low-pass filtering (smoothing with a time constant of 0.05 s) of EMG recordings (RS-EMG) (Gabriel et al., 2003) give an approximation of the overall excitation of the respective muscles (Fig. 3.8, middle two traces). Changes in the integrals of RS-EMGs (gray areas below the curve) of the levator and depressor muscle were accompanied by shifts of average leg position (cyan line) upon touching the object. Upon contact, mainly depressor activity decreased, thereby causing an increase in the ratio (from 1 to 6) of levator to depressor activity (Fig. 3.8 A). This relative increase in levator activity was accompanied by an upward shift of the average position of the femur (β, cyan line) and the entire leg (α, cyan line) (Fig. 3.8 A, bottom two traces). A decrease in the ratio (from 1 to 0.003) of levator to depressor activity was accompanied by a downward shift of the average position of the femur and the entire leg (Fig. 3.8 B). Such changes in activity were observed in 17 out of 18 experiments. The change in ratio was due to either altered activity in both the levator and depressor trochanteris or changes in activity in only one of the muscles. In some cases femoral levation and depression was accompanied by activity in only one of the antagonists (Fig. 3.8 B, second, fourth and sixth traces from the top).
Figure 3.8– Activity in levator and depressor trochanteris muscles in experiments with a PO above (+25°; A) and below (−40°; B) the average leg position, shown as original EMGs (two top traces) and after rectification and smoothing (RS-EMG; two middle traces). Asterisks mark two muscle potentials that have been clipped. Gray areas indicate integrals of RS-EMGs. Lower two traces show the position of the entire leg as angle α, and the position of the femur as angle β (CTr joint). Cyan lines indicate average leg position and femur position before and after touching the object. Please note that four cycles before touch were included in analysis but only three cycles are shown. Magenta arrows indicate the time point of touch, and POs are marked by magenta circles.
3.1.5 Persistency of changed searching movements
I was interested in the time it takes for altered searching movements to be restored to initial values. Therefore, initial values were calculated for both parameters (average leg position and amplitude) from the four cycles (eight half-cycles resulting in eight data points) before touching the object (solid cyan lines in Fig. 3.9). For cycles after touch, average leg position and amplitudes of movements were calculated per half- cycle and plotted over time. A curve (see above) was fitted to each resulting data set (solid dark blue lines in Fig. 3.9). Prediction bounds (dotted lines) were adjusted such that they contained 90% of the data points. I evaluated 23 experiments from five animals. Amplitudes were evaluated for all 23 experiments; the average leg position was evaluated for only 21 experiments as a result of exceptionally large variations in leg position before touching the object in two experiments. In 91% of experiments evaluated regarding the amplitude and 81% regarding average leg positions, exponential fits yielded R2-values larger than 0.8 or resulted in the best R2-values (as compared with linear, power or logarithmic fits). However, in several cases the data could be well fitted (R2≥0.8) by more than one function type. In 36% of cases the best fit was yielded by
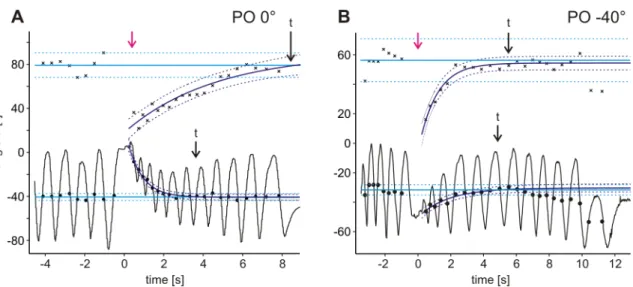
Figure 3.9– Restoration of changes in searching movements upon touching the object at POs of 0° (A) and –40° (B). Black curves depict searching cycles throughout an experiment, plotted as angle α over time. Magenta arrows indicate the point in time when the object was removed after touch and searching movements were resumed. Black circles give average leg positions for half-cycles of searching movements; black crosses give mean amplitudes of half-cycles of searching movements. Initial mean values of average leg position and amplitudes before touch are displayed as cyan lines. Dark blue lines indicate best fits to average leg position and amplitude data after touch, showing the restoration of average leg position and amplitude; dotted cyan and dark blue lines give corresponding prediction bounds. Distances between magenta arrow and the two arrows marked ‘t’ indicate recovery time for amplitude (upper) and average leg position (lower).
either power, linear or logarithmic curves. Nevertheless, in all 44 evaluated cases I used exponential fits to determine the duration of the changes. The time from removal of the object (magenta arrow, Fig. 3.9 A) to the intersection of the initial value fit and the exponential fit (arrows ‘t’, Fig. 3.9 A) was interpreted as the time required to restore initial values. In approximately half of the experiments, the exponential fit closely approached the initial value but did not intersect. In those cases, a different approach was used: the duration of change was defined as terminated when the exponential fit had achieved 99% of its final value, thus the slope was close to zero (arrow ‘t’
in upper trace, Fig. 3.9 B). Both approaches resulted in similar durations. In seven experiments, initial amplitudes or average leg positions were not regained, that is, even prediction bounds did not intersect. These cases were excluded from data evaluation.
For amplitudes, it took 6±2.9 s to be restored to initial values, and for average leg positions it took 6±4.0 s. However, as is obvious from Fig. 3.9 A, the duration required to regain the initial average leg position or amplitude could differ even in the same experiment.