walking direction and walking speed in an insect
Inaugural-Dissertation zur
Erlangung des Doktorgrades
der Mathematisch-Naturwissenschaftlichen Fakultät der Universität zu Köln
vorgelegt von
Philipp Rosenbaum
aus Soest
Köln Mai 2013
Prof. Dr. Peter Kloppenburg
Tag der mündlichen Prüfung:
05. Juli 2013.
The neuronal basis of locomotion is largely investigated in many different verte- brate and invertebrate species. Especially studying the neuronal control of adap- tive locomotor behaviors is important to reveal general insights into nervous sys- tem function. In this thesis, the stick insects Carausius morosus and Cuniculina impigra were used to investigate how important parts of the locomotor network generate different walking directions and walking speeds. In order to study which parameters have to be changed to generate the different behaviors, leg muscle, motoneuron, and premotor nonspiking interneuron activity was recorded.
In the first part, leg muscle activity during forward, backward, and curve walking was studied in a slippery surface setup, in which the animal is stationary about a slippery substrate and all legs can freely move. Muscle activity and timing was compared during different walking directions. The main change was observed in protractor and retractor muscles which move the leg in anterior and posterior direction. These muscles almost completely reverse their phase of activity with the change of walking direction, and intermediate changes occur in the inside leg during curve walking, depending on the steepness of the curve.
In the second and third part, leg motoneuron and interneuron activity was recorded intracellularly in the single-leg preparation, in which only one leg is able to move in the vertical plane on a treadwheel. Fictive forward and backward walking can be reliably elicited in this preparation. It is known that leg motoneurons receive tonic depolarizing synaptic inputs from higher centers throughout walking, and additional phasic excitatory and inhibitory inputs from leg sense organs, as well as phasic inhibitory inputs from the rhythm generating network. It could be shown that similar inputs shape the motoneuron modulation pattern also during back- ward walking. The phase of the step cycle in which the phasic inputs to protractor and retractor MNs occur reverses during backward walking. It was shown previ- ously that stepping velocity in the single-leg preparation is correlated to flexor MN activity (stance) but not extensor MN (swing) activity. These findings are con- firmed in this thesis and also held for backward walking. No such influences could be shown for other stance phase motoneurons. Furthermore, premotor nonspiking interneurons were recorded to investigate their contribution to the generation of different walking directions and walking speeds. These neurons are known to in- tegrate signals from descending, central, and sensory sources and thus contribute to the control of timing and magnitude of the motor output. Previously identified (E3, E4, E5, E7, I1, I2), as well as newly described nonspiking interneurons pro- viding synaptic drive to motoneurons of all leg joints were recorded during forward and backward stepping. Interestingly, neurons could be identified which contribute
shown that all recorded nonspiking interneurons contribute to the motor output during walking in both directions, suggesting that the same premotor network is responsible for the generation of both behaviors. NSI activity also underlies tonic and phasic synaptic inputs. Additionally, the contribution of NSIs to the genera- tion of different stepping velocities was investigated.
Zusammenfassung
Die neuronale Kontrolle der Fortbewegung wird seit langer Zeit an vielen Vertebra- ten und Invertebraten untersucht. Die Untersuchung der neuronalen Kontrolle von adaptivem Laufverhalten kann helfen generelle Aussagen über die Funktion von Nervensystemen zu erlangen. In dieser Dissertation wurde anhand der Stabheu- schreckenarten Carausius morosus und Cuniculina impigra untersucht, wie ver- schiedene Ebenen des motorischen Netzwerks der Laufkontrolle zur Generation verschiedener Laufrichtungen und Laufgeschwindigkeiten beitragen. Um herauszu- finden, welche Parameter verändert werden müssen um verschiedene Verhaltens- weisen zu generieren wurden Muskel-, Motorneuron- und Interneuronableitungen durchgeführt.
Im ersten Teil der Arbeit wurde die Beinmuskelaktivität während Vorwärts-, Rückwärts- und Kurvenlaufen in einem Glitschplattensetup untersucht. In diesem Versuchsauf- bau ist das Tier stationär über einer glitschigen Oberfläche gehaltert und alle Beine können sich frei bewegen. Der Hauptunterschied in der Muskelaktivität zwischen den verschiedenen Laufrichtungen wurde in den Protractor- und Retractormuskeln gefunden, die das Bein in anteriore, bzw. posteriore Richtung bewegen. Ihre Aktivi- tät während des Schrittzykluses wurde mit Änderung der Laufrichtung annähernd umgekehrt. Bei dem in der Kurveninnenseite laufenden Bein treten Zwischenfor- men in der Protractor- und Retractoraktivität auf.
Weiterhin wurde in einem Einbeinpräparat, in dem nur ein Bein in der vertikalen Ebene Schrittbewegungen auf einem Laufband ausüben kann, Beinmotorneurone und prämotorische nichtspikende Interneurone intrazellulär abgeleitet. In dieser Präparation kann fiktives Vor- und Rückwärtslaufen zuverlässig ausgelöst werden.
Es ist bereits bekannt, dass Beinmotorneurone während des Laufens tonisch de- polarisiert werden und zusätzlich phasische erregende und hemmende Einflüsse von Beinsinnesorganen, sowie hemmende Einflüsse von dem Rhythmus generie- rendem Netzwerk erhalten. In dieser Arbeit konnte gezeigt werden, dass diese synaptischen Eingänge auch der Motorneuronaktivität während des Rückwärts-
rend der beiden Laufrichtungen besteht, wie bei den Muskeln, in der Phasenum- kehr der Protractor- und Retractoraktivität. Weiterhin ist bereits bekannt, dass die Laufgeschwindigkeit auf dem Laufband von der Aktivität der Flexormotor- neurone (in der Stemmphase), aber nicht von der Aktivität der Extensormotor- neurone (in der Schwingphase) abhängig ist. Dies konnte in meinen Untersuchun- gen bestätigt werden, jedoch wurde kein Zusammenhang zwischen der Aktivität anderer Stemmphasenmotorneurone und der Laufgeschwindigkeit gefunden. Um mehr über die synaptischen Eingänge der Motorneurone für die Generierung ver- schiedener Laufrichtungen und Laufgeschwindigkeiten herauszufinden, wurden die prämotorischen nichtspikenden Interneurone in derselben Präparation untersucht.
Diese lokalen Neurone erhalten ihrerseits synaptische Eingänge von absteigenden Neuronen, Beinsinnesorganen und dem Rhythmus generierendem Netzwerk, inte- grieren diese und tragen somit zur Kontrolle der Magnitude und zeitlichen Ko- ordinierung des motorischen Ausgangs bei. Bereits beschriebene Nichtspiker (E3, E4, E5, E7, I1, I2), sowie neu identifizierte nichtspikende Interneurone, die Ein- fluss auf Motorneurone aller Beingelenke ausüben, wurden während Vorwärts- und Rückwärtslaufen untersucht. Dabei konnten Neurone identifiziert werden, die zu der unterschiedlichen Ansteuerung der Protraktor- und Retraktormotorneurone während der verschiedenen Laufrichtungen beitragen. Außerdem konnte gezeigt werden, dass alle abgeleiteten Interneurone während beider Laufrichtungen zur Kontrolle der Beinbewegung beitragen. Dies lässt vermuten, dass das selbe prä- motorische Netzwerk an der Generierung beider Laufrichtungen beteiligt ist. Der Aktivität der nichtspikenden Interneurone unterliegen ebenfalls tonische und pha- sische synaptische Eingänge. Außerdem wurde die Beteiligung der nichtspikenden Interneurone an der Kontrolle der Laufgeschwindigkeit untersucht.
Summary 4
Abbreviations 1
1 Introduction 2
2 Methods 10
2.1 Leg muscle recordings from animals walking on a slippery surface . 10 2.2 Single leg preparation . . . 15
3 Results 19
3.1 Activity patterns and timing of muscle activity in forward, back- ward, and curve walking animals on a slippery surface . . . 19 3.1.1 Kinematics of straight forward vs. backward walking in the
middle leg . . . 19 3.1.2 Stance duration alone determines cycle period . . . 21 3.1.3 Phasing of leg muscle activity during forward, backward,
and curve walking . . . 23 3.1.4 Latency of muscle timing during forward, backward, and
curve walking . . . 31 3.1.5 Muscle activity in reduced preparations . . . 36 3.1.6 Depressor muscle activity depends on animal height . . . . 38 3.2 Patterning of leg motoneuron activity during single-leg forward and
backward stepping on a treadwheel . . . 40 3.2.1 Synaptic drive to motoneurons . . . 40 3.2.2 Velocity dependence of motoneuron activity during forward
and backward walking . . . 52 3.3 Patterning of premotor nonspiking interneuron activity during single-
leg forward and backward stepping on a treadwheel . . . 59 3.3.1 Nonspiking interneurons influencing the thorax-coxa joint . . 59 3.3.2 Nonspiking interneurons influencing the coxa-trochanter joint 68
3.3.4 Nonspiking interneurons influencing multiple leg joints . . . 85
4 Discussion 92
4.1 Leg muscle activity during walking on a slippery surface . . . 92 4.2 Patterning of motoneuron and interneuron activity during single-leg
stepping on a treadwheel . . . 101 4.2.1 Synaptic inputs to MNs . . . 101 4.2.2 Velocity dependence of MN and NSI activity in the single-leg
preparation . . . 104 4.2.3 Premotor nonspiking interneurons . . . 107
Bibliography 120
List of Figures 136
List of Tables 138
Curriculum vitae 140
Publications 140
Danksagung 142
Acknowledgments 143
CTr coxa-trochanter
CPG central pattern generator EMG electromyogram
fCO femoral chordotonal organ fCS femoral campaniform sensilla FTi femur-tibia
MN motoneuron
MP membrane potential NSI nonspiking interneuron RMP resting membrane potential ThC thorax-coxa
trCS trochanteral campaniform sensilla
Locomotion is one of the most important behaviors an animal can perform. Many different forms of locomotion exist, such as walking, swimming, flying, and crawl- ing. Locomotion has to be very finely tuned to optimally adapt the behavior of the animal to the environmental needs. As a consequence, animals do not con- stantly perform straight walks, but also walk in curves, climb or are tunneling under objects. Therefore, it is a challenge to find out how the great adaptability is generated by the nervous system, which will also help to a better understanding about the general function of nervous systems. Despite considerable work devoted to understanding how behavioral plasticity arises (humans: van Deursen et al., 1998; Lamb and Yang, 2000; salamander: Ashley-Ross and Lauder, 1997; fish:
Orger et al., 2008; lamprey: Islam et al., 2006; fruit fly: Frye and Dickinson, 2001, 2004; cockroach: Watson et al., 2002b,a; stick insect: Dürr and Ebeling, 2005; Gruhn et al., 2009a,b), the underlying mechanisms on the neuronal level are only at the advent of understanding (Schaefer and Ritzmann, 2001; Ridgel and Ritzmann, 2005; Pick and Strauss, 2005; Ridgel et al., 2007; Akay et al., 2007).
Most terrestrial animals locomote using legs. Not only the movement of one leg with its many joints has to be coordinated, but also the activity of the different legs with regard to each other. This results in different gaits. Quadrupedal animals change their gaits depending on the walking speed (Alexander, 1989). Insects use tetrapod and tripod gaits, and a multitude of intermediate forms, depending on the species, the developmental stage of the animal, and the walking speed (Hughes, 1952; Graham, 1985; Cruse, 1990; Grabowska et al., 2012; Wosnitza et al., 2013).
All forms of locomotion underlies a coordinated, rhythmic contraction of antago- nistic muscles (Orlovsky et al., 1999). In vertebrates, the motor command centers in the brain, motor cortex, basal ganglia, and cerebellum, transmit signals via the brainstem to the spinal cord, in which local circuits, called central pattern gen- erators (CPGs), are responsible for the coordinated motor output of the muscles (e.g. Grillner et al. 1995; Grillner 2003; Kiehn 2006). Also in insects, it is known that the brain and especially the central complex is responsible for higher loco-
motor function (Strauss, 2002), whereas the ventral nerve chord, which contains the rhythm generating networks, is responsible for the coordinated motor output of single legs and single leg joints (Bässler and Büschges, 1998).
Especially in insects, the neuronal control of walking has been investigated to some extent down to the single cell level. In the indian stick insect Carausius morosus and the closely related species Cuniculina impigra, detailed knowledge exists about the neuronal control of locomotion (reviews in Bässler and Büschges, 1998; Büschges, 2005; Büschges et al., 2008; Büschges and Gruhn, 2008). Further- more, substantial information is available about leg kinematics during adaptive locomotor behaviors, such as different walking directions, turning, and gap climb- ing (Cruse, 1976a; Jander, 1982; Blaesing and Cruse, 2004; Dürr and Ebeling, 2005; Gruhn et al., 2009b; Cruse et al., 2009). In the stick insect, three main leg joints move the leg. In the thorax-coxa (ThC) joint, the protractor coxae moves the leg anteriorly and the retractor coxae posteriorly. The coxa-trochanter joint (CTr) lifts the leg using the levator trochanteris and depresses it by the depressor trochanteris. The extensor tibiae extends the tibia, while the flexor tibia bends the tibia around the femur-tibia (FTi) joint. The step cycle of a leg is divided into two phases. During forward walking, the leg is lifted and extended while moving in anterior direction in the swing phase. In the stance phase, in which propulsive force is generated to push the animal in the walking direction, the leg is depressed, flexed and moved backwards. This is the case for the forward walking front and middle legs of the stick insect, the movement kinematics of the hind legs differ from that to some extent (e.g. see Cruse and Bartling, 1995).
To achieve this coordinated movement, the muscles have to be activated in the right order and at the right time. In addition to the neuronal control of muscle activity, intrinsic muscle properties also play an important role in the generation of the movement (Guschlbauer et al., 2007; Hooper et al., 2007b,a, 2009). Each muscle is innervated by a set of motoneurons (MNs), three MNs innervate the extensor tibiae muscle and up to 25 the flexor tibia muscle (Goldammer et al., 2012). Descending signals from the brain and intersegmental signals from other legs lead to a general excitation of the leg MNs. The rhythm generating network, the central pattern generators, are responsible for the rhythmical activation of the leg MNs. Sensory signals from the legs, which measure load, strain, and posture, arrange the appropriate timing of the motor output (reviews in Bässler and Büschges, 1998; Ritzmann and Büschges, 2007; Büschges and Gruhn, 2008). In the following, these sources of input to the leg muscle control system are described in more detail.
Tonic descending drive The tonic background excitation in insect leg MNs is thought to derive from descending inputs (Ridgel and Ritzmann, 2005), similar to the glutamatergic excitation of spinal motoneurons in vertebrates descending from the brainstem (Roberts et al., 2008). The function of the tonic depolarization is to increase the membrane potential of the leg motoneurons for a higher responsiveness to further depolarizing inputs during walking. Previous studies showed that the tonic depolarization increases the membrane potential of leg motoneurons by up to 5 mV. It has a reversal potential in the range of -47 to -32 mV, which suggests that a mixed Na+/K+-ion current underlies its activation. This is mediated by metabotropic acetylcholine receptors in the leg motoneurons (Ludwar et al., 2005b;
Westmark et al., 2009). Furthermore, the tonic depolarization is influenced by the neuromodulator octopamine. Thus, also neuromodulatory DUM (dorsal unpaired median) neurons, which release octopamine, might be involved in the generation of the tonic depolarization (Bräunig and Pflüger, 2001). It has also been shown that different leg motoneurons have different resting membrane potentials. For example, fast flexor MNs have a more negative resting potential than slow flexor MNs (Gabriel et al., 2003). Thus, when the flexor muscle has to be activated, the slow MNs first reach their firing threshold which is sufficient for slow movements, and only a stronger excitation brings the fast flexor MNs above the threshold to fire action potentials.
Central pattern generators The central pattern generating network in the tho- racic ganglia of the stick insect provides inhibitory synaptic input to leg MNs.
This has been studied in a preparation in which all legs of the insect were re- moved and the motor system of the stick insect was activated (Büschges et al., 2004). The central pattern generating circuit has not yet been identified in the stick insect, though some premotor nonspiking interneurons may contribute to its function (Büschges, 1995). In other invertebrates, cells have been identified the CPG is composed of (stomatogastric nervous system of crabs and lobsters (STG, Marder and Bucher, 2007); locust flight (Robertson and Pearson, 1985); swim- meret system of the crayfish (Mulloney and Smarandache-Wellmann, 2012); leech heartbeat (Kristan et al., 2005); sea slug Tritonia escape swimming (Getting et al., 1980)). Furthermore, in some vertebrates, although the CPG is not identified on the single cell level, a comprehensive overview about the rhythmic generation of locomotor output exists: lamprey swimming (Grillner et al., 1995; Grillner, 2003);
frog tadpole swimming (Roberts et al., 1998); rodent walking (Kiehn, 2006); cat walking (Grillner and Zangger, 1979). A central pattern generating network can exert its drive by different mechanisms (Marder and Calabrese, 1996; Marder and Bucher, 2001; Goulding, 2009). Neurons, that are part of a CPG circuit, can show
rhythmicity because of their intrinsic membrane properties, such as endogenous bursting, postinhibitory rebound, spike frequency adaptation, or plateau poten- tials. The characteristics of a CPG network depend on such intrinsic properties of the neurons it is composed of and the synaptic interactions among them. Networks can either be pacemaker driven, like in the pyloric system of the STG (Marder and Eisen, 1984), or depend on reciprocal inhibition between CPG neurons (half-center oscillator) like in the spinal cord of the lamprey (Grillner, 1999). Furthermore, the output of such a network strongly depends on the action of neuromodulators, which change the intrinsic properties of neurons (Nusbaum et al., 2001). Some be- haviors underlie the action of the same groups of muscles. In such cases it is also interesting to know if they share the same pattern generating network with dif- ferent output properties, if one CPG for a certain behavior exists, or if CPGs are reconfigured in a task-dependent manner (Marder and Calabrese, 1996; Marder and Bucher, 2001; Goulding, 2009; Jing et al., 2011). In some systems, fictive rhythmicity can be induced in the isolated nerve cord, which largely resembles the one observed in the intact animal (like in the STG, Marder and Bucher, 2007).
In other systems, only some aspects of the rhythm generation can be observed by pharmacologically activating the responsible network. Büschges et al. (1995) could show, that the thoracic nervous system of the stick insect becomes rhythmically active when activated with the muscarinic acetylcholine agonist pilocarpine. In that case, motoneurons are rhythmically bursting, though not in a manner that resembles fictive walking. However, the activity of antagonistic motoneuron pools show alternation, which led to the assumption that each leg joint in the stick insect is controlled by its own rhythm generating network (Büschges et al., 1995).
Afferent signals from leg sens organs The third source of synaptic inputs to leg MNs are sensory signals. Many studies investigated the effect of leg sense organs on the activation and inhibition of different motoneuron pools (reviewed in Büschges and Gruhn, 2008). All connections from mechanosensory neurons to central neurons are excitatory, whereas inhibitory effects are caused by intercalated interneurons which reverse the sign of the sensory output. Both spiking as well as nonspiking interneurons have receptive fields consisting of inputs from several leg mechanosensory signals and thus are processed in parallel (Burrows, 1996). One example is the femoral chordotonal organ (fCO) in the femur of the stick insect leg, which measures movements in the femur-tibia joint. In the quiescent animal, a leg flexion leads to a so called resistance reflex which activates extensor MNs and inhibits flexor activity. However, in the active animal, a leg flexion generates a so called reflex reversal (or active reaction) which further flexes the leg and inhibits extensor activity. Such a reinforcement of movement is thought to be an important
part of the control regime for the generation of single leg stepping (reviewed in Bässler, 1993). Recently, it was shown that this reflex is altered in the behavioral context of the leg during different walking directions (Hellekes et al., 2012). The fCO is also involved in inter-joint control, such that when it measures a leg flexion in the active animal, levator MNs are activated and depressor MNs are inhibited, and vice versa during an extension of the leg (Hess and Büschges, 1999). Other leg sense organs, like campaniform sensilla (CS) and hair plates (HP) have also been investigated and their roles in intra- and interleg joint coordination has been shown (e.g. CS: Akay et al., 2004, 2007; Zill et al., 2012; HP: Schmitz, 1986b;
Büschges and Schmitz, 1991; Dean and Schmitz, 1992).
Premotor nonspiking interneurons The majority of these sources of synaptic inputs to leg MNs is not based on monosynaptical connections, but rather is submitted via intercalated premotor nonspiking interneurons. First recordings of nonspiking interneurons (NSIs) in insects were performed by Pearson and Fourt- ner (1975), after these local interneurons were found in other invertebrates and were shown to be involved in the pattern generation of small circuits (Mendel- son, 1971). Since then, NSIs were thoroughly investigated, especially in the locust (Wilson and Phillips, 1983; Siegler, 1985; Burrows, 1996). NSIs integrate signals from the aforementioned sources and thus contribute to the control of timing and magnitude of the motor output. They receive excitatory signals from leg sense organs, inhibitory and excitatory inputs from spiking interneurons (inhibitory:
midline spiking interneurons; excitatory: antero-medial spiking interneurons), and inhibitory inputs from other nonspiking interneurons (Burrows, 1979, 1996). Indi- vidual NSIs can also respond differentially to signals from the same sense organs (Büschges, 1990). Thus, there exist parallel, antagonistic pathways from leg sense organs via intercalated interneurons to the leg motoneurons (Bässler, 1993). All investigated NSIs have chemical synapses. However, not much is known about the transmitters involved in their action. Certainly, GABA is an important transmit- ter released by NSIs (Wildman et al., 2002). One big advantage of the nonspiking cells is that they gradually release transmitter and therefore are able to very finely control their action on MNs (Burrows and Siegler, 1978). Some NSIs are also known to tonically release transmitter which permanently affects the membrane potential of postsynaptic motoneurons (Wilson and Phillips, 1982). NSIs make output connections with motoneurons, other nonspiking interneurons, and with intersegmental interneurons. Particularly for the stick insect, NSIs involved in the control of the femur-tibia leg joint control system have been investigated to some extent (Büschges, 1990; Driesang and Büschges, 1993; Büschges et al., 1994; Sauer et al., 1996), also during walking (von Uckermann and Büschges, 2009). Interneu-
ron E4 provides excitatory synaptic drive to extensor, levator, protractor, and common inhibitor1 MNs, and inhibitory synaptic drive to retractor and depressor MNs. NSI I4 provides excitatory synaptic drive to depressor and flexor MNs and inhibitory synaptic drive to extensor MNs. These two NSIs were shown to be related to the rhythm generating network of the femur-tibia and coxa-trochanter leg-joint control system (Büschges, 1995).
Neuronal control of walking direction and walking speed Now the question arises, which parameters in the previously described leg control system have to be changed to generate adaptive forms of locomotion. How the direction of walking is changed was investigated in vertebrates (Buford et al., 1990; Buford and Smith, 1990; Islam et al., 2006; Zelenin, 2011; Zelenin et al., 2011; Musienko et al., 2012) and invertebrates. In insects, backward and curve walking was investigated in several studies concerning the kinematics (Dürr and Ebeling, 2005; Gruhn et al., 2009b), the muscle activity (Graham and Epstein, 1985; Mu and Ritzmann, 2005), the involvement of sense organs (Akay et al., 2007; Mu and Ritzmann, 2008b;
Hellekes et al., 2012), and the descending control (Guo and Ritzmann, 2013). Fur- thermore, neuromechanical models exist in which changes in the neuronal network have been proposed which account for the change in walking direction (Toth et al., 2012; Knops et al., 2012).
The speed of locomotion in animals can be changed by different mechanisms.
During swimming in the lamprey, increased tonic drive of reticulospinal neurons to spinal CPG interneurons increases the swimming frequency (Grillner et al., 1995). Also in the zebrafish and the Xenopus tadpole, studies dealt with the change in locomotion speed (McLean et al., 2008; Li and Moult, 2012). Stick insects increase their walking speed by decreasing the cycle period. Whereas the duration of the swing phase is similar during different walking speeds, the duration of the stance phase is decreased with increasing walking speed (Wendler, 1964).
This has been studied at the level of the leg motoneurons. It was shown that the activity of the flexor MNs, which are active in the stance phase of the step cycle, is correlated with walking speed, whereas extensor MNs, which are active in swing, do not show such a change (Gabriel and Büschges, 2007). Furthermore, no intersegmental influences concerning the velocity of stepping front legs have been found to influence the activity of MNs in the deafferented middle leg (Gruhn et al., 2009a).
Experimental approaches The advantage of using the stick insect species Ca- rausius morosus andCuniculina impigra is their easy stock keeping and breeding,
and their relatively large size for an insect. This makes semi-intact preparations possible, in which one to six legs are able to walk, while muscle and nerve activity or single cells can be recorded. Compared to other well investigated insects like locusts, there is no wing musculature, which makes the thoracic ganglia easier to access for intracellular recordings.
Many different approaches have been used to investigate the neuronal circuits un- derlying locomotion in the stick insect. Experiments on the slippery surface have the advantage that the animal is able to freely move its legs while it is station- ary above a slippery substrate. The legs are not mechanically coupled via the substrate which can be of advantage for some questions. Walking can be elicited using an optomotor stimulus, which can also induce curve walking (Gruhn et al., 2006). The slippery surface has been used to study escape responses (Camhi and Nolen, 1981), turning (Tryba and Ritzmann, 2000a,b; Gruhn et al., 2009b), back- ward walking (Graham and Epstein, 1985), and changes in velocity (Gruhn et al., 2009a). It also allows easy combination of intra- and extracellular recordings with kinematical analyses (Hellekes et al., 2012). The electronic measurement of tarsus ground contact on the slippery surface allows a precise measurement of step phase transitions during different walking situations and therefore an exact comparison with simultaneously recorded muscle and motoneuron activity, respectively (Gruhn et al., 2006).
The single leg-preparation allows to study the control of a single-leg without inter- segmental influences from other legs. It also offers the opportunity to record intra- cellularly from the thoracic ganglia (Schmidt et al., 2001; Gabriel and Büschges, 2007; von Uckermann and Büschges, 2009; Berg et al., 2013). Stepping is possible on a passive, low-friction treadwheel, whereas in most cases the thorax-coxa joint is fixed and thus only leg movement in the vertical plane is possible (Fischer et al., 2001; Gabriel et al., 2003; von Uckermann and Büschges, 2009).
This thesis In this thesis, the focus lies on gaining more insights into the neural control of adaptive locomotor behaviors. This was investigated on the level of the muscles, motoneurons, and premotor nonspiking interneurons. Their activity was compared between forward and backward walking, as well as between different stepping velocities.
In the first part of this thesis, muscle recordings from the six main leg muscles were performed while the animal was walking forward, in a curve, and backward on a slippery surface. The muscle activity of each muscle was compared during these different behaviors and their exact timing with regard to the transition phases of the step cycle was determined. Data was evaluated for intact animals as well as
for reduced preparations, i.e. animals with only one or two legs.
In the second and third part of this thesis, intracellular recordings of leg muscle motoneurons and premotoric nonspiking interneurons during forward and back- ward walking were performed to gain a better understanding of local neuronal network activity during different behaviors. These experiments were performed in the single-leg preparation. Synaptic inputs to leg motoneurons were compared be- tween the different walking directions, and also if MN activity and stepping velocity on the treadwheel were related. Previously described nonspiking interneurons, as well as newly described interneurons were recorded and their activity during for- ward and backward walking, and between different stepping speeds was compared.
Stainings of local interneurons helped to identify previously described NSIs and to describe newly identified NSIs.
2.1 Leg muscle recordings from animals walking on a slippery surface
1Animals All experiments were performed on adult female stick insects (Carau- sius morosus). Animals were reared in the animal facility of the institute in a 12/12h light/dark cycle at 20-22°C and were fed with blackberry leaves (Rubus fructiosus) ad libitum.
Experimental setup In all experiments, animals walked on a 13.5 cm x 13.5 cm polished nickel-coated brass plate divided into two halves. In order to allow unimpeded walking under tethered conditions and remove mechanical coupling between the legs, the plate was covered with a lubricant composed of 95% glycerin, 5% saturated NaCl, and a small amount of electrode cream (Marquette Hellige, Freiburg, Germany). This created both a slippery surface and allowed recording of tarsal contact by electric current flow during ground contact (Gruhn et al., 2006). The animal was glued ventral side down on an 80 mm long and 3 mm wide balsa rod using dental cement (ProTempII, ESPE, Seefeld, Germany) so the legs and head protruded from the rod and all joints were unrestrained. Animal height above the substrate was adjustable, but was typically 10 mm. Experiments were performed in a darkened Faraday cage at room temperature.
Walking was elicited by projecting a progressive striped pattern (pattern wave length 21°) onto two 13.5 cm diameter round glass screens (Scharstein, 1989)
1The methods section for leg muscle recordings from animals walking on a slippery surface is already published: Rosenbaum P, Wosnitza A, Büschges A and Gruhn M. Activity Patterns and Timing of Muscle Activity in the Forward Walking and Backward Walking Stick Insect Carausius morosus. Journal of Neurophysiology 104: 1681-1695, 2010. The authors contri- butions for the paper are as followed: AB, MG, PR, and AW designed research; PR and AW performed experiments, analyzed data and prepared figures; AB, MG, PR, AW wrote the manuscript. Therefore this section is, except for minor modifications, literally taken from the paper. Descriptions for curve walking experiments were added in the appropriate sections.
placed at right angles to each other and at a 45°angle to the walking surface, approximately 6-7 cm away from the eyes of the animal. Reflections on the pol- ished brass plate further increased the field of view. Alternatively, a single white stripe on dark background (towards which the animals orient with straight walk- ing sequences) was placed in front of the animal. If the animal did not begin locomotion spontaneously, walking was elicited by light brush strokes to the ab- domen. Backward walking was elicited by gentle pulls on the antennae (Graham and Epstein, 1985). Curved walking was elicited by moving the stripe on both glass screens in the same direction (Gruhn et al., 2011).
Electrophysiology Muscle activity (electromyogram, EMG) was recorded using two twisted, coated copper wires (57 µm or 49 µm outer diameter) cut at the tip, placed in each muscle approximately 1 mm apart and held in place with dental cement (ProTempII, ESPE) or tissue adhesive (3M Vetbond, St.Paul, MN, USA). Fig. 2.1A shows the approximate sites for the EMG wire placement in the cuticle of the leg and thorax. All recordings were differentially amplified. The EMG signal was amplified 1000 fold (preamplifier MA101 and amplifier MA102, electronics workshop, Zoological Institute, Cologne), band-pass filtered (100Hz- 2000Hz) and imported into Spike2 (Version 5.05, CED, Cambridge, UK) through an AD converter (Micro 1401 II, CED, Cambridge, UK). A reference electrode was placed in the abdomen of the stick insect.
In most experiments, two antagonistic joint muscles were recorded simultaneously.
Protractor coxae and retractor coxae EMGs were recorded in the thorax, depressor trochanteris and levator trochanteris in the coxa, and extensor tibiae and flexor tibiae in the femur.
Recording tarsal contact To determine the exact moment of the switch between stance and swing we used middle leg tarsal contact as a switch to open and close an electric circuit (Gruhn et al., 2006). Briefly, we used a 2-4 nA amplitude square wave signal generated with a pulse generator (Model MS501, electronics workshop, Zoological Institute, Cologne) applied to one half of the slippery surface and to a lock-in amplifier (electronics workshop, Zoological Institute, Cologne) as a reference signal. We tied a copper wire (49 µm outer diameter) with its insulation removed at the tip around the tibia of the leg being monitored, and connected it to the lock-in amplifier. The resistance between the cuticle and copper wire was reduced with a drop of electrode cream (Marquette Hellige, Freiburg, Germany) placed at the area of contact, allowing a 2-4 nA current to pass through tarsus and tibia. During stance, current flowed from the plate through tarsus and tibia
Figure 2.1 – A: drawing of the stick insect middle leg and the adjacent mesotho- rax with the approximate placement sites for the EMG electrodes for recordings of the main leg muscles. Pro, protractor coxae; Ret, retractor coxae; Ext, extensor tibiae; Flx, flexor tibiae; Lev, levator trochanteris; Dep, depressor trochanteris. B:
schematic of the stick insect with the points tracked. X-values are always points along the length of the animal, while y-values mark points perpendicular to the animal. The x 0 value was set at the level of the middle leg coxa to give a clear reference point. As an example for the determination of the step length vector and its direction, the right middle leg is drawn at two arbitrary positions, one anterior extreme position (ML-AEP) and one posterior extreme position (ML-PEP). The vectors for all steps connecting the two positions, normalized to the origin in the AEP, gave direction in ° and step length in mm. The 0°-180° axis was always par- allel to the body axis and crossed the AEP, 90° always points towards the animal perpendicularly.
into the copper wire, but during swing, when the leg was in the air, the circuit was disconnected. Amplifier output was fed into the AD converter and recorded using Spike2.
Due to the low-pass filter properties of the lock-in amplifier and the gradual lift- off/touch down of the tarsus, the signal is not exactly square. We therefore used thresholds set close to the transition point to define the timing of tarsal contact and manually checked each event. Touch downs could be determined at a resolution of less than 1 ms. Lift-off transitions were less steep and more delayed because of delayed tearing of the lubricant from the tarsus due to a capillary action and occasional upward movements of the leg during stance without complete lift-off.
To have comparable lift-off times in all experiments we therefore always defined lift-off as the time point at the beginning of the steepest ascending slope.
Video recording and digital analysis of leg movements Video recordings of forward and backward walking were performed and analyzed as in Gruhn et al.
(2009b). In brief, we recorded walking sequences with a high speed video cam- era (Marlin F-033C, Allied Visions Technologies, Germany) that was externally triggered at 100 fps. Insect head, thorax, and legs were marked with fluorescent pigments (Dr. Kremer Farbmühle, Aichstetten, Germany) mixed with dental ce- ment. During the recording of walking sequences, the animal was illuminated with blue LED arrays (12 V AC/DC, Conrad Electronics, Germany). The video files were analyzed using motion tracking software (WINanalyze 1.9, Mikromak Ser- vice, Berlin, Germany). AEP describes the anterior extreme position of the leg at touch down, while PEP is the posterior extreme position at lift-off. In forward stepping AEP in stance is anterior to PEP, whereas in backward stepping AEP in stance is posterior to PEP. AEP and PEP values are always given in millimeters in the form xx.x; yy.y (s.d. x ; s.d. y ). X-values are given with respect to the length of the animal, a virtual zero line being drawn across the animal at the level of the coxa. Positive and negative x-values indicate points anterior and posterior to the coxa, respectively. Y-values are given with respect to the axis perpendicular to the length of the animal. Larger y-values denote more distal points, smaller values more central points. Fig. 2.1B shows a schematic drawing of the stick insect with the points tracked. As an example for the step length vector determination and its direction, the right middle leg is drawn at two fictive positions, one anterior (ML-AEP) and one posterior (ML-PEP). The vectors for all steps connecting the two positions, normalized to the origin in the AEP, gave direction in ° and step length in mm. The 0°-180° axis was always parallel to the body axis and crossed the AEP, 90° always points inside perpendicularly. The simultaneous recordings of the EMG trace and the camera trigger and tarsal contact signals allowed frame by
frame correlation of filmed movement and EMG and tarsal contact traces. In cal- culating middle leg movement vectors all steps were transposed to reflect walking as a right leg regardless of which leg was being recorded from.
Data analysis and figure preparation Leg positions were measured with their x and y coordinates. Care was taken to choose animals of the same size and leg lengths. The number of animals used for a given condition (N) and the number of steps evaluated (n) are given in the figures. The sample size for the kinematics analysis of straight forward walks was N=5 (n=125), for backward walks N=3 (n=83).
Cycle period was calculated from touch down to touch down as determined from the tarsal contact trace. For comparisons of EMG activity of the six different mus- cles between intact forward, backward, and curve walking and between intact and reduced forward stepping preparations, EMG traces were rectified and smoothed (τ = 50 ms) and each single data point of each step was exported in Excel (Mi- crosoft Corp., Seattle, USA) to allow averaging. In each step the minimum muscle activity was set to zero and the maximum to one. In several cases, weak crosstalk from the antagonist muscle was removed mathematically using the EMG trace from the antagonist: the activity of the EMG in the antagonist was triggered to the same point in time than the EMG in the agonist (i.e. lift-off or touch down of the tarsal contact trace, common for both EMGs), and exported in the same way as above. Then its minimum activity was set to 0, but its maximum to an value of 0.5, due to the smaller size of the antagonist signal in the agonist EMG.
The normalized activity of the antagonistic muscle was then subtracted from the corresponding value of the muscle under investigation.
First spike latencies with respect to lift-off or touch down were calculated relative to the tarsal contact signal (see above). The absolute latency was then normalized with respect to the corresponding step cycle and averaged for the plot in Fig. 4.1C.
Average swing/stance phase duration was calculated from each evaluated step from lift-off to touch down for swing and from touch down to lift-off for stance.
All angles were analyzed using the Watson-Williams test, the circular analogue of the two sample t-test (Matlab, circular statistics toolbox; Berens (2009)). Circular variance of vector angles was tested using the variance test in the same toolbox (Matlab, circular statistics toolbox; Berens, 2009). For all other statistical analy- ses, a non-parametric Wilcoxon-(U-) test (Matlab, Statistics toolbox; Mathworks, Inc., Natic MA, USA) was used, except for the comparison of integrals of depressor activity, where a standard student’s t-test was used. Statistical significance was assumed at p-values <0.01. Figures were prepared in Origin 6.1 (Origin Lab Corp.,
Northampton, MA, USA) and Photoshop 6.0 (Adobe Systems Inc., San Jose, CA, USA).
2.2 Single leg preparation
To investigate the activity of leg motoneurons and premotor nonspiking interneu- rons during forward and backward walking in the mesothoracic ganglion, a single- leg preparation was used to allow stable intracellular recordings with sharp micro- electrodes. For these experiments, related stick insects of the species Cuniculina impigra were taken, also provided by the breeding colony from the University of Cologne.
Preparation and experimental setup The single-leg preparation was firstly in- troduced by Bässler (1993) and improved and used in various subsequent studies (Fischer et al., 2001; Schmidt et al., 2001; Gabriel and Büschges, 2007; von Ucker- mann and Büschges, 2009). All legs of the animal except the left middle leg were cut at mid-coxa level and the animal was glued ventral side down on a venerit platform with dental cement (Pro TempII, ESPE, Seefeld, Germany). The ani- mal was opened with a cut along the dorsal midline. Gut, minor trachea and fat tissue were removed in order to expose the mesothoracic ganglion. Throughout the experiment the thorax body cavity was filled with saline (pH=7.2, according to Weidler and Diecke, 1969). Protractor and retractor coxae muscles were cut at their ventral thorax insertion and the thorax-coxa joint was fixed with dental cement to allow only movements in the vertical plane. Stepping was allowed on a custom made, passive treadwheel composed of two styrofoam drums with 40 mm diameter and a center distance of 50 mm, connected via a belt of crepe paper. The two drums are each mounted on a micro DC-motor (DC 1516, Faulhaber, Schö- naich, Germany) of which one measured the belt velocity and the other supported the belt movement to give a low friction (for details cf. Gabriel et al., 2003). The treadwheel height was adjusted below the middle leg of the stick insect, so that the femur of the leg was parallel to the belt when the femur-tibia joint angle was about 90°. Forward walking was elicited by gently touching the abdomen of the animal with a brush, backward walking by pulling on the antennae or stimulating the head/prothorax region with a soft brush.
Electrophysiology To monitor the walking direction, the protractor (nl2) and retractor (nl5) motor nerves were recorded extracellularly by placing the nerves on steel hooks of monopolar electrodes (modified after Schmitz et al., 1991c). The
Figure 2.2– Experimental setup of the single leg preparation. A: schematic view of the preparation. The animal is glued to a platform, only the left middle leg is intact.
Stepping is possible in a vertical plane on the treadmill positioned below the leg.
The ganglion holder helds the ganglion in place, so stable intracellular recordings are possible. Nerves nl2 and nl5 are recorded extracellularly. An EMG is placed in the proximal femur to record flexor muscle activity. B: photography of the experimental setup described in A. Figure A modified after von Uckermann (2008).
nerves were then crushed distally to the recording sites to abolish afferent and efferent signaling. Additionally, flexor tibiae muscle activity was recorded by in- serting two twisted copper wires (49µm diameter) into holes in the cuticle of the ventral portion of the proximal femur, fixed with dental cement (electromyogram, EMG). Extracellular nerve and EMG signals were amplified 1000fold and low-pass filtered (preamplifier MA101 and amplifier MA102, electronics workshop, Institute for Zoology, University of Cologne). Then, fat tissue surrounding the ganglion was removed and the ganglion was lifted on a steel ganglion holder, coated with wax, and positioned with a micromanipulator. To stabilize the ganglion, which was necessary to achieve long lasting intracellular recordings from the mesothoracic ganglion in the walking animal, the ganglion was fixated on the holder by placing cactus spines (Nopalea dejecta) through the left surrounding tissue. Before record- ing intracellularly from the dorsal hemiganglion ipsilateral to the attached leg, the ganglion surface was treated with a proteolytic enzyme (Pronase E, Merck, Germany) to ensure an easy electrode penetration. Sharp microelectrodes with a resistance of 15-25 MΩ were pulled using a Sutter Micropuller (P-1000, Sutter Instruments, Novato, CA, USA) and filled with 3M KAc/0.1M KCl. Signals were recorded in bridge mode (intracellular amplifier SEC-10L, npi electronics, Tamm, Germany). The setup is depicted in Fig. 2.2.
Intracellular stainings For experiments in which neurons were stained intracel- lularly, 5% Neurobiotin tracer (Vector Laboratories Inc, Burlingame, CA, USA) were added to the electrode solution. After injecting the tracer into the neurons with depolarizing current pulses (+1.5-2.5 nA, 400ms pulse duration, 1Hz) for 3-20 minutes, 30-45 minutes were allowed for tracer diffusion. Then the ganglion was re- moved from the animal and treated for 20 min with 4% paraformaldehyde (PFA) in 0.1 M phosphate-buffered saline (PBS) and 5% Triton X-100 (Fluka, Buchs, Switzerland) and then fixed for 2-14h in 4% PFA. After washing 3 times with PBS, ganglia were treated with the dye-coupled Neurobiotin antibody Streptavidin-Cy3 (1:500 in PBS, Sigma-Aldrich, St. Louis, MO, USA) with 0.5% Triton X and 2-4%
Normal Goat Serum (Vector Laboratories Inc, Burlingame, CA, USA) overnight on a shaker at 4ºC. After washing (3x15min in PBS) and an ascending Ethanol series (50%,70%,90%,2x100%; each 10min), the ganglia were mounted in methyl- salicylate on an object slide and scanned with a confocal Laser Scanning Micro- scope (LSM 510; Carl Zeiss, Jena, Germany).
Identification of motoneurons and nonspiking interneurons Motoneurons (MNs) and nonspiking-interneurons (NSIs) were recorded from their neuropilar arboriza- tions in the ganglion. Motoneurons were identified either by a 1:1 correlation of spikes in the intracellular recording and spikes in the extracellular recordings (for protractor, retractor, and flexor) or by an unambiguous movement response of the leg due to depolarizing current injection (extensor, depressor, and levator MNs). The output connections of NSIs were also identified by injecting current into the neuron and observing the response in the extracellular recordings or of a leg movement. Furthermore, the femoral chordotonal organ (fCO) of the mid- dle leg was stimulated passively while the leg was standing on the treadwheel. A movement of the belt towards the animal led to a passive flexion of the leg and therefore an elongation of the fCO, a movement away from the animal to a pas- sive extension/relaxation of the fCO. The responses in the membrane potential of the recorded NSIs were compared with those of previously described NSIs in- fluencing the femur-tibia joint (Büschges, 1990; Sauer et al., 1996). Responses to an fCO-stimulation were also recorded for the other joint NSIs but since it is not known if the responses are similarly stereotyped, this was no criterion to group undescribed NSIs. In this study, newly described NSIs were grouped according to their membrane potential modulation during walking. The physiology during single-leg stepping and the morphology of recorded neurons were also compared to previously described NSIs (Schmitz et al., 1991a; Brunn, 1998; Hess and Büschges, 1997; Büschges, 1990; Sauer et al., 1996; von Uckermann and Büschges, 2009).
Neurons were considered nonspiking fulfilling the following criteria: 1) no spikes
could be evoked due to stimulation of the abdomen or antennae to elicit forward or backward walking. 2) Injection of depolarizing current caused no action poten- tials nor could rebound spikes after a long injection of hyperpolarizing current be observed. 3) Stimulation of sense organs did not cause spiking of the neuron. For regulations identifying NSIs further see also Burrows and Siegler (1976); Heng- stenberg (1977); Burrows and Siegler (1978); Wilson (1981); Wilson and Phillips (1983); Büschges (1990). Every analyzed NSI in this work showed a clear, repro- ducible output on at least one pool of motoneurons, determined either by eliciting spikes in the extracellular recordings (protractor, retractor and flexor) or by an unambiguous movement response of the leg due to current injection (extensor, de- pressor and levator MNs). In this work, 60 recordings of MNs and 77 recordings of NSIs, of which 34 were stained, have been analyzed.
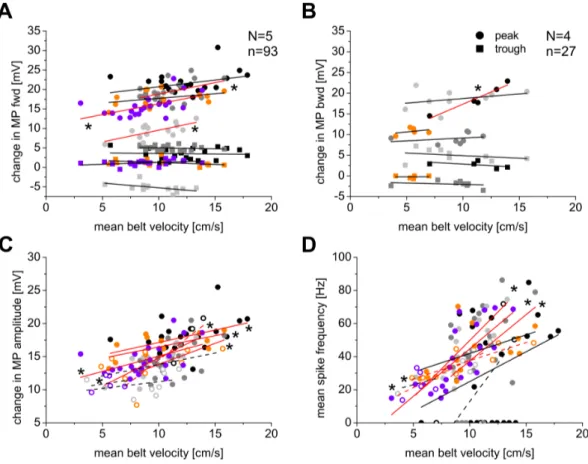
Data analysis Data was analyzed with Spike2 software using custom written scripts, Microsoft Excel 2007, and Origin 5.0. Figures were prepared with Corel DrawX4. For the statistical analysis of membrane potential and mean belt velocity regression, an ANOVA analysis, p<0.05, in Origin 5.0 was performed.
The mean belt velocity was determined by dividing the integral of the treadwheel trace below the ascending slope (stance phase) by the stance phase duration. By multiplying with a factor of 12.6 (treadwheel potential output x amplification x time / distance), the mean belt velocity was calculated.
Usually, the end of the stance phase was marked with events at the end of the ascending slope of the treadwheel trace. However, in some cases it was observed that at the end of stance the tarsus of the animal was clawed to the crepe paper of the treadwheel, and was pulling it towards the body. Only a few dozen milliseconds later it disengaged from the belt to start a new swing phase. In most of the cases this could be clearly traced either by an artifact in the treadwheel trace at the time point in which the tarsus disengaged and/or by the switch from retractor to protractor nerve activity during forward walking, resp. from protractor to retractor activity during backward walking, which happened just at the actual onset of swing. Steps in which the walking direction, i.e. the switching from retractor to protractor nerve activity or vice versa, could not be determined definitely were not taken into consideration.
N = number of animals, n = number of steps.
3.1 Activity patterns and timing of muscle activity in forward, backward, and curve walking animals on a slippery surface
1Understanding how animals adapt their motor behavior to changing environmental conditions requires measuring limb kinematics and muscle activity in different behaviors. It has been shown previously that stick insect leg kinematics differ in straight and curve walking and the effect of reducing leg number on these changes was examined (Gruhn et al., 2009b). Here, middle leg kinematics during forward and backward in intact animals are compared, and the muscle activity in these behaviors and during curve walking in the intact and reduced preparation was examined.
3.1.1 Kinematics of straight forward vs. backward walking in the middle leg
Fig. 3.1A shows a schematic drawing of the stick insect with marked anterior and posterior extreme positions (AEP and PEP plus standard deviation, SD) of the right middle leg in forward and backward straight walking. The data for forward walking (gray) were taken from Gruhn et al. (2009b). AEP is defined as tarsus position at touch down and PEP as tarsus position at lift-off, always with respect to the direction in which the animal moves. During forward walking (FW), the leg
1The results for forward and backward walking animals in this section are already published:
Rosenbaum P, Wosnitza A, Büschges A and Gruhn M.Activity Patterns and Timing of Muscle Activity in the Forward Walking and Backward Walking Stick Insect Carausius morosus.
Journal of Neurophysiology 104: 1681-1695, 2010. The authors contributions for the paper are as followed: AB, MG, PR, and AW designed research; PR and AW performed experiments, analyzed data and prepared figures; AB, MG, PR, AW wrote the manuscript. Therefore this section is, except for minor modifications, literally taken from the paper. Results from curve walking experiments are added in the appropriate sections.
Figure 3.1– Kinematics of a forward and backward walking stick insect middle leg on the slippery surface. A: schematic drawing of a stick insect with the mean anterior extreme position (AEP) and posterior extreme position (PEP) values (and SD error bars) of the right middle leg for forward (gray) and backward (black) walking. Note that for the backward walking animal the AEP is posterior to the PEP; the gray line marks the X0-value for the middle leg. B and C: step-to-step variability in angle and length of stance movement of forward (B) and backward (C) steps normalized to touch down position (AEP); the average stepping vector is drawn in black in both cases. D: average stepping vectors for forward (gray) and backward (black) walking from B and C; the average vector for forward walking from figure B was mirrored across the horizontal plane for easier comparison. N = animal number, n = step number.
is moved anteriorly during swing and posteriorly during stance. This order of leg movements is reversed during backward walking (BW). In backward walking each step’s AEP is therefore more caudal along the long axis of the animal than the PEP. Forward steps were significantly longer (mean step length FW: 16.2 ± 5.4 mm; BW: 9.9 ± 4.7 mm, p<0.0001) and their movement direction was on average more parallel to the body length axis than were backward steps (Fig. 3.1A). To compare movement vector angles, we mirror imaged the forward step movement angles in Fig. 3.1B along the horizontal axis. The resulting mean angles of forward (8.8 ± 17.3°, gray) and backward (36.1 ± 20.3°, black) steps are shown in Fig. 3.1D and differed significantly (p<0.0001) from each other. The variability between the movement vector angles of single steps is similar in both directions and spans angles over a range of 83° during forward walking and 88.5° during backward walking between the respective extremes. Mean touch down position along the transverse axis was significantly closer to the midline in forward versus backward walking (y-positions: AEPFW 16.9 ± 3.3 mm; AEPBW 19.6 ± 2.9 mm, p<0.0001), but mean lift-off position was not significantly different (y-positions: PEPFW 14.4
± 2.9 mm; PEPBW 13.8 ± 2.6 mm, p=0.32). However, because during backward walking the movement is more inward directed in each step, the PEP is generally reached after a shorter step length (Fig. 3.1B-D). Taken together, these data show that in intact animals middle leg backward stepping is not simply reversed forward walking, but is instead altered to having shorter and more inward directed steps, albeit with a similar degree of variability as seen for forward stepping.
3.1.2 Stance duration alone determines cycle period
In stick insects walking on nonslippery surfaces, in which the different legs are coupled mechanically through the ground on which the animal walks, step cycle period depends on stance duration (Wendler, 1964; Graham, 1972; Graham and Epstein, 1985). It was tested if this relationship is also present in slippery surface forward, backward and curve walking, and, to test for inter-leg interactions, in animals with reduced leg numbers (only the two middle legs or only a single middle leg). In all these cases cycle period varied linearly with stance duration but did not depend on swing duration, which was essentially constant at all cycle periods (Fig. 3.2).
Figure 3.2 – Cycle period depends on stance, not swing duration. Gray circles represent swing phase, filled black boxes stance. A: straight forward walking, 6- legged animal. B: backward walking, 6-legged animal. C: straight forward walking, 2-legged animal (only middle legs). D: straight forward walking, 1-legged (middle) animal. E: curve inside-leg, 6-legged animal. F: curve outside-leg, 6-legged animal.
N = animal number, n = step number.
3.1.3 Phasing of leg muscle activity during forward, backward, and curve walking
EMG recordings of various leg muscles during walking have been made (Graham and Epstein, 1985; Fischer et al., 2001), but with few exceptions, only the activities of single muscle pairs were recorded (Bässler, 1993; Epstein and Graham, 1983;
Cruse and Pflüger, 1981). In addition, the timing reference for the beginning or end of muscle activity relative to step cycle, if present at all, was not precise. To remedy this lack we made comprehensive paired EMG recordings of all three major muscle pairs controlling leg movements, the protractor/retractor coxae, levator/depressor trochanteris, and the extensor/flexor tibiae muscles at a time during both forward and backward walking, as well as during curve walking.
Fig. 3.3 shows the activity of the muscles of the most proximal leg joint, the thorax- coxa joint, the protractor and retractor coxae muscles, which serve to protract and retract the leg, respectively. The traces in Fig. 3.3A show raw EMG activity, those in Fig. 3.3B rectified and smoothed (τ = 50 ms) activity, and those in Fig. 3.3C mean rectified activity from one stepping sequence (gray trace) and from five animals (black trace). In forward walking protractor activity began before the lift- off of the leg, reached its main activity during swing and then decreased towards the end of swing. In backward walking the protractor was barely active during swing but began at the transition between swing and stance and reached peak activity about 100 ms into stance. This activity pattern was the same for the retractor muscle except that it showed stance activity during forward walking and swing activity during backward walking.
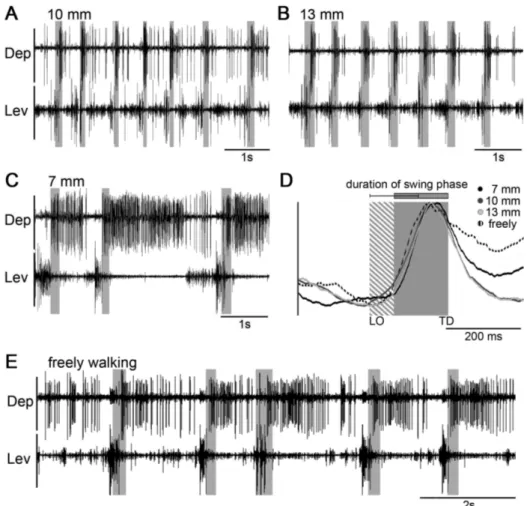
Fig. 3.4 shows the activity of the muscles of the next most distal leg joint, the coxa- trochanter joint, the depressor trochanteris and levator trochanteris muscles, which serve to depress and lift the leg, respectively. The traces in Fig. 3.4A again show raw EMG activity, those in Fig. 3.4B rectified and smoothed (τ= 50 ms) activity, and those in Fig. 3.4C mean rectified muscle activity from one stepping sequence (gray trace) and from five animals (black trace). Depressor activity began very shortly after swing beginning, was active throughout swing, and declined shortly after stance beginning. Provided the animal was maintained at a constant height about the substrate (see below), depressor activity was the same in forward and backward walking. Moderate levator muscle activity was present at the beginning and middle of stance with a substantial peak of activity occurring just before the stance to swing transition. Levator activity decreased and reached a minimum shortly after swing beginning. As with the depressor, levator activity was the same in forward and backward walking.
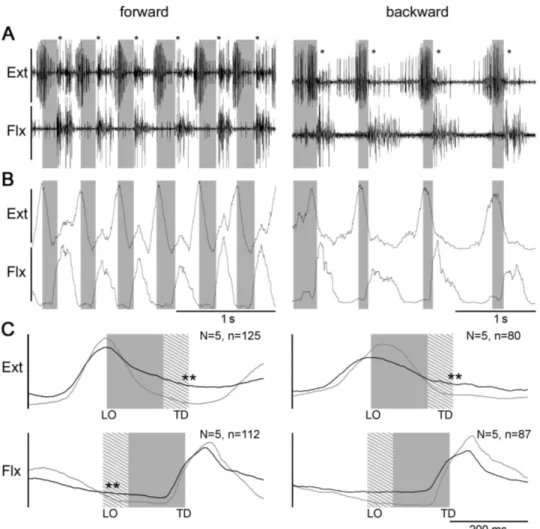
Figure 3.3 – Right middle leg protractor and retractor EMG recordings during forward (left column) and backward (right column) walking on a slippery surface.
A: raw EMG recordings. B: rectified and smoothed traces of EMGs in A. C: mean rectified and smoothed traces of recordings (gray) from one and from five animals (black). Gray boxes mark the average swing duration, shaded area shows swing duration SD. Double asterisks mark where crosstalk from the retractor was removed mathematically from the protractor traces. LO= leg lift-off, TD= leg touch down.
N=animal number, n=step number.
Figure 3.4 – Right middle leg levator and depressor activity during forward (left column) and backward (right column) walking on a slippery surface. A: raw EMG recordings. B: rectified and smoothed traces of EMGs in A. C: mean rectified and smoothed traces of recordings from one (gray) and from five animals (black). Gray boxes mark the average swing duration, shaded area shows swing duration SD. LO=
leg lift-off, TD= leg touch down. N=animal number, n=step number.
The last muscles analyzed (Fig. 3.5 ) were the extensor tibiae and flexor tibiae muscles which move the femur-tibia joint and extend and flex the tibia, respec- tively. The traces in Fig. 3.5 A again show raw EMG activity, those in Fig. 3.5B rectified and smoothed (τ= 50 ms) activity, and those in Fig. 3.5C mean rectified muscle activity from one stepping sequence (gray trace) and from five animals (black trace). Peak extensor activity occurred around lift-off in forward and in backward walking, while flexor activity peaked during the first half of stance in forward and backward walking.
Next, I looked at the leg muscle activity during curve walking, that is at the differences of muscle activity of an leg walking an outside curve or an inside curve.
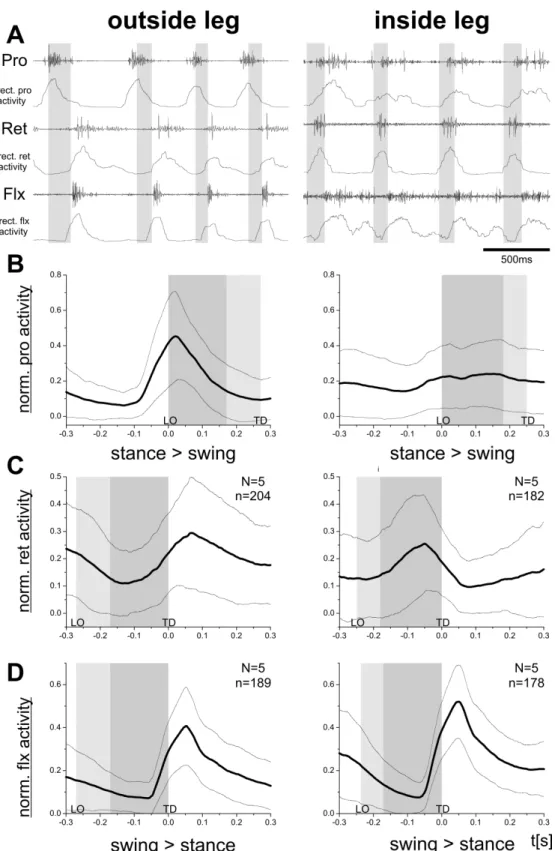
Fig. 3.6 shows the activity of protractor and retractor muscles, which were the only ones whose activity changed between forward and backward walking, together with a flexor EMG. Again, original EMG recordings, rectified and smoothed EMG traces, and the averaged rectified traces for all three muscles are shown. The activity of all three muscles during a curve outside leg (Fig. 3.6, left column) is very similar to the activity during forward walking. The protractor becomes active at the end of stance phase and reaches its peak activity during swing phase. The retractor is mostly active during stance but becomes active shortly before touch down of the leg. The flexor is activated at the onset of stance and quickly reaches its peak activity. In the flexor muscle, this activity is not altered when active during an inner curve, but the protractor and retractor activity changes (Fig. 3.6, right column). The protractor is only slightly active at the stance-swing phase transition and the retractor peak activity is shifted to the swing phase. This can be explained by the kinematics of the leg movement during curve walking.
Gruhn et al. (2009b) already showed that the outside middle leg during a curve has similar kinematics to the forward walking middle leg, thus the EMG activity is largely unchanged. However, a middle leg stepping an inner curve has a shorter step length. Steps are also more laterally directed, compared to the movement from anterior to posterior during swing phase in forward walking (Gruhn et al.
(2009b)). Furthermore, inner curve steps can be directed anteriorly, which means protractor activity occurs in the swing phase, in laterally directed steps there is a reduced protractor activity, and backward directed steps, when the animal is walking a very steep curve, showed protractor EMG activity during stance and retractor activity during swing (like in Fig. 3.3). All these differently directed steps were averaged in Fig. 3.6, but looked at independently in Fig. 3.7. There, it becomes apparent that the muscle activity depends on the direction the inside curve leg is stepping, and fits the previously described protractor and retractor muscle activity during forward and backward walking on the slippery surface.
Figure 3.5 – Right middle leg extensor and flexor activity during forward (left column) and backward (right column) walking on a slippery surface. A: raw EMG recordings, asterisks mark crosstalk from the flexor in the extensor trace. B: rec- tified and smoothed traces of EMGs in A. C: mean rectified and smoothed traces of recordings from one (gray) and from five animals (black). Gray boxes mark the average swing duration, shaded area shows swing duration SD. Double asterisks mark where crosstalk from the flexor muscle was removed mathematically from the extensor trace. LO= leg lift-off, TD= leg touch down. N=animal number, n=step number.
Figure 3.6 – Right middle leg protractor, retractor and flexor EMG recordings of a curve walking outside (left column) and inside leg (right column). A: raw EMG recordings of the three muscles and the corresponding rectified and smoothed EMG traces. B: mean rectified and smoothed traces of protractor activity of 5 animals (black trace) and its standard deviation (lighter gray traces), which indi- cates the range in which the muscle activity could occur. C: mean rectified and smoothed traces of retractor activity of 5 animals. D: mean rectified and smoothed traces of flexor activity of 5 animals. Gray boxes mark the average swing duration, lighter gray areas show swing duration SD. LO= leg lift-off, TD= leg touch down.
N=animal number, n=step number.
Figure 3.7 – Right middle leg protractor and retractor EMG recordings averaged and rectified during inner curve stepping with different directions. A: mean rectified and smoothed protractor and retractor activity for forward directed steps of an leg walking an inside curve. B: mean rectified and smoothed protractor and retractor activity for backward directed steps of an leg walking an inside curve. C: mean rectified and smoothed protractor and retractor activity for laterally directed steps of an leg walking an inside curve. Thick black traces mark the averaged activity, thinner gray traces the SD. Gray boxes mark the average swing duration, lighter gray areas show swing duration SD. LO= leg lift-off, TD= leg touch down. N=animal number, n=step number.
Finally, the muscle activity of depressor, levator and extensor muscles were com- pared during curve walking (Fig. 3.8). In analogy to the comparison between for- ward and backward walking, also the muscle activity of the levator and extensor does not change when walking an outside or an inside curve (Fig. 3.8B and C). In both cases the muscles are activated before the leg lift-off, and are mainly active during swing phase. The depressor muscle shows during both an outside and in- side curve an activation at the start of swing and a maximum activity during the second half of swing. However, in the outside curve depressor activity is prolonged during stance phase (Fig. 3.8A).
Figure 3.8 – Right middle leg depressor, levator and extensor EMG recordings during curve walking outside (left column) and inside legs (right column). A: mean rectified and smoothed traces of the depressor activity of 5 animals (black trace) and its standard deviation (lighter gray traces), which indicates the range in which the muscle activity could occur. C: mean rectified and smoothed traces of the levator activity of 5 animals. D: mean rectified and smoothed traces of the extensor activity of 5 animals. Gray boxes mark the average swing duration, lighter gray areas show swing duration SD. LO= leg lift off, TD= leg touch down. N=animal number, n=step number.
3.1.4 Latency of muscle timing during forward, backward, and curve walking
Reliably comparing muscle activity in different walking directions and across prepa- rations requires determining the exact timing of muscle activity within the step cycle. Swing to stance and stance to swing transitions are two such points. Fig. 3.9 and Fig. 3.10 show first spike latencies relative to these points for all six muscles in forward and backward walking, respectively, from 5 animals each.
The gray areas mark mean swing duration averaged across all steps and animals.
The protractor, levator and extensor muscles move the middle leg forward, up, and extend the femur-tibia joint. During forward walking these movements occur during swing. We therefore measured the first spikes in these muscles relative to lift-off (Fig. 3.9A, C, E). Activity occurred earliest in the levator (mean first muscle potential 99.9 ± 64.2 ms before lift-off), followed by the extensor (66.9 ± 47.3 ms) and then the protractor (36.5 ± 36.3 ms). The retractor, depressor and flexor muscles move the leg backwards, down, and flex the femur-tibia joint. During forward walking these movements occur during stance. We therefore measured the first spikes in these muscles relative to touch down (Fig. 3.9B, D, F). Activity occurred earliest in the depressor with the mean first muscle potential 93.1 ± 33.9 ms before touch down, 21% into the swing phase. The first flexor activity occurred next with mean first muscle potential 9.0 ± 13.3 ms after touch down.
Single first spikes occurred just before touch down, confirming previous findings for the timing of this muscle (Gruhn et al., 2006). First retractor activity was more variable, with mean first muscle potential 34.6 ± 33.6 ms after touch down and first activity occurring up to 50 ms before touch down. The joint activation sequence in swing is thus the same as that for stance, i.e., first coxa-trochanter, then femur-tibia, and finally thorax-coxa. The high standard deviations result from the high variability in the stepping of the stick insect on the slippery surface.
Walking sequences with many consecutive straight forward steps do not occur often and every step has a slightly different direction and stance duration.
As was shown above in the kinematics and EMG data, in backward walking pro- tractor and retractor timing is the reverse of that in forward walking. To continue to compare the timing of functional swing and stance muscles in the two walking directions, in backward walking sequences we therefore referenced retractor ac- tivity to lift-off and protractor activity to touch down but continued to reference the activity of the other muscles as before (Fig. 3.10A-F). Sequence of levator and extensor activation as well as the latencies for the first muscle potential (100.2 ± 60.5 ms, Fig. 3.10C; 56.8 ± 48.0 ms, Fig. 3.10E, respectively) were the same as in
Figure 3.9 – Histograms of the latency distribution of the first muscle potentials in the EMG traces of the six analyzed leg muscles during forward walking. The timing of the first spikes in protractor, levator and extensor were measured with respect to the time of lift-off. Retractor, depressor and flexor activity spikes were measured with respect to leg touch down. Gray boxes mark the average swing phase length. Average latency of the first spike is given with SD. N=animal number, n=step number.
Figure 3.10– Histograms of the latency distribution of the first muscle potentials in the EMG traces of the six analyzed leg muscles during backward walking. The timing of the first spikes in retractor, levator and extensor were measured with respect to the time of lift-off. Protractor, depressor and flexor activity spikes were measured with respect to leg touch down. Gray boxes mark the average swing phase length. Average latency of the first spike is given with SD. N=animal number, n=step number.