Studies on Stock Market Efficiency
Dissertation zur Erlangung des Grades eines Doktors der Wirtschaftswissenschaft
eingereicht an der Fakultät für Wirtschaftswissenschaften der Universität Regensburg
vorgelegt von:
Dipl.-Kfm. Johannes Rieks
Berichterstatter: Prof. Dr. Klaus Röder (Universität Regensburg) Prof. Dr. Gregor Dorfleitner (Universität Regensburg) Eingereicht am: 20. Juni 2014
Tag der Disputation: 14. Januar 2015
Für meinen Vater und alle die, die meine Launen ertragen haben.
I
Inhaltsverzeichnis
Inhaltsverzeichnis ... I Tabellenverzeichnis ... V
1. Preface ... 1
2. Short-Term Market Overreaction on the Frankfurt Stock Exchange ... 8
2.1. Introduction ... 9
2.1.1. Related Literature: Long-Term Overreaction ... 9
2.1.2. Related Literature: Short-Term Overreaction ... 10
2.2. Sample and Methodology ... 11
2.2.1. Sample ... 11
2.2.2. Trading Strategy ... 16
2.3. Results ... 18
2.3.1. Descriptive Statistics ... 18
2.3.2. Return Reversals ... 19
2.3.3. Regression Results ... 21
2.3.3.1. Model 1 ... 21
2.3.3.2. Model 2 ... 22
2.3.3.3. Further Robustness Checks ... 22
2.3.3.4. Summary ... 23
2.3.4. Trading Strategy Returns ... 24
2.3.4.1. Uncertain Information Strategies ... 24
2.3.4.2. Momentum Strategies ... 24
II
2.3.4.3. Overreaction Strategies ... 25
2.3.4.4. Summary ... 25
2.4. Conclusions ... 26
3. Short-Term Return Drift in Emerging Markets ... 41
3.1. Introduction ... 42
3.2. Data ... 45
3.2.1. Plain Data ... 45
3.2.2. Derived Data ... 46
3.2.3. Screens ... 47
3.3. Methodology ... 48
3.3.1. Event Definition ... 48
3.3.2. Significance of Post-Event Returns ... 49
3.3.3. Determinants of Post-Event Abnormal Returns ... 51
3.4. Univariate Results... 53
3.4.1. Descriptive Statistics ... 53
3.4.2. Stock Return Predictability across Emerging Markets ... 54
3.4.2.1. Global Samples ... 54
3.4.2.2. Regional Analysis ... 55
3.4.2.3. Country-Level Analysis ... 56
3.5. Cross-Sectional Regressions... 58
3.5.1. Global samples ... 58
3.5.2. Regional Analysis ... 60
III
3.5.2.1. Pooled Samples ... 60
3.5.2.2. Size Sub-Samples ... 61
3.5.3. Country-Level Analysis ... 62
3.5.3.1. Pooled Samples ... 62
3.5.3.2. Size Sub-Samples ... 63
3.6. Robustness ... 65
3.7. Conclusions ... 65
4. Investor Relations, Talking Insiders, and Liquidity ... 83
4.1. Introduction ... 84
4.2. Related Literature ... 85
4.2.1. Investor Relations and Insider Trading ... 85
4.2.2. Investor Relations and Liquidity ... 86
4.2.3. Investor Relations vs. Annual Reporting ... 87
4.2.4. Hypothesis Development ... 88
4.3. Data ... 89
4.3.1. Investor Relations and Annual Report Quality ... 89
4.3.1.1. Investor Relations Quality ... 89
4.3.1.2. Annual Report Quality ... 90
4.3.2. Company and Return Data ... 91
4.4. Methodology ... 93
4.4.1. Insider Trading and Investor Relations ... 93
4.4.2. Direct Liquidity Proxies ... 95
IV
4.4.2.1. Proportional Quoted Spread ... 95
4.4.2.2. Amihud (2002) Illiquidity Ratio ... 96
4.4.3. Indirect Liquidity Proxies ... 98
4.4.3.1. Share Trading Volume ... 98
4.4.3.2. Relative Stock Return Volatility ... 99
4.4.4. Stock Performance ... 99
4.5. Results ... 101
4.5.1. Descriptive Statistics ... 101
4.5.2. Correlation Analysis ... 102
4.5.3. Insiders Talking and Trading ... 103
4.5.4. Investor Relations and Liquidity ... 104
4.5.4.1. Direct Measures ... 104
4.5.4.2. Indirect Measures ... 105
4.5.5. Investor Relations and Stock Performance ... 106
4.5.6. Robustness ... 108
4.6. Conclusions ... 108
5. Summary ... 122
V
Tabellenverzeichnis
Table 1: Events and Event Probabilities: 1988-2007 ... 31
Table 2: Normal and Abnormal Post-Event Returns ... 32
Table 3: Regressions on ARi, t + 1 and ARi, [t + 1; t + 5] for Model 1 ... 33
Table 4: Regressions on ARi, t + 1 for Model 2 ... 35
Table 5: Regressions on ARi, [t + 1; t + 5] for Model 2 ... 37
Table 6: Regressions on ARi, t + 1 and ARi, [t + 1; t + 5] for Model 3: 1988-2007 ... 39
Table 7: Trading Strategy Returns ... 40
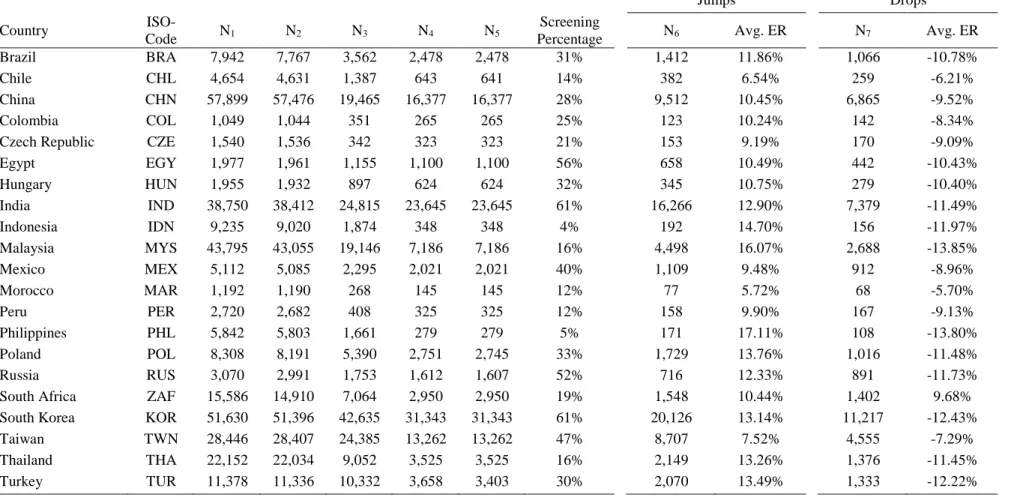
Table 8: Country sample sizes ... 69
Table 9: Descriptive Statistics ... 70
Table 10: Post-event day abnormal returns by region ... 72
Table 11: Post-event day abnormal returns by country ... 73
Table 12: Explanatory regressions by region ... 77
Table 13: Explanatory Regressions by Country ... 79
Table 14: Insider Trading – Summary statistics ... 114
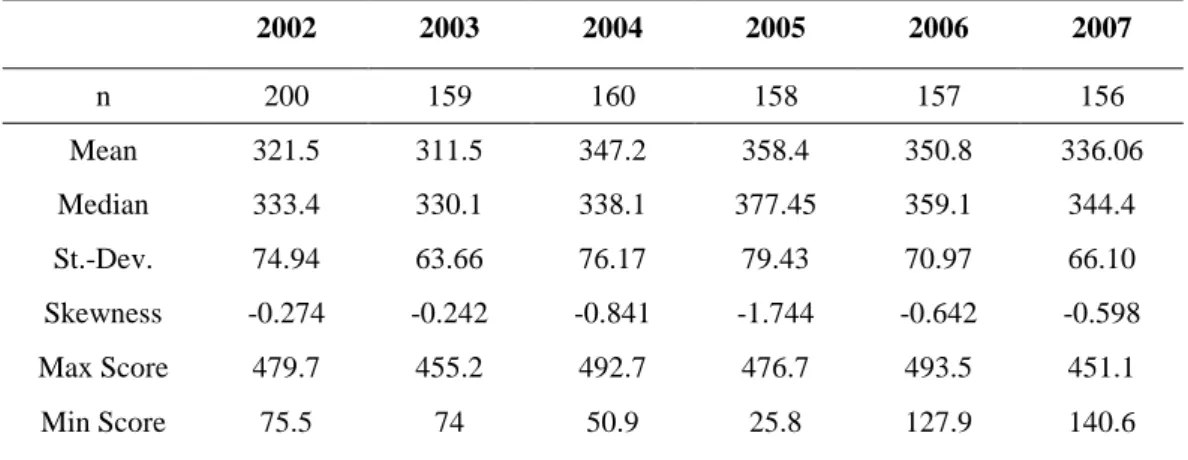
Table 15: Summary statistics of the investor relations scores ... 115
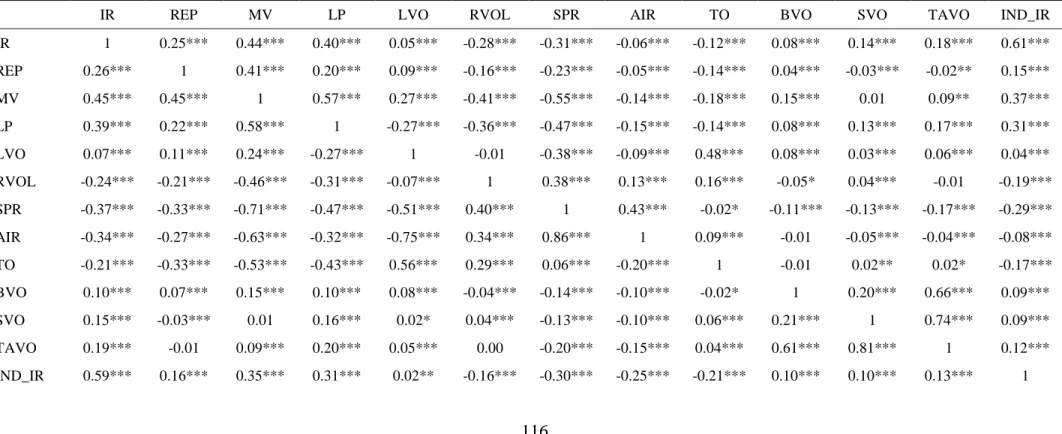
Table 16: Variable correlations ... 116
Table 17: Regressions on Insider Trading Volume ... 117
Table 18: Effects of investor relations on direct liquidity measures ... 118
Table 19: Indirect liquidity measures ... 119
Table 20: Arbitrage portfolio returns: good vs. bad investor relations ... 120
Table 21: Regressions on monthly excess returns ... 121
1
1. Preface
This dissertation consists of three empirical studies on capital market efficiency in a broader sense. Two of the three papers are dedicated to the examination of short-term stock-returns in the wake of large one-day price changes – positive or negative. If significant abnormal returns can be found after large price changes this may indicate improper information efficiency. One if not the only way for listed companies do disseminate information is via investor relations. The release of ad-hoc statements levels the informational playing field for all investors and should thereby help to prevent overreaction or return drift. The third paper deals on the one hand with the causality chain of investor relations and liquidity and on the other hand with the question if insider trading and investor relations are positively correlated.
The literature on short-term returns after large one-day price changes has its roots in the literature on long-term overreaction: DeBondt and Thaler (1985) could show that the best performing stocks of a three-year-period underperform the stock market during the three following years.
That phenomenon was termed overreaction. Inspired by this study for long-run stock returns, other authors like Atkins and Dyl (1990) and Bremer and Sweeney (1991) document short-term market overreaction after large one-day price changes of more than ten percent in either direction on the US stock market. International studies on overreaction were published for Japan (Bremer et al., 1997) and Hong Kong (Otchere and Chan, 2003). Although there exist numerous studies on the US market by Cox and Peterson (1994), Pritamani and Singal (2001), Larson and Madura (2003), and Sturm (2003), there was no study concerning short-term overreaction for the German stock market. The first paper of this dissertation closes that gap. Building on the earlier studies for the US market by Atkins and Dyl (1990) and Bremer and Sweeney (1991) it shows that there is a short-term overreaction after large one-day price changes of ten percent or more on the German stock market. That means that German stocks earn on average a significantly positive
2
(negative) abnormal return on the trading day after a price decrease (increase) of more than ten percent. This phenomenon can be found among large caps (constituents of the DAX30 index) mid-caps (MDAX), small caps (SDAX), and technology stocks (NEMAX50/TecDAX) for the years since index inception. Like in the US the reaction to large one-day price changes is asymmetric on the German stock market. The abnormal returns after price decreases are economically and statistically more significant than after price increases. The results show, however, that it is not possible to implement a trading strategy of buying stocks with one-day price decreases of more than ten percent to exploit the overreaction.
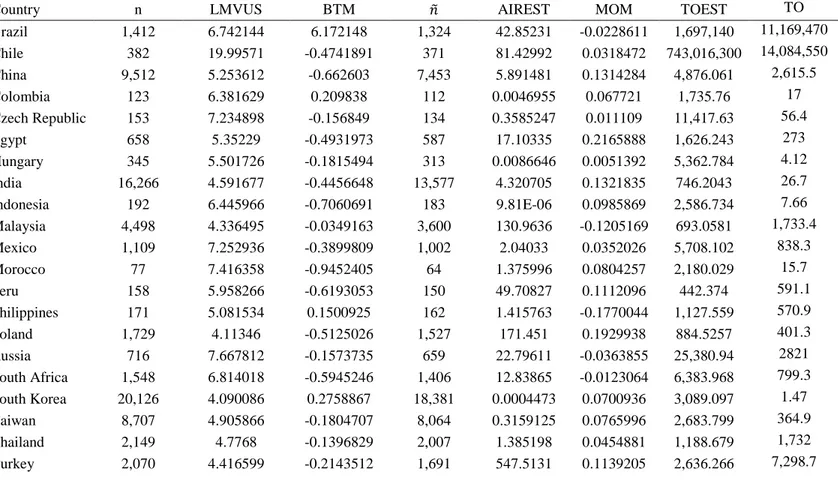
During the literature review for the first paper it became clear that the literature provided no comprehensive study of the short-term stock returns after large one-day price changes for emerging markets. This study is represented by the second paper of this dissertation. It contains an analysis of short-term reactions to price shocks in 22 emerging country stock markets grouped in four geographic regions (Asia, Eastern Europe, Latin America, Middle East and Africa). Apart from the changed geographical focus the second paper is also different from the first with regard to the methodology. The methodology of the first paper is enhanced in three ways. First, the absolute event definition of the earlier literature that was also used in the first paper is replaced by a relative event definition. In the earlier papers a large price change is every price change with an absolute stock return of more than ten percent. By the relative definition that was first used by Pritamani and Singal (2001) a large price change is defined as a daily return that is more than three standard deviations away from the expected return. This definition is better suited to deal with the heterogeneous samples from different countries. That becomes evident if one compares for example the average large price decrease in Morocco, which is -5.7%, with the average large price decrease in Malaysia, which is -13.85%. Second, the expected return for the day of the large price change is calculated with a market model for an estimation period that ranges from 260 days to 10 days before the large price change. The expected return of the model is adjusted
3
with the methodology of Dimson (1979), using a window of 5 days before and after the day with the large price change. Third, abnormal returns are not measured by plain t-statistics, but with the methodologies of Boehmer et al. (1991) and Corrado and Zivney (1992). The use of the more sophisticated test statistics renders it possible to account for higher volatility that is observed before and after large one-day price changes.
The main finding of the second paper is that, in contrast to developed markets, overreaction cannot be found persistently in emerging markets. Instead, stock return drift is the prevalent phenomenon. That means that stocks earn on average significantly positive abnormal returns after price jumps and significantly negative abnormal returns after price drops. Moreover, abnormal returns in emerging markets are more economically and statistically significant after price jumps, which stands in contrast to the results for developed markets, too. The analysis of size sub-samples shows that the extent of the return drift after large one-day price changes depends to a large extent on company size.
The third paper examines the interaction of investor relations, insider trading, and liquidity.
Earlier literature by Amihud and Mendelson (1986 and 1988), Lev (1988), and Diamond and Verrecchia (1991) suggests that a firm’s disclosure policy influences the liquidity of its stocks.
In that context disclosure comprises all means by which information about that firm is made public. The three components of disclosure that are differentiated in the literature are annual reports, quarterly reports and investor relations (Lang and Lundholm, 1993). Investor relations comprise all activities that are undertaken by companies on an irregular basis. While most of the earlier studies focus on the relationship between either disclosure in general or investor relations and liquidity, Hong and Huang (2005) propose a model that links investor relations with liquidity and insider trading.
In the model by Hong and Huang insider trading and investor relations are intertwined, the common denominator being liquidity. The model suggests that investor relations activities are a
4
means for company insiders to create liquidity for their own shares. The line of argumentation is as follows: stakeholders that have discretionary power over the investor relations policy have an incentive to overspend on investor relations if their advantages from higher liquidity outweigh the costs of increased investor relations efforts. Because the costs of investor relations are shared equally by all shareholders, those stockholders with large liquidity needs, for example company founders or board members have the most to gain from higher liquidity. This is due to liquidity discounts that buyers and sellers of blocks of shares face because of a lack of market depth.
The third paper is the first paper to provide empirical evidence for the model by Hong and Huang.
It tests two hypotheses on the German stock market. The first hypothesis is that investor relations are a means to create liquidity and that good investor relations lead to higher liquidity. This hypothesis is based on earlier papers by Amihud and Mendelson (1986 and 1988), Lev (1988), Diamond and Verrecchia (1991), Lang and Lundholm (1996), Francis et al. (1997), Brennan and Tamarowski (2000), and Leuz and Verrecchia (2000). The second hypothesis is that firms with better investor relations are more prone to insider trading than those with worse investor relations. That hypothesis is based on the predictions of the model by Hong and Huang.
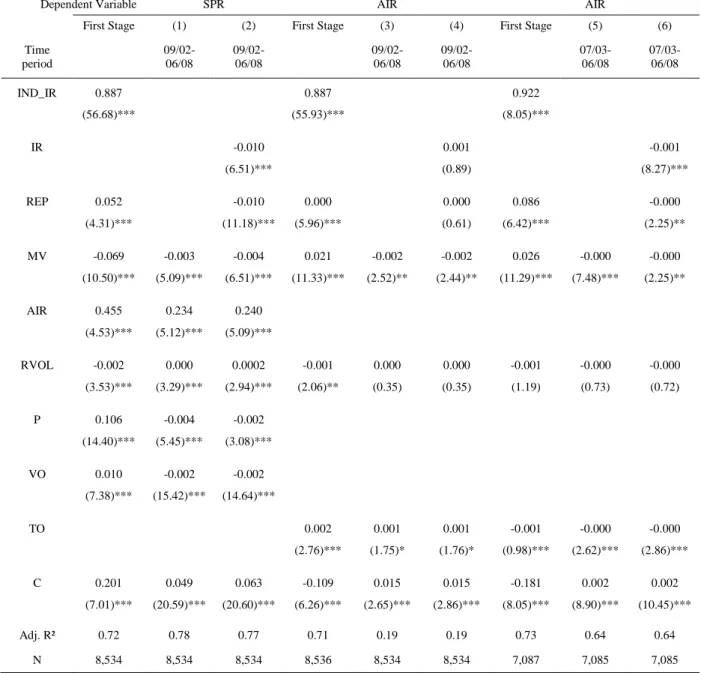
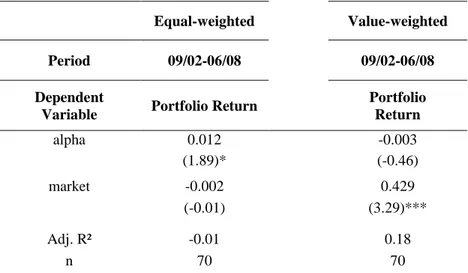
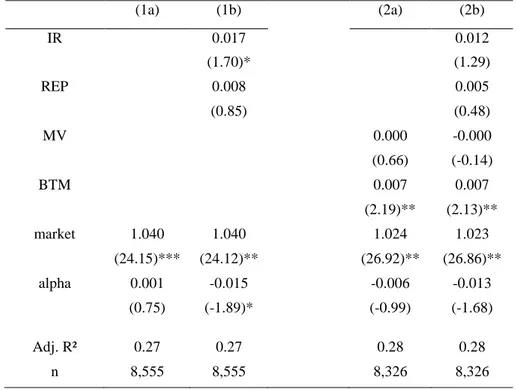
German data from 2003 through 2007 support both hypotheses. Regarding the first hypothesis it can be shown that companies with good investor relations enjoy higher liquidity as measured by Amihud (2002) ratios, spreads, share trading volume, and stock return volatility. Regarding the second hypothesis it can be shown that companies with heavy insider trading are more likely to have good investor relations than those with less insider trading. Even more surprising, the data suggest that good investor relations come along with subpar accounting quality. Therefore, it cannot be ruled out that large stakeholders put large efforts in investor relations and at the same time exert an influence on accounting policy to be diffuse. As a consequence investors should shy away from an investment in these companies’ stocks. In contrast to earlier studies on the US
5
market it is not possible to substantiate any relationship between a stock’s return and the investor relations policy.
References
Amihud, Y., Mendelson, H. (1986). Asset Pricing and the Bid-Ask Spread. Journal of Financial Economics 17, 223-249.
Amihud, Y., Mendelson, H. (1988). Liquidity and Asset Prices: Financial Management Implications. Financial Management 17, 5-15.
Amihud, Y. (2002). Illiquidity and stock returns: cross-section and time-series effects. Journal of Financial Markets 5, 31-56.
Atkins, A. B. and Dyl, E. A. (1990). Price Reversals, Bid-Ask Spread, and Market Efficiency.
Journal of Financial and Quantitative Analysis 25, 535-547.
Boehmer, E., Musumeci, J., and Poulsen, A. B. (1991). Event study methodology under conditions of event induced variance. Journal of Financial Economics 30, 253-272.
Bremer, M. and Sweeney, R. J. (1991). The Reversal of Large Stock-Price Decreases. Journal of Finance 46, 747-754.
Bremer, M., Hiraki, T., and Sweeney, R. J. (1997). Predictable Patterns after Large Stock Price Changes on the Tokyo Stock Exchange. Journal of Financial and Quantitative Analysis 32, 345-365.
Brennan, M.J., Tamarowski, C. (2000). Investor Relations, Liquidity and Stock Prices. Journal of Applied Corporate Finance 12, 26-37.
6
Corrado, C. J. and Zivney, T. L. (1992). The Specification and Power of the Sign Test in Event Study Hypothesis Tests Using Daily Stock Returns. Journal of Financial and Quantitative Analysis 27, 465-478.
Cox, D. R. and Peterson, D. R. (1994). Stock Returns following Large One-Day Declines:
Evidence on Short-Term Reversals and Longer-Term Performance. Journal of Finance 49, 255-267.
DeBondt, W. F. M. and Thaler, R. (1985). Does the Stock Market Overreact? Journal of Finance 40, 793-805.
Diamond, D. W., Verrecchia, R. E. (1991). Disclosure, Liquidity, and the Cost of capital. Journal of Finance 46, 1325-1359.
Dimson, E. (1979). Risk measurement when shares are subject to infrequent trading. Journal of Financial Economics 7, 197-226.
Francis, J., Hanner, J.D., Philbrick, D.R. (1997). Management Communication with Securities Analysts. Journal of Accounting and Economics 24, 363-394.
Hong, H., Huang, M. (2005). Talking up liquidity: insider trading and investor relations. Journal of Financial Intermediation 14, 1-31.
Lang, M.H., Lundholm, R.J. (1993). Cross-Sectional Determinants of Analyst Ratings of Corporate Disclosures. Journal of Accounting Research 31, 246-271.
Lang, M.H., Lundholm, R.J. (1996). Corporate Disclosure Policy and Analyst Behavior.
Accounting Review 71, 467-492.
Leuz, C., Verrecchia, R.E. (2000). The Economic Consequences of Increased Disclosure. Journal of Accounting Research 38, 91-124.
7
Larson, S. J. and Madura, J. (2003). What Drives Stock Price Behavior Following Extreme One- Day Returns. Journal of Financial Research 26, 113-127.
Lev, B. (1988). Toward a Theory of Equitable and Efficient Accounting Policy. Accounting Review 63, 1-22.
Otchere, I. and Chan, J. (2003). Short-Term Overreaction in the Hong Kong Stock Market: Can a Contrarian Strategy Beat the Market? Journal of Behavioral Finance 4, 157-171.
Pritamani, M. and Singal, V. (2001). Return predictability following large price changes and information releases. Journal of Banking & Finance 25, 631-656.
Sturm, R. R. (2003). Investor Confidence and Returns Following Large One-Day Price Changes.
The Journal of Behavioral Finance 4, 201-216.
8
2. Short-Term Market Overreaction on the Frankfurt Stock Exchange
(with Sebastian Lobe)
Published in Quarterly Review of Economics and Finance (2011, Vol. 52, Issue 2, 113-123)
Abstract
This paper offers out-of-sample evidence of subsequent short-term abnormal returns for stocks experiencing a price change of ten percent or more in either direction on the German stock market between 1988 and 2007. First, we find significant evidence of overreaction which is not exclusively concentrated in small-caps. Second, some well documented anomalies and stock characteristics seem to exhibit explanatory power. However, when controlling for size only a reversal effect can pervasively explain the abnormal 1-day stock market reaction to price shocks.
Third, due to transaction costs and unpredictable market sentiment these anomalies can hardly be exploited. After all, our robust findings suggest no violation of the efficient market hypothesis.
JEL classification: G14, G01, G15
Keywords: Overreaction, price shocks, anomalies
9 2.1. INTRODUCTION
Since the beginning of the 1980s, there has been a lot of research on capital market anomalies like the size effect, the turn-of-the-year effect, the weekend effect and overreaction, which seem to contrast the Efficient Market Hypothesis (EMH). The aim of this paper is to provide out-of- sample tests of short-term reactions to price shocks on the German stock market. The paper is organized as follows. The next two subsections present a literature review on long-term and short-term overreaction. Section 2 describes the sample, provides our research questions and methodology. In section 3 we present and discuss the results. Section 4 concludes.
2.1.1. Related Literature: Long-Term Overreaction
DeBondt and Thaler (1985) inspired most other research on overreaction when they found that the 35 loser stocks of a five-year portfolio formation period on average outperformed the 35 winners over the following three years. Furthermore, they offered proof of asymmetric overreaction to new information, with losers exhibiting positive abnormal returns and winners earning negative abnormal returns compared to the market. Since then, international evidence of long-term overreaction was reported for example by Stock (1990) for the German market.
Trying to explain overreaction, some researchers, like Zarowin (1990), dismiss the overreaction phenomenon as a manifestation of the size effect, which is reported in the seminal work by Banz (1981). Zarowin (1990) could show that smaller winners, in terms of market capitalization, outperformed larger losers and vice versa. Conrad and Kaul (1993) contend that the perceived overreaction in long-term studies was due to arithmetical errors because DeBondt and Thaler (1985) and other researchers, following their methodology, report cumulated abnormal returns instead of buy-and-hold abnormal returns. However, research from several countries, such as that by Alonso and Rubio (1990) from Spain, daCosta (1994) from Brazil, Meyer (1994), Mun et al. (1999), and Schiereck et al. (1999) from Germany, or by Baytas and Cakici (1999), who
10
examine seven developed countries, finding overreaction in all but the United States, shows that long-term overreaction is persistent even when the critic’s arguments are accounted for.
2.1.2. Related Literature: Short-Term Overreaction
In the first study of daily overreaction, Arbel and Jaggi (1982) cannot find significant abnormal returns for stocks that are placed on the Wall Street Journal’s Winner-Loser list. Using the same procedure, Atkins and Dyl (1990) show that losers earn average positive abnormal returns the next day, whereas the average abnormal return for winners is negative. Despite the significant abnormal returns, Atkins and Dyl (1990) argue that this overreaction was no violation of the EMH as it could not be exploited because of bid-ask spreads.
Bremer and Sweeney (1991) study price decreases only and implement a slightly different approach, defining event days for a stock by an absolute daily trigger return of -10%. They document return reversals as well, with an average abnormal return of 1.773% on the first day after an event and a cumulated abnormal return of 2.215% over the two days after the price shock.
Cox and Peterson (1994) find significant reversals of 1-day price decreases, too, but only for the period before 1987. They therefore conclude that overreaction vanishes with rising market liquidity. However, Ma et al. (1998) document overreaction after 1987 for NASDAQ stocks, with a more pronounced overreaction of losers and smaller companies.
Contradicting evidence comes from Larson and Madura (2003), who find that instead of overreacting the market in general was too optimistic. Using the same methodology as Bremer and Sweeney (1991), they show that winners as well as losers earn significantly negative abnormal returns during the period from 1988 until 1995. Using monthly data, Ising et al. (2006) come to the same conclusion for the German stock market.
For the period between 1990 and 1992, Pritamani and Singal (2001) find underreaction to price shocks, with abnormal returns of 0.25% for winners and -0.29% for losers on day one after an event. Taking round-trip transaction costs of 0.5% into account, this underreaction is not
11
exploitable. Neither Larson and Madura (2003) nor Pritamani and Singal (2001) document an influence of size on the reaction to price shocks.
Sturm (2003) offers more recent evidence of overreaction after negative price shocks. He is unable to find any significant reaction to positive events. Furthermore, he tests how company fundamentals like Earnings per Share (EPS) and Book Value per Share (BVPS) influence the market reaction to price shocks. He finds that EPS under some conditions have a positive influence on post-event returns, whereas BVPS cannot explain much of the price movements subsequent to events.
There are fewer studies of short-term overreaction outside the US than of long-term overreaction.
Among them, Bremer et al. (1997) document short-term overreaction in Japan. Otchere and Chan (2003) find overreaction in Hong Kong during the period before the Asian crisis, too. But the reversals were not large enough to be exploited.
Although the German stock market is one of the largest stock markets of Continental Europe in terms of turnover and market capitalization there exists to the best of our knowledge no study on short-term overreaction on the cross-section of German stocks so far. We contribute to the literature in three ways. First, we provide evidence of short-term overreaction on the German stock market, and determine whether it is a size-related phenomenon. Second, we analyze whether other anomalies and characteristics correlate with the stock’s reaction to price shocks.
Third, we investigate the potential of implementing a profitable trading strategy based on the market reaction to price shocks.
2.2. SAMPLE AND METHODOLOGY 2.2.1. Sample
To avoid bid-ask-spreads and illiquidity biasing the sample towards overreaction, as reported by Cox and Peterson (1994), we take four measures. The first is to study only stocks belonging to
12
one of the four major German stock indices traded on the Frankfurt Stock Exchange. These stocks are the most liquid in Germany, because index members are selected according to market capitalization and free float1. Secondly, following the methodology of Bremer and Sweeney (1991), stocks with a price of less than €10 are excluded from the sample to avoid biases caused by low stock prices and higher proportional bid-ask spreads. Stocks with a price of less than €10 are more likely to experience events because the tick size in percent of the price is higher than for more expensive stocks. The threshold value of ten monetary units, whether in US dollars or euros, which is chosen in most studies of short-term return reversals is somewhat arbitrary but can be interpreted as a psychological barrier for investors. Stocks with a price of less than ten monetary units are traded less frequently and are therefore less liquid than more expensive stocks.
The third measure is to eliminate all stocks that do not show any non-zero return on at least four out of the five trading days after an event to avoid the inclusion of illiquid stocks. Finally, all events that occur on a company’s dividend date or in the five preceding days are eliminated from the sample. Although Bremer et al. (1997) argue in a study of the Japanese market that the bias is negligible because only 8% of the positive events and 17% of the negative events occur near the ex-dividend date, in this study ex-dividend dates are removed to avoid the bias caused by the stock price loss due only to the dividend payment which could otherwise be mistakenly attributed to the event or the reversal.
The final sample consists of the returns of all constituents of the four major German stock indices since inception of the respective index. The examined period starts on January 1, 1988 for the DAX30, the index of the 30 largest German companies in terms of free-float and market capitalization. For the MDAX, the index of mid-caps, the screening starts on April 11, 1994. For
1 See Deutsche Börse Group (2010) for further details.
13
constituents of the small-cap index SDAX and the technology index NEMAX50 the screening begins on July 1, 1999. On March 24, 2003 the NEMAX50 was replaced by the TecDAX2. The period examined ends on February 28, 2007 for all indices. Companies dropping out of an index are replaced by their successors at the date of the index change. From that date on, the return of the new index member is included in the analysis. Data on the index companies is hand-collected.
A lot of research papers dealing with index constituents base their sample composition only on current index membership. Such a procedure induces many biases, e.g., such as the survivorship bias, which our study, however, is not prone to.
Returns come from DataStream International. In total, the study screens 565,462 daily return observations. How these return observations are distributed among the indices is shown in Table 1. Following Bremer and Sweeney (1991), days with a price change of more than 10% in either direction for a single stock are referred to as event days for that stock. The total number of event days over all indices and time periods considered is 3,765, of which 2,239 (about 60%) are price increases and 1,526 are price decreases. The distribution of the events among the respective indices can also be found in Table 1. If events happen to be within five trading days after another event, these events are referred to as reaction events.
To see whether the existence and the degree of return reversals is dependent on size or vanishes over time, as proposed by Cox and Peterson (1994), the total sample of events is split into four time periods. The comparison of the sub-periods can show whether the reversals become weaker when markets become more liquid. The time periods are chosen to coincide with the inception dates of the single indices.
2 The NEMAX50 was suspended after the technology stock bubble burst and the index had lost more than 90% of its peak value in 2003. The TecDAX replaced the NEMAX50 as the German index for technology stocks.
14
To elaborate whether overreaction is a size phenomenon two approaches are chosen. The first is to divide the whole sample into five index sub-samples, that is, one for each index. The comparison of differences in the event probabilities and reversals in each of the index sub- samples can show whether there is a size effect, because the index membership is dependent on market capitalization and free-float, and therefore mainly, if not exclusively, on company size.
The other approach is to include market value of equity in our regressions on post-event returns.
For these regressions the sample is not divided into index sub-samples.
In order to investigate the possibility of asymmetric reactions to price increases and price decreases each of the eleven sub-samples is in turn split into three sub-samples – one for all events, one for price jumps, and one for price drops.
The simple net return for the first day after an event day t ( , ) and the buy-and-hold return for days 1 through 5 after each event ( ,[ ; ]) are calculated as
, = ,
, − 1, (1)
and ,[ ; ] = ,
, − 1, (2)
with , denoting the closing price of stock i on event day t.
The average returns after the occurrence of price shocks are reported in Table 2 sorted into indices and sub-periods. More important, we calculate abnormal returns for every event stock compared to the respective index return (DAX30, MDAX, SDAX, Technology) for the first day after the event and over the five days following an event. These abnormal returns which are size- (respectively, industry-) and market-adjusted are calculated as
, = , − , , (3)
and ,[ ; ] = ,[ ; ]− ,[ ; ], (4)
respectively. For each sub-sample a t-test is conducted in order to establish whether the abnormal returns are significantly different from zero. If the size of a sub-sample is smaller than 30
15
observations, a Wilcoxon signed-rank test is used instead. To control for an individual stock’s risk in our regression analysis, we also estimate the daily stock return volatility from a 60-trading day estimation window prior to the event i:
( )
1 2
60
1 60 1
=−
=−
= −
−
∑
ti ,t i ,t i
t
VO R R (5)
2.2 Factors influencing reversals
Having shown evidence of the existence of abnormal reversals, we run multivariate regressions to test whether anomalies and other stock characteristics influence the direction and the extent of the market’s abnormal reaction to price shocks. Specifically, we test the influence of the abnormal event return itself (ER), the log of company size (MV), the log of the book-to-market ratio (BTM), the average (mean) daily return during the last 60 trading days (RET), the log of the price-earnings ratio (PE), and the estimated stock return volatility (VO) on post-event abnormal returns. Therefore, for each event stock, market value of equity (MV), number of shares (NOSH), book value per share (BVPS) and earnings per share (EPS) are obtained from WorldScope International. Prices (P), book-to-market ratios and price-earnings ratios are identified for each event stock on the event day. We control for size (MV) since the seminal work of Banz (1981) has shown its explanatory power for U.S. returns in the cross-section. To capture the value premium, we employ BTM as the premier value variable, and for robustness we also use PE in the spirit of Fama and French (1992). As a proxy for the momentum effect pioneered by Jegadeesh and Titman (1993) we refer to RET in line with Hong and Kacperczyk (2009).
Finally, to account for stock-specific risk we include VO as outlined in equation (5). We regress these characteristics on , and ,[ ; ], respectively. Hence, the regression equations are
, = !"+ ! # , + !$%&, + !'()%, + !* #), + ! #, + !+&,, + -, (6),
,[ ; ] = !"+ ! # , + !$%&, + !'()%, + !* #), + ! #, + !+&,, + -, (7)
16
for Model 1, where the subscripts i and t represent stock i and event day t, respectively.
Regressions are run for each sub-sample (split into periods and events) with White (1980) heteroskedasticity-robust standard errors. The results of the multivariate regressions for Model 1 can be found in Table 3.
Furthermore, we run regressions on the different index sub-groups for each sub-period excluding the log of market value of equity (MV) as explanatory variable to capture the variation within a size group. The regressions take the form
, = !"+ ! # , + !$()%, + !' #), + !* #, + ! &,, + -, (8),
,[ ; ] = !"+ ! # , + !$()%, + !' #), + !* #, + ! &,, + -, (9)
labeled as Model 2. The results are reported in Tables 4 and 5.
As a robustness check to Model 1, we additionally incorporate in Model 3 R (=15) dummy variables for each relevant year (DRELYEAR) having more than 20 events3. We do this to account for possible seasonality effects of market reactions to price shocks. Model 3 is thus specified as
, = !"+ ! # , + !$%&, + !'()%, + !* #), + ! #, + !+&,, + (. 0 #12# + -, (10),
,[ ; ]= !"+ ! # , + !$%&, + !'()%, + !* #), + ! #, + !+&,, + (. 0 #12# + -, (11)
where B´ is the Rx1 vector of coefficients for the R relevant years. Results of the regressions including annual dummy variables are shown in Table 6.
2.2.2. Trading Strategy
The last step is to test whether trading strategies based on reactions to price shocks can beat the market. Due to short-selling restrictions for private investors in Germany we focus on strategies that could have been realized without short-selling only. Three trading strategies are
3 Only years with more than 20 events are included because otherwise the equation system cannot be solved properly.
17
implemented for each sub-sample: the first is to buy every stock that experiences an event at the end of the trading day and to sell it at the end of the next trading day. This strategy would have been successful if there had been overreaction to bad news and underreaction to positive news, as suggested from the uncertain information hypothesis by Brown et al. (1988). According to this, event stocks should earn positive returns after any kind of event. Hence, this strategy is referred to as uncertain information strategy. The second strategy is to buy losers at the end of the event day, which would have been successful if losers had overreacted, meaning if losers had earned positive returns after the price shock. We label this strategy as overreaction strategy. The momentum strategy, which would earn positive returns in the presence of momentum, that is, winners would earn positive returns on the post-event day, is to buy winners at the end of the event day and to hold them for one trading day.
Allowing for a realistic strategy, we restrict the holding period to one trading day only, because otherwise the problem of fixed capital could not have been avoided. If, for example, an investor were to buy a stock on the event day and to hold it for five days he would be unable to invest his money in another stock experiencing an event during the holding period, whereas with a one-day holding strategy it is possible to invest in event stocks on consecutive trading days. In the case of only one event the total capital is invested in the event stock. If more than one event occurs on the same trading day, the capital is split equally between the event stocks. The returns of the active strategies are compared to the passive buy-and-hold index returns during the corresponding period. The strategies are applied to each of the 33 sub-samples. We report the cumulated index return for the sub-samples of which the event stocks are index constituents of.
The returns of our trading strategies are not compared to returns of a semi-active strategy where the index is bought at the end of an event day and sold at the end of the next day, because such investor behaviour is rather far-fetched: returns of such a strategy would have been negative in all but one sub-sample. Therefore, no rational investor would pursue such a semi-active trading
18
strategy. The strategies of actively buying event stocks, be they winners or losers, are compared to the passive strategy of buying the respective index at the start of one sample period and holding it to the end of the sample period. The overall strategy return is the difference of the active versus the passive portfolio return during the analysed period. To account for the impact of trading costs all strategy returns are calculated also with trading costs deemed reasonable for private investors, that is, round-trip trading costs of 1%.
2.3. RESULTS
2.3.1. Descriptive Statistics
(Insert Table 1 here)
The overall event probability for the 30 largest German companies, the DAX 30 constituents, is fairly low with 0.19% over the whole examination period from January 1, 1988 to February 28, 2007. During that period a total of 276 events in the DAX30 were recorded. Despite the small number of events, in the five days following an event the probability of further events occurring rose to 4.53%. Events happening within these days are defined as reaction events. This reaction event probability remains stable for DAX30 companies over the whole period studied, although event probabilities are significantly different across the separate sub-periods. The event probabilities in the sub-periods range from 0.06% in the most recent period studied to 0.50% in the “Neuer Markt” period, the most volatile of all examined periods. Simple binomial tests show that probabilities for reaction events are significantly higher than event probabilities in all sub- periods.
For mid- and small-caps as well as for technology stocks the results are similar to those of the large-cap sub-samples. Across all indices event probabilities peak between 1999 and 2003.
NEMAX50 constituents show the highest event probability of all sub-samples with 4.01%. The reaction event probability for those stocks even reaches 16.21% on each of the five post-event
19
days. This means that four out of five NEMAX50 stocks which experience an event record another event within five days after the first price shock. In contrast to NEMAX50 stocks, TecDAX constituents are far less likely to experience events. Although they are still the most volatile stocks in the most recent examination period, their event probability of 0.35% is rather small compared to the 4.01% for technology stocks in the prior period. In this context it is important to note that 24 of the 30 original TecDAX constituents are former NEMAX50 members. Hence, from a more fundamental point of view, event probabilities should have been roughly equivalent for TecDAX and NEMAX50 over the two recent periods.
The event probabilities in all indices are significantly different from each other, whereas the differences in reaction event probabilities are not significant, indicating that if an event occurs, the probability for another event within five consecutive trading days is roughly the same across all indices. The probabilities for events and reaction events in each index can be found in Table 1.
2.3.2. Return Reversals
(Insert Table 2 here) Before 1999
During the first period from 1988 to 1994, in which the sample consisted only of large-caps, average reaction returns to both kinds of price shocks are positive. The abnormal return after price decreases averages a significant 1.75% on the first trading day after an event. Over a five- day horizon this value increases to a significant 2.81% abnormal average return. The reaction to price increases is positive as well, although not significant.
In the following period, starting with the inception of the mid-cap index, the abnormal returns over the five trading days following price decreases (increases) are 3.03% (-0.48%) for large- caps and 2.89% (-1.77%) for mid-caps indicating overreaction.
20 The “Neuer Markt” Era: 1999-2003
Results for the bubbly “Neuer Markt” era suggest overreaction as well. MDAX, SDAX, and NEMAX50 show negative 5-day abnormal returns after price increases, and positive returns after price drops. The majority of these returns is economically and statistically significant.
The recent period: 2003-2007
Mid- and small-caps again overreact. MDAX stocks earn significantly negative abnormal returns of -1.38% (1 day) and -1.51% (5 days) after price increases and positive abnormal returns of 0.78% (1 day) and 1.53% (5 days) after price drops, albeit insignificant. SDAX constituents earn significant abnormal returns after any kind of event, with positive reactions to price decreases and negative reactions to price jumps. The reversals of small-caps in the most recent sample period are the most pronounced reversals of all sub-samples with returns of 3.56% on the post- event day and 4.51% during the five days following a price drop4.
Overall, the significant results speak clearly for the overreaction hypothesis. Although there are differences in the behaviour of the constituents of the respective indices, we do not find persuasive evidence that abnormal returns are driven by a size effect when applying the proper size-adjusted market index. We do not find any signs of overoptimism in short-term reactions to price shocks, either. Therefore, our results are not in line with the findings of Larson and Madura (2003) for the US market and of Ising et al. (2006), who use monthly data of the German stock market. Throughout all periods the reactions to price shocks are asymmetric, meaning that the
4 The DAX30 observations are removed from the last period in Panel B and C due to the very small number of observations.
21
abnormal returns are higher in absolute terms after price decreases. This is in line with earlier findings of Atkins and Dyl (1990) and Cox and Peterson (1994), as well as with the studies of long-term overreaction by DeBondt and Thaler (1985) and others.
2.3.3. Regression Results
2.3.3.1. Model 1
(Insert Table 3 here)
We investigate which factors are able to explain the abnormal 1-day return and the abnormal 5- day buy-and-hold return. In line with our prior findings, size is not able to explain the abnormal return behaviour.
For the abnormal 1-day return there seems to be no clear pattern for all events over the total sample period. However, when recognizing the nature of the event the past return (RET) is more than 2.32 standard errors from zero. RET is negatively correlated with abnormal returns after price increases (Panel B), but positively with abnormal returns after price drops (Panel C) thus canceling each other out in the total sample. This evidence can be interpreted as a reversal effect:
a positive past return diminishes the abnormal event return after a price increase, but adds to the abnormal return after a price drop, and vice versa. This reversal effect also holds for the 5-day buy-and-hold return, however, to a lesser degree.
Other effects seem to have a much stronger impact on the abnormal 5-day buy-and-hold return.
With regards to all events, Panel A reveals that the abnormal event return and past volatility are more than 2.49 standard errors from zero over the total sample period (last column). The volatility (VO) coefficient is negative implying that abnormal event returns are on average lower the higher the pre-event volatility is. A dissection of the total period shows that the results are mainly driven by the period 1994-2003. When further dividing the events, the volatility effect shows up over the total sample period for price increases (Panel B), and to a lesser extent for
22
price drops (Panel C). The abnormal event return itself (ER) is negatively correlated with the abnormal 5-day buy-and-hold return. This pattern seems particularly strong since it holds irrespective of the time period or the nature of the event (price increase or price drop).
2.3.3.2. Model 2
(Insert Table 4 here)
The evidence so far seems to suggest that different reversal effects (RET, ER) and volatility (VO) are able to explain the abnormal event return behavior. However, it is paramount to test whether the results still hold when controlling for size groups. Are the anomalous patterns in abnormal returns marketwide or limited to relatively illiquid stocks representing only a small portion of the market portfolio?
Thus, we sort the events into size-related index groups ranging from big to small stocks, including technology stocks. The reversal effect (RET) within the abnormal 1-day return is particularly robust with respect to size as Panels B and C of Table 4 demonstrate confirming the prior results of Model 1.
(Insert Table 5 here)
Turning to the abnormal 5-day buy-and-hold return, the results clearly show that the reversal effect (ER) is driven by small-caps. The negative sign of the volatility effect (VO) is also mainly due to small-cap stocks and to a lesser extent to mid-cap stocks. The results for the 5-day buy- and-hold return across size groups are far from being pervasive.
2.3.3.3. Further Robustness Checks
Further robustness checks are carried out in this subsection to additionally control for seasonality and to test other variable definitions.
23
Model 3: In Model 3, we take seasonality into account. The main conclusions of Model 1 prevail although some degree of seasonality seems to be present entertaining the notion of market sentiment as a further possible driver.
(Insert Table 6 here)
Other Models: If we alternatively do not use log specifications our main findings stay unaltered.
Likewise, removing the reversal effect (RET) leaves the remainder of the results intact.
We generally exclude BVPS and EPS as regressors from our models to avoid problems with multicollinearity, because BVPS and EPS are already used to calculate BTM and PE.
Nevertheless, we run additional regressions, including EPS as a regressor, too, to ensure a better comparability with earlier findings by Sturm (2003). Whether Model 1 excluding EPS offers a better explanation for the data is decided according to the Akaike information criterion (AIC) and the Schwarz information criterion (SIC). When the two criteria lead to different results, where one prefers the model including EPS and the other does not, we base our decision on the SIC, because the AIC tends to prefer overparameterized models in contrast to the SIC and is therefore inconsistent in selecting the best model5. In the large majority of cases Model 1, that is, the model without EPS as explanatory variable, gave better estimates of stock returns on the days following an event. Hence, in contrast to the study by Sturm (2003), the inclusion of EPS does not improve the explanatory power of the model in our sample sufficiently to justify its inclusion.
2.3.3.4. Summary
Different reversal effects (RET, ER) and volatility (VO) seem to exhibit explanatory power.
However, when controlling for size only a reversal effect (RET) can pervasively explain the
5 For a more detailed discussion of measures of fit, see Diebold (1998).
24
abnormal 1-day stock market reaction to price shocks. There is also some evidence that overall market sentiment could have an additional impact on abnormal returns. This will be an interesting topic for future research.
2.3.4. Trading Strategy Returns
(Insert Table 7 here)
Having documented the existence and an explanation of abnormal returns after price shocks on the German stock market, we examine the practically important question whether it is possible to implement a profitable trading strategy on these short-term anomalies.
2.3.4.1. Uncertain Information Strategies
Strategies of buying any event stock, regardless of the direction of the event would not have earned abnormal returns compared to the passive strategy of buying the index at the start of a period and holding it until the end of the period. Surprisingly, the strategy built on the uncertain information hypothesis would not have earned the highest returns in the sub-samples where the stocks behaved according to the hypothesis but in a sub-sample with significant overreaction, that is, in the mid-cap sub-sample of the “Neuer Markt” era. But even in that sub-sample, in which the strategy would have earned an absolute return of 128.0%, compared to an index return of -27.08%, the strategy would have returned 63.66% less than the index after accounting for trading costs of 0.5% per trade for a private investor. Due to the high trading frequency the absolute returns of the strategy and the returns after trading costs differ immensely.
2.3.4.2. Momentum Strategies
An investor following a momentum strategy would have bought the winners at the end of an event day and have sold them at the end of the following day. For the sub-samples, in which the stocks exhibit momentum, that is, those of large-caps and of NEMAX50 stocks during the
“Neuer Markt”-period, this strategy would have earned positive absolute returns of 114.2% for
25
DAX30 constituents and an astonishing 616.6% for NEMAX50 stocks. The indices lost 49.52%
(DAX30) and 91.83% (NEMAX50) during the same period. After trading costs, the momentum strategy for large-caps still would have earned an abnormal return of 69.88% compared to the index. For technology stocks the huge absolute return before trading costs would have shrunk to an abnormal return of 4.67% after trading costs. Considering the enormous losses of the NEMAX50 stock index during that time period, this equals a loss of more than 85% of the invested capital. Therefore, a momentum strategy could have been successfully implemented for large-caps only.
2.3.4.3. Overreaction Strategies
A strategy of buying losers at the end of the event day would not have earned any abnormal returns throughout all periods compared to the passive strategy of buying the index.
Even for sub-samples with significant return reversals the strategy for most of the time would not have even earned a higher absolute return than the index. Only the reversals of MDAX stocks from 1994 to 1999 and from 1999 to 2003 would have been large enough to generate higher absolute returns of the overreaction strategy with 22.98% and 65.11%, respectively, compared to the index returns of 57.15% and -27.08%. Nevertheless, accounting for trading costs a passive strategy would always have been the better choice compared to an overreaction strategy.
2.3.4.4. Summary
In only two cases out of the 33 sub-samples would an investor actively trading on events have earned higher returns after trading costs than a passive investor investing his money in the index.
The two successful strategies would have been the momentum strategies for large-caps and for technology stocks in the bubbly period from 1999 to 2003. All other strategies would have been unsuccessful in generating excess returns compared to the index. Even the substantial overreaction to negative news, which can be found in all periods for mid- and small-caps, could
26
not have been profitably exploited if the alternative had been an investment in the market portfolio.
Another problem of implementing the indicated trading strategies is that an investor could not have known in advance, which of the three strategies was best suited to the actual trading period, as different strategies would have been the most successful depending on the different sub- periods. Therefore, we can summarize that it is not possible to trade profitably on the reactions of German stocks to price shocks.6
2.4. CONCLUSIONS
First, this study establishes that German stocks which experience an event earn short-term abnormal returns afterwards. We find significant evidence of overreaction. The significant abnormal returns after price shocks do not become weaker over time. Hence, they cannot be explained by a lack of liquidity or the existence of bid-ask spreads. Another finding is that the reaction to price shocks on the German stock market is asymmetric; in other words the absolute values of the abnormal returns after price decreases are larger than those after price increases.
This is in line with earlier findings for the US and other international stock markets. In contrast to longer-term studies we cannot offer evidence of overoptimism on the German market; that is, we do not find simultaneously negative abnormal returns after price increases and price decreases. Unlike others, we do not find that short-term overreaction is a small-firm phenomenon in our German sample, and establish this finding in various ways. Second, we analyse whether some well documented anomalies (e.g., value, momentum) and stock characteristics (e.g., volatility) exhibit explanatory power. Controlling for size, only a reversal effect can pervasively
6 Results for a trading strategy, where event stocks are weighted according to their market capitalization, are not significantly different from those of the equally-weighted strategy.
27
explain the abnormal 1-day stock market reaction to price shocks. Third, abnormal returns of event stocks are not exploitable because the direction of the reaction cannot be foreseen and the existence of transaction costs prohibits the implementation of profitable trading strategies. After all, our robust findings suggest no violation of the efficient market hypothesis.
References
Alonso, A. & Rubio, G. (1990). Overreaction in the Spanish Equity Market. Journal of Banking
& Finance 14, 469-481.
Arbel, A. & Jaggi, B. (1982). Market Information Assimilation Related to Extreme Daily Price Jumps. Financial Analysts Journal 38, 60-66.
Atkins, A. B. & Dyl, E. A. (1990). Price Reversals, Bid-Ask Spreads, and Market Efficiency.
Journal of Financial and Quantitative Analysis 25, 535-547.
Banz, R. W. (1981). The relationship between return and market value of common stock. Journal of Financial Economics 9, 3-18.
Baytas, A. & Cakici, N. (1999). Do Markets Overreact: International Evidence. Journal of Banking & Finance 23, 1121-1144.
Bremer, M., Hiraki, T. & Sweeney, R. J. (1997). Predictable Patterns after Large Stock Price Changes on the Tokyo Stock Exchange. Journal of Financial and Quantitative Analysis 32, 345-365.
Bremer, M. & Sweeney, R. J. (1991). The Reversal of Large Stock-Price Decreases. Journal of Finance 46, 747-754.
Brown, K. C., Harlow, W. V. & Tinic, S. M. (1988). Risk Aversion, Uncertain Information, and Market Efficiency. Journal of Financial Economics 22, 355-385.
28
Conrad, J. & Kaul, G. (1993). Long-Term Market Overreaction or Biases in Computed Returns?
Journal of Finance 48, 39-63.
Cox, D. R. & Peterson, D. R. (1994). Stock-Returns Following Large One-Day Declines:
Evidence on Short-Term Reversals and Longer-Term Performance. Journal of Finance 49, 255-267.
da Costa, N. C. A. (1994). Overreaction in the Brazilian Stock Market. Journal of Banking &
Finance 18, 633-642.
DeBondt, W. F. M. & Thaler, R. (1985). Does the Stock Market Overreact? Journal of Finance 40, 793-805.
Deutsche Börse Group (2010). Leitfaden zu den Aktienindizes der Deutschen Börse, Version
6.14, June 2010, http://deutsche-
boerse.com/dbag/dispatch/de/binary/gdb_content_pool/imported_files/public_files/10_d ownloads/50_informations_services/30_Indices_Index_Licensing/21_guidelines/10_sha re_indices/equity_indices_guide.pdf
Diebold, F. X. (1998). Elements of Forecasting. Cincinnati (Ohio): South-Western College Publishing.
Fama, E. F. & French, K. R. (1992). The Cross-Section of Expected Stock Returns. Journal of Finance 47, 427-465.
Hong, H. G. & Kacperczyk, M. T. (2009). The Price of Sin: The Effects of Social Norms on Markets. Journal of Financial Economics 93, 15-36.
Ising, J., Schiereck, D., Simpson, M. W. & Thomas, T. W. (2006). Stock Returns Following Large 1-Month Declines and Jumps: Evidence of Overoptimism in the German Market.
Quarterly Review of Economics and Finance 46, 598-619.
29
Jegadeesh, N. & Titman, S. (1993). Returns to Buying Winners and Selling Losers: Implications for Stock Market Efficiency. Journal of Finance 48, 65-91.
Larson, S. J. & Madura, J. (2003). What Drives Stock Price Behavior Following Extreme One- Day Returns. Journal of Financial Research 26, 113-127.
Ma, Y., Tang, A. P. & Hasan, T. (1998). The Stock Price Overreaction Effect: Evidence on NASDAQ Stocks. Quarterly Journal of Business & Economics 44, 113-127.
Meyer, B. (1994). Der Overreaction-Effekt am deutschen Aktienmarkt. Frankfurt (Main): Fritz Knapp Verlag.
Mun, J. C., Vasconcellos, G. M. & Kish, R. (1999). Tests of the Contrarian Investment Strategy.
Evidence from the French and German Stock Markets. International Review of Financial Analysis 8, 215–234.
Otchere, I. & Chan, J. (2003). Short-Term Overreaction in the Hong Kong Stock Market: Can a Contrarian Strategy Beat the Market? Journal of Behavioral Finance 4, 157-171.
Pritamani, M. & Singal, V. (2001). Return Predictability Following Large Price Changes and Information Releases. Journal of Banking & Finance 25, 631-656.
Schiereck, D., DeBondt, W. & Weber, M. (1999). Contrarian and Momentum Strategies in Germany. Financial Analysts Journal 55, 104–116.
Stock, D. (1990). Winner and Loser Anomalies in the German Stock Market. Journal of Institutional and Theoretical Economics 146, 518-529.
Sturm, R. R. (2003). Investor Confidence and Returns Following Large One-Day Price Changes.
Journal of Behavioral Finance 4, 201-216.
30
White, H. (1980). A Heteroscedasticity-Consistent Covariance Matrix Estimator and a Direct Test for Heteroscedasticity. Econometrica 48, 817–838.
Zarowin, P. (1990). Size, Seasonality and Stock Market Overreaction. Journal of Financial and Quantitative Analysis 25, 113-125.
31 Table 1: Events and Event Probabilities: 1988-2007
This table shows in a summary statistic the event probabilities (EPs) of all index sub-samples. The whole sample is split into four sub-samples for each time period in order to ensure the comparability of the particular index samples. EP is calculated as the division of the trading days per index by the number of events. The reaction event probability (REP) is calculated as the number of reaction events divided by five times the number of events, because each event that occurs within five trading days after another event is defined as a reaction event. Z-value is the test statistic value of the binomial test of the hypothesis that REP is larger than EP in the respective sub-sample. One (two, three) asterisk(s) indicate(s) significance at the 90% (95%, 99%)-level.
Index DAX 30 MDAX SDAX Technology Indices Total
Sample NEMAX50 TecDAX
Period 1988-1994 1994-1999 1999-2003 2003-2007 1994-1999 1999-2003 2003-2007 1999-2003 2003-2007 1999-2003 2003-2007 1988-2007
Trading Days 47,070 39,240 28,410 30,210 91,560 66,290 50,350 84,422 50,350 47,350 30,210 565,462
Event Days 49 68 141 17 236 473 78 597 99 1,900 107 3,765
Event Probability
(EP) 0.10% 0.17% 0.50% 0.06% 0.26% 0.71% 0.15% 0.71% 0.20% 4.01% 0.35% 0.67%
Positive Event
Returns (Mean) 13.41 12.33 13.80 13.55 13.45 14.03 14.47 15.03 12.94 16.10 14.43 15.14 Negative Event
Returns (Mean) -13.60 -11.68 -12.88 -12.56 -13.52 -13.37 -14.85 -12.90 -13.07 -13.70 -13.62 -13.48
Reaction Events 7 17 35 4 41 180 7 325 14 1,540 21 2,191
Reaction Event
Probability (REP) 2.86% 5.00% 4.96% 4.71% 3.47% 7.61% 1.79% 10.89% 2.83% 16.21% 3.93% 11.64%
Z-value 2.59*** 4.08*** 5.45*** 2.02** 6.03*** 12.63*** 2.44*** 17.83*** 3.53*** 31.38*** 4.25*** 46.90***
![Table 6: Regressions on 34 5,6 7 and 34 5,[6 7;6 8] for Model 3: 1988-2007](https://thumb-eu.123doks.com/thumbv2/1library_info/4650591.1608275/46.892.119.805.280.1105/table-regressions-model.webp)