https://doi.org/10.20378/irbo-52903
Electoral Studies (1992), 11:3, 223-247
Demography and Federal Elections in Germany, 1953-1990-and Beyond
HANs RArnNGER
Universität Bamberg, Lehrstuhl für Politikwissenschaft II, Feldkirchenstrasse 21, IJ.8600 Bamberg, Germany
In recent years growing differences in voting bctween older and youngcr voters have been observed in Gennany. Cohon analytic tcchniques are used here in ordcr to break up such diffcrenccs into thosc that reflcct either life cycle or gcnerational effects on tumout and the votc. Thc clata base is a unique set of official statistics that has been collected in Gennany since 1953 by marking a random sample of ballots according to sex and age of votcrs. The analysis shows that both life cyclc and cohort factors have bad a significant and systematic impact on tumout and the prob- ability of a vote for each party. lt is also demonstrated that the growing polarization by age of the votc for some parties primarily reßccts gencr- ational disparities, not an increased importancc of the lifc cycle. Finally, the impact of such demographic factors on the electoral pcrfonnance of the panies from one Bundestag election to the following one is assessed, and a forecast of thcse effects up to thc year 2006 is presented.
Differences in age among the electorates of German political parties have repeat- edly been observed. In the first wave of the 'Wahlstudie (Election Study) 1987', 1 for example, the mean age of eligible voters was found in a representative poll to be 46.4 years. The average age of CDU/CSU (Christian Democratic Union) voters was exactly 50 years, that of SPD (Social Dcmocratic Pany) voters 45.6, for the FDP (Frce Democratic Party) it was 47.9, and for the Greens 30.5. An exit poll conducted by ·Forschungsgruppe Wahlen' on 2 December 1990, showed that 32.7 per cent of CDU voters were 60 years or older, 23.7 of the SPD and 23.9 per cent of the FDP electorate, but only 3.5 per cent of those who voted for the Greens.
On the other hand, voters under 30 years of age made up only 16.6 per cent of the CDU electorate, 23 of SPD and 17.9 per cent of FDP voters, and 42.7 per cent of those who voted for the Greens. 2
Such observations lead to questions that are relevant not only analytically, but also in practical political tenns. Since in the early years of the Fedcral Republic such dr.unatic age differences in voting were not reported, the first question is whether age has over the decadcs become an important cleavage of Gennan eleccoral politics, and, if so, why. A second key qucstion asks for the consequences that these age differenccs in voting have had, and will have, on the electoral perfor- mance of politicaJ parties over time. These questions cannot be answcred hy methodologically unsophisticated interpretation of a fcw cross-sectional findings.
224 Demograpb)1 and Federal Elections in Gennany
They rather call for a cohort analytic approach, which can separate voting differ- ences by age into those that are attributabJe to the Jife cycle (i.e. to ageing) and those that are due to generational (or cohort) factors, and which requires the use of data for a longer period of time.
An attempt will be presented here to perfonn such a long-tenn cohort analysis of voting for the Gennan case, using the data from representative electoral statistics up to 1990. First, these data will be described. Following that we will report the results concerning the relative importance of these different demographic effects for tumout and the share of votes going to the parties. Only then will it be possi- ble to move from cross-sectional to a dynamic analysis, and to ascertain what bearing these effects have had from one Bundestag election to another. The last step in the analysis will be an attempt to forecast demographic influences on election outcomes up until the year 2006.
The Data
Our data come from representative electoral statistics ('Repräsentative Wahlstat- istik') for the Bundestag elections from 1953 to 1990. We are dealing here with a peculiarity of (West) German electoral statistics that exists since 1953. In certain randomly chosen electoral districts, in which between 3.5 and 4 per cent of eli- gible voters reside, turnout and votes cast are officially registered in tenns of age and sex.3 This is made possible through differentiated imprints on the ballots of the individual sex/age voter groups. Since 1972 tumout and votes have been recorded for ten and five age groups, respectively.4 The large size of the sample virtually eliminates sampling errors. Tbc data are further strengthened by the fact that they come not from interviews, but from the actual ballots. Therefore, cenain problems of reliability and validity, such as the unwillingness of some people to reveal their voting to an interviewer, do not exist.
The data have already been described and summarized several times (Jesse, 1975, 1987). In addition, they have also been used to correct polling results for forecast- ing purposes (Rattinger and Ohr, 1989). Surprisingly enough though, a more inten- sive study has not yet been performed on the data, in spite of the fact that they are also extremely weil suited for other types of analysis, for example, of split-ticket voting. No attempt at a systematic separation of cohort and age effects (such as is our intention here) has ever been undertaken with these data.
From the official representative electoral statistics a data set was created as follows: for each of the eleven Bundestag elections 1953-90, turnout and voting results were assigned to every age-Jevel, year by year, starting with voting eligibility up until and induding 90 years of age. This was done boch for grand totals as weil as separ.ttely for men and women. The reason for this upper age Jimit is that popula- tion statistics in Germany end with a category '90 years and older·. These data for the individual Bundestag elections were joined together, yielding a total number of 788 cases: 70 for each election 1953 through 1969, when the voting age was 21.
and 73 for each election 1972 through 1990, when it was 18. In order to capture generational or cohort affiliation. age plus 0. 5 was subtracted from the date of the respectivc clection, thus approximating mcan year of binh for cach age at each election. This assumes. naturally. that hinhs are uniformly distribute<l throughout the calendar year. ßecause this estimated mean year of hirth is a linear function of age. it <loes not provide any additional information. and cannot be directly entered
HANs RArnNGER 225 into cohort analytical models. Therefore, ten of these mean birth years were collapsed into one birth decade. Such birth decades were defmed for those persons bom in the 1860s (1860-69), 1870s, etc., up untU the 1970s.
Besides age and cohort effects the basic cohort analytical model posits period effects, that is, effects which in.fluence all people equally during a certain time pcriod, regardless of age or cohort afftliation.5 Such period effects could simply be expressed as a function of the election year. This, however, would assurne linearity or trends of a higher order. lt is much more realistic to assume that certain period effects are at band, which are specific to a given elcction, and are not subject to any trends. In order to grasp such effects, a zero/one dummy variable was created for each Bundestag election.
For cohort analyses with this data base the cases have to be weighted, since age levels are unevenly filled, in accordance with the population pyramid. Analyses of turnout have to be weighted by the number of eligible voters of each given age, and analyses of vote distributions by the number of thosc of a given age who actually cast their vote. In order to achieve such weighting, end-of-year data on the age distribution of the Gennan population (both total and separately for male and female) closest to each election were integrated into the data set. The population data cannot, however, be directly applied for weighting, since the total number of eligible voters has changed considerably over the period of this study. If raw popu- lation data were used, elections with a higher number of eligible voters would go into the calculations with greater weight than elections with fewer eligible voters.
Therefore the mean number of persons of each age was calculated for each election, and the population data for the individual ages were divided by this average. The weights which result from these calculations were uscd for all analy- ses of tumout; for each election they average one.
Tue number of voters of each age is needcd for weighting analyses of vote distri- butions. One could calculate this by multiplying the number of people of each age by tumouc, as provided by the official represcntative electoral statistics. This would lead, however, to considerable miscalculations, as the grouping of turnout into ten age categories yields a distorted picture of the differences between different ages.
This would not be much of a problem at middle age, where tumout rates barely change. Considering, however, the well-known phenomenon of increasing tumout in the ftrst decade following eligibility, and the marked decrease at higher age, it is clear that the use of the original data would cause some problems. lt would be assumed, for example, that 70 year old people have the same turnout as those 90 years and older.
Therefore, in order to estimatc the number of voters, tumout for each age was approximated as follows: first the weighted mean age was calculated for each age category used in the official electoral statistics of turnout. lt was then assumed that within the age category lying in the middle of the distribution the change of tumout with age could be approximated as the mean of the tumout differences between this class and the adjacent lower and higher age categories. Finally, approximate values of tumout at each individual age in the adjacent higher and lower age dasses were detennined by an iterative procedure, such that the curve was forced through each respective weighted mean dass age, and that tumout rates were identical for two neighbouring ages that belong to different age categories.
This produces a highly plausible distribution of approximate tumout by age (Fig.
1) which satisfies the criterion that mean turnout (weighted by population) in each
226
95
90
t1P 75
70
65
60
\ 1
\
Demograph)• and Federal Elections in Gennany
- · - 1953 - - - 1957 -···-1961
• • • • 1965 - - 1969 - - - 1972 .... ··· 1976 --- 1980 - · · -1983 - · - 1987 - - - 1990
55 ______ __. ____________________________________________________ ___
18 22 26 30 34 38 42 46 so 54 58 62 66 70 74 78 82 86 90
Age
FrG. 1. Approximate turnout by age, 1953-1990
age dass must be identical with the official statistics. Multiplying this approximate tumout for each age by the corresponding population figure yields an estirnate of the absolute number of voters for that age. Weights for the analyses of vote distri- butions among the panies can then be calculated (analogous to the procedure described above), so that for each election the tumout pattems according to age will be taken into account through weighting, and each election will enter into the model estimations with the same weight.
This data base is subject to the following problems and limitations:
1. The data base (and therefore the analysis) is restricted to the fonner Federal Republic, nor including West Berlin. Data for all of united Germany are available for the election of 1990. but cohon analysis wich only one point of measurement is impossible.
2. Bavaria, Rhineland-Palatinate and Saarland did not take part in the collection of representative ekctoral stalistics in 195~; Saarland did not yet participate in 1957.
3. Since the representative electoral statistics are collected in voting districts, they cannot include absentee ballots. The proportion of such ballots has markedly increased over th<: years, anti th<: abs<:ncc of such ballots from the <lata could lead to errors if there is a difference in votin~ behaviour (with respect to cohort. agc and period efJects) between absentee voters and those who cast their ballots in person.
HANS RA.ITINGER 227 4. Due to lhe nature of the population statistics persons over 90 years of age are treated in the data as if they were 90 years old. The numbcr of such cases is low, however, and so it is expected that this will have very little bearing on the analyses.
5. The year-end population statistics used here include ehe residents of West Berlin, who were not eligible to vote in the Bundestag elections prior to 1990.
Minor errors could then occur should there be a deviation in the age structure between West Berlin and the rest of lhe former Federal Republic.
6. These population statistics also include the foreign population of Germany, which is noc eligible to vote. Minor errors could come about as a result of differ- ences in age structure between Germ ans and foreigners living in Germany, especially as the proportion of foreigners in the population has changed consider- ably throughout the years.
Age, Cohort and Period Effects on Turnout
The approximated tumout rates of individual ages (Fig. 1) were employed for calcu- lating age, cohort and period effects on tumout. Our procedurc was as follows: in a first step, tumout rates (total, male and female) were regressed on lhe dummy variables for Bundestag elections, then on those for birth decades, and then on both sets of dummy variables. In the second stage, age and various arithmetic transfonna- tions of age were entered into the regression models in a stepwise routine, such that only statistically significant variables were allowed into the models (these transfor- mations are the second to fifth power of age, the square root, the natural logarithm, the exponential, and the arc tangent of age). Tue residuals from the final models were saved, and regressed once again on age and all transfonnations of age just listed, this time with all age variables having been previously multiplied by the distance in time from the Bundestag election of 1953. This procedure allows a detennination as to whether age effects change over time. A simultaneous estimation of a possible modifi- cation of age effects over time in the fll"St stcp of the analysis is impossible due to multicoUineatity, which is an inevitable complication of cohon analysis. lf cohort and time-dependent age effects were to be estimated simultaneously, the Ianer would absorb much of the explanatory power of cohort membership. lt is thus necessary that the cohort effect be flxed when time-dependent age effects are to be estimated.
The results of these computations are reproduced in Tables 1 and 2 and in Fig.
2 and 3. Table 1 shows that all three factors have a very strong influence on tumout.
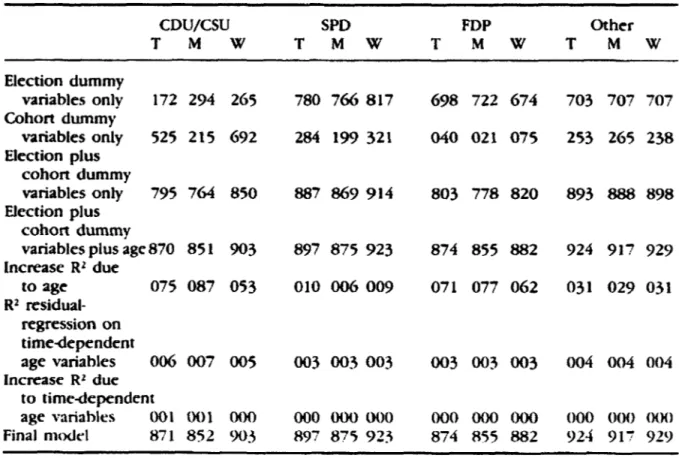
TADLE 1. Agc, cohon, and period effects on tumout (RZ•IOOO)
Election dummy variables only Cohort dummy variables only
Election plus cohon dumrny variables only Election plus cohort dummy variables plus a~c Increase R ! due to agc
Ri residual·regression on time-dependent age variables lncrease R z due to time-de pendent age variables Final model
Total 336 473 673 926 014 253 001 927
Men 337 559 761 917 025 156 002 919
Women
304 463 659 9'.'16
_,. ,~~
001 Oll 937
228 Demograpby and Federal Elections in Gemiany TABLE 2. Net effects of period and cohon on tumout (deviation from the grand mean in percentage points) Net effect period
Year Total Men Women
1953 0.0 0.3 -0.3
1957 1.2 1.8 0.6
1961 0.7 1.1 0.2
1965 -1.1 -0.4 -1.6
1969 -1.1 -0.6 -1.5
1972 4.1 3.9 4.3
1976 3.9 3.3 4.2
1980 1.4 0.9 l.9
1983 2.4 1.9 2.9
1987 -2.7 -2.9 -2.5
1990 -8.8 -9.3 -8.2
Net effect cohon
Binh-decade Total Men Womcn
1860 -7.2 -3.8 -14.2
1870 -6.3 -3.1 -10. I
1880 -3.5 -1.4 -4.7
1890 -1.6 -1.3 -1.5
1900 -0.7 -1.2 -0.2
19IO 0.3 0.2 0.5
1920 1. 5 1.4 1.5
1930 1.4 1.0 l.6
1940 0.6 0.1 l.2
1950 -0.9 -0.6 -1.2
1960 -2.8 -1.8 -4.4
1970 -3.0 -2.3 -5.5
Average net eff ect cohon
Year Total Men Women
1953 -0.6 -0.4 -0.8
1957 -0.3 -0. l -0.4
1961 0.0 0.1 0.0
1965 0.2 0.2 0.3
1969 0.4 0.2 0.5
1972 0.3 0.2 0.5
1976 0.3 0.2 0.5
1980 0.2 0.1 0.2
1983 0.0 0.0 0.1
1987 -0.2 -0.2 -0.3
1990 -0.4 -0.3 -0.6
Period and cohort eff ects together explain over two-thirtls of the variance in total tumout, even more for males. Takin~ age effects into account leads to an expla·
nation of weil on:r 90 per Ct"nt of tot;ll variance. On the other hand, the time- dependent age effect does not have any additional explanatory power. Thus it can be concluded that throughout the history of the fom1er Federal Republic the effect of the ageing process on tumout has been fairly uniform.
HANS RArnNGER
6 ,,,.""' _...---... , ...
/ '
/. '
~
',
2 ' ' \ \
\ \
\ 229
o~----~~---,,.,c...,'+---0:,:-'lr----"(-
/ / \ \
, / \
, I \
/ / \
/ / \
<:IP -2
, / \
, \
/ / \
, / \
, \
/ / \
/ / \
, / \
' ---Total \
, / \
/ / - - - Men ,
/ --- Women \
-6 -8 \
-10'---"----'--_.,j"----1--_.l.--_.1.---1.---!>-_---"'~-..&.:---~--~--~--~--..._-- 18 22 26 30 34 38 42 46 50 54 58 62 66 70 74 78
Age
Fm. 2. Net effect of life cycle on tumout
Tue net effects of periods and of cohon membership ace presented in Table 2.
They were computed by weightlng and averaging the respective elements of the regcession models over elections and birth decades, and then subtracting the weighted grand mean. These results show that there is very little difference between males and females with respect to period effects. The Bundestag elections of 1965 and 1969, and again those of 1987 and 1990, were characterized by negative period effects; those elections from 1953 to 1961, and from 1972 to 1983, showed positive period effects, which were especially strong in 1972 and 1976.
Examination of tumout of individual cohons reveals considerable differences between men and women, especially those bom before 1890 and after 1959. For these cohons tumout was markedly lower among women. Persons bom between 1910 and 1949 had rates of tumout above average. These age groups are very strongly represented throughout the period of this study; they made up more than half of the eligible voters in the elections from 1957 to 1990, and reached a maximum of 72.3 per cent of the electorate in 1969.6
If one computes weighted averages of net cohon effects for each election (that take into account the distribution of voters over binh decades) a clear picrure emerges of the effects of changes in the cohort composition of the electorate on tumout (bottom pan of Table 2). lt increased from 1953 to 1969 because older generations that were less likely to vote disappeared, while at the same time new cohorts with high tumout rates entered the electorate. This trend reversed itself, beginning in 1972, as (now older) cohorts with above average tumout began to suffer attrition, while the young voters coming in (especially those bom in 1960 and after) were characterized by below average tumout.
230
6
2
dP -2
-4 -6 -8
DemograPb.J' and Federal Elections in GermanJ'
-··--- ··--
„---....
- - - Total
- · - 1953 - ---- 1990
-„- 1990 minus 1953
. '
~\ ·~,\
. \
~\ . \
~ '
-10.__ ___ ...,...___..____, __ __. __ __,'"--_________ __. _ _.. ____ __,_ _ _.. _ _._~
18 22 26 30 34 38 42 46 so 54 58 62 66 70 74 78
Age
F1G. 3. Time-dependent net effect of life cycle on tumout
Fig. 2 shows the pure life cycle effect, that is, the net effect of age on tumout.
The pattem of this relationship, which resembles an upside-down parabola, is weil knawn, not only for Germany. There is, however, a very noticeable difference between men and warnen. Though both have belaw average tumaut at younger age, that of women is less so than that af men, and women earlier in the life cycle reach above average leveJs. On the other hand, warnen also reach their maximum tumout in life earlier than men, and then drop more quickly below average. Women over 72 years old usually turn out below average, whereas for rnen belaw average values occur for agc 80 or aJder.
Fig. 3 illustrates just how little the life cyde effect on turnaut changed between 1953 and 1990. The displacernent of the curves for these two years vis-tl-vls the aggregate curve is abave all a matter of a parallel shift, conditioned by the change in the age structure between the two years: relatively speaking, there were less eligible rniddle-aged vaters in 1990 as compared with 1953, as weil as a larger praportion of older voters. The greatest deviation hetween the curves for 1953 and 1990 is visible for very young voters and those over 60 ycars of age. In the case of the former, life cycle specific voting abstincnce seems to have somewhat decreased from 1953 to 1990, whereas for the latter the retention of higher tumout has shifted in the direction of older age.
Age, Cohort and Period Effect.c; on the Distribution of Votes
All estimations of ehe various effects on the electoral performance of the parties were c:onducted analogous to the procedure for turnout. l11ere was one tlifferenct:.
HANS RATI1NGER 231 however. For this analysis of party vote shares, original data from thc representative electoral statistics were used as the dependent variable (instead of interpolated values, as for turnout). Before presenting the results it must be pointed out that an analysis for the Green Party is impossible, although it would be extremely interesting in light of its failure to retum to the Bundestag in 1990. Howcver, since the Greens have only run in four of the eleven elections dealt with here, no reliable analysis of age and cohort eff ects is feasible.
Whereas cohort effects on tumout proved to be stronger than period effects, the reverse is true for party perfonnance. In fact, period effects are (with the excep- tion of the CDU/CSU) by far the most important (fable 3). Such effects, specific to the respective elections, are responsible for between 70 and 80 per cent of the variance in the vote shares for the SPD, the FDP, and all other parties combined.
Only for the CDU/CSU do period effects play a much smaller role. Cohon effects are weakest for the FDP, but most pronounced for the CDU/CSU, where these effects alone explain a much larger proportion of variance than do period effects.
However, a very strong difference between the sexes is apparent here: the perfor- mance of the CDU/CSU among males is more dependent upon period effects than on generational factors; among women it is exactly the opposite. All other parties show only minor sex differences in ehe importance of period and cohon effects.
In the case of turnout the introduction of age led to a substantial increase in the explanatory power of the cohon analytical model. This is not nearly the case for party vote shares. The smallest increase can be seen for the SPD, followed by the combined 'other' parties. On the other hand, for the CDU/CSU and the FDP the
TABLE 3. Age, cohoat, and period effects on party vote shares (R2•1000)
CDU/CSU SPD FDP Other
T M w T M w T M w T M w
Election dummy
variables only 172 294 265 780 766 817 698 722 674 703 707 707 Cohort dummy
variables only 525 215 692 284 199 321 040 021 075 253 265 238 Election plus
cohort dummy
variables only 795 764 850 887 869 914 803 778 820 893 888 898 Election plus
cohort dummy
variables plus age 870 851 903 897 875 923 874 855 882 924 917 929 lncrease R z due
to age 075 087 053 010 006 009 071 077 062 031 029 031 R2 residual-
regression on time-dependent
age variables 006 007 005 003 003 003 003 003 003 004 004 004
lncrease RZ due to time-dependent
age "Variables 001 001 ()()() 000 000 000 000 000 000 000 000 000 Final modd 871 852 903 897 875 923 874 855 882 924 91! 929 T: Total
M: Men W: Women
232 Demograpby and Federal Elections in Gennany
increment in explained variance is quite visible, and of the same order of magni- tude for both parties. The additional introduction of time-dependent age variables yields even Jess of an increase in explained variance than was the case for tumout.
Thus the conclusion can be drawn that throughout the history of the fonner Federal Republic age effects on voting have remained rather constant.
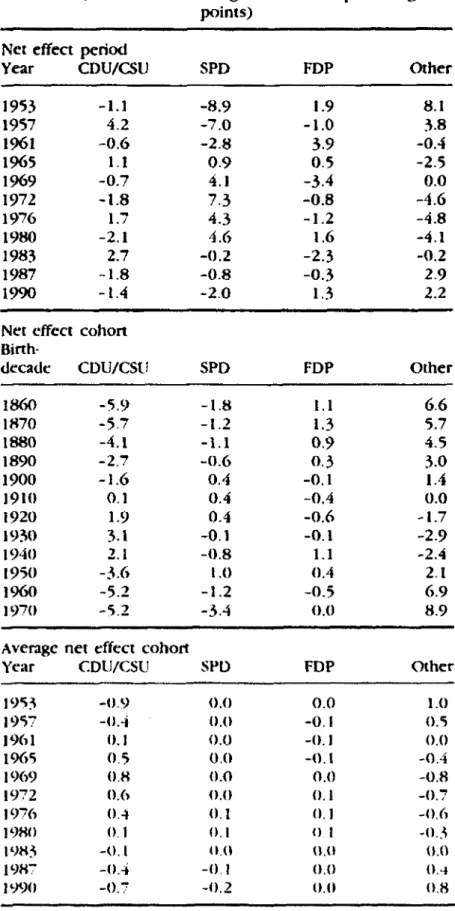
TABLE 4. Nel effects of period and cohort on pany vote shares (deviation frorn thc grancl mean in percentage
points) Net effect period
Year CDU/CSU SPD FDP Other
1953 -1.] -8.9 1.9 8.1
1957 4.2 -7.0 -1.0 3.8
1961 -0.6 -2.8 3.9 -0.4
1965 1.1 0.9 0.5 -2.5
1969 -0.7 4.1 -3.4 0.0
1972 -1.8 7.3 -0.8 -4.6
1976 1.7 4.3 -1.2 -4.8
1980 -2. l 4.6 1.6 -4.l
1983 2.7 -0.2 -2.3 -0.2
1987 -1.8 -0.8 -0.3 2.9
1990 -1.4 -2.0 1.3 2.2
Net cffect cohort Birth·
decadc: CDU/CSU SPD FDP Ocher
1860 -5.9 -1.8 1.1 6.6
1870 -5.7 -t.2 1.3 5.7
1880 -4. l -1.1 0.9 4.5
1890 -2.7 -0.6 0.3 3.0
1900 -1.6 0.4 -0. l 1.4
1910 0.1 0.4 -0.4 0.0
1920 1.9 0.4 -0.6 -1.7
1930 3.1 -0.1 -0.l -2.9
1940 2.1 -0.8 1.1 -2.4
1950 -.3.6 1.0 0.4 2.1
1960 -5.2 -1.2 -05 6.9
1970 -5.2 -3.4 0.0 8.9
A veragc net dfect cohort
Year CDU/CSU SPD FDP Other
195~ -0.9 0.0 0.0 1.0
1957 -0.4 0.0 -0.1 0.5
1961 0.1 0.0 -0. I 0.0
1%5 0.5 0.0 -0.1 -0.4
1969 0.8 0.0 0.0 -0.8
1972 0.6 0.0 0.1 -0.i
1976 0.4 0.1 0.1 -0.6
1980 (). 1 (). 1 01 -0 .. ~
1983 -0.1 0.0 0.0 0.0
198'7 -0.4 -0. I 0.0 0.-4
1990 -0.7 -0.2 0.0 0.8
233 The election specific period cffccts' on party vote shares do not show a common pattem (Tablc 4). No clear trends are rccognizable for the CDU/CSU and the FDP.
A pennanent up and down is the rule, although gains of one of these panies are often accompanied by losses of thc other. This is a reflection of exchange processes between thc two bourgeois parties from one election to another. For the SPD the period effects mirror the 'comrade trend' from 1953 up until the culmination in 1972. after which a downward trend began. For all 'other' parties combined the opposite is truc. The period effects show at first a down ward trend du ring the time of the 'electoral miracle' which followed the economic mirade, as such parties van.ished from thc political scene. The period effects between 1965 and 1980 give a good picturc of the heyday of the 'two-and-a-half party system'; a sUght deviation being caused here by the success of ehe National Democratic Party (NPD) in the Bundestag election of 1969. Tue favou.rable perfonnance of the Green Party in the elcctions of 1983 and 1987 is recordcd by the rcversal of this downward trend during the 1980s.
An examination of the cohort effects reveals an above aver.tge attraction to the fl)P and 'other' parties on the part of those voters bom befo~ 1900 (to the detri- ment of the two major panies). The three birth decades of those bom between 1910 and 1939 exhibit an opposite effect-an above average tendency towards the two main parties (especially the CDU/CSU). and below average inclination towards the FDP and other parties. The positive cohon effect for the CDU/CSU is most pronounced among those voters bom in the 1930s. Of all birth decades this group made up the largest proportion of voters in the Bundestag elections between 1961 and 1987 (between 18 and 21 per cent). A stable pattem is not ascertainable for the younger generacions of voters. For those bom in the 1940s, the aversion against the other parties still is almost as strong as for those bom in the 1930s. Here, however, suppon for the SPD is below average, whereas the CDU/CSU and especially the fl)P enjoy above averagc success. The 'fall' of the CDU/CSU and the 'risc' of the combined 'other' parties begin to set in with those voters bom in the l 950s. The SPD and FDP maintain their above avcragc shares in lhis most 'social-liheral' of all cohorts. FinaJly. the two major parties receive below average votes from the most recent cohorts (bom in the 19(.,0s and l 970s);
this is especially true for the CDU/CSU. On the other band, among these youngest generations the highest of all positive cohort effects are obtained for the combined 'other' panies.
For this author the most remarkable ftnding of this survey of cohort effects is the clearly above average preference for thc CDU/CSU of those bom between 1920 and 1949. coupled with their aversion against the founh parties. These three binh- decades also distinguish themselves by the highest levels of tumout (fahle 2). From 1965 to 1983 more than half of those who voted in Federal elections belonged to this group, and for 1987 and 1990 thesc figures still were 49.9 and 49.4 per cent, respectively. ßoth higher tumout and preference for the CDU/CSU can be explained by the sociaJization experiences of these cohons. All of them grew up either during the Third Reich, the Second World War, the post-war period, or during the yeat"S of the econornic miracle, and after 19·fi had their first opportunity to vote in frc:-e clcctions. All of them eilher experienct:d the <larkest vears of German historv or ' .
the immediate aftermath first band, or eise wcrc during their ycars of socialization in the early pcriod of the Federal Republic still strongly affected by it through thcir parent genei-.ition.
234 Vemograpby and Federal Electiom in Gemumy
This clearly acted as an important prerequisite for intemalizing the democratic nonn to turn out ('Wahlcecht=Wahlpflicht' is the Gennan shorthand). As far as party preference is concemed, the CDU/CSU became known to these cohorts as the party of the economic miracle, the first two-denominational Christian peoplc's party in Gennany, but also the only really new political party in the new republic.
AJI of the other parties carried on traditions from the Weimar Republic and earlier, in many cases even in their names. By contr.tst, these traumatic historical experi- ences did not play as much of a role in thc socialization of those Germans bom later, and as a result the CDU/CSU came to be seen by such voters no langer as a
·new' party, but rather a.~ an established party which bad been continuaJJy in power. In this regard a parallel can be seen betwcen the above average affinity for the CDU/CSU on the part of thosc born between 1920 and 1949, and that of those bom 1960 and later for the ·other' parties (mostly the Greens, of course): ·new' parties (with new issues, that arc relevant for thc respective generations) seem especially to attract younger and first-time voters, and this attraction can prove to be resistant against changes during the Jife cycJe, as these exceptionally CDU/CSU- friendly age groups illustrate.
If we calculate the weighted average of cohort effects for individual elections, we sec that the age composition of the voters had virtually no impact on the perfor- mance of the FDP and SPD. Such is not the case for the Christian Democrats: 1953 and 1957 the age composition of voters was still disadvantageous for thcm, from 1960 to 1980 the age structure of the electoratc led to above aver.tge shares of the votes. Tlu: pinnade of this process was reachcd in 1%9. Since 1983 the cohort composition of the elector.lte has been tuming increasingly against the CDU/CSU, as 'friendly' agc groups exit and are rcplaced by votcrs less well disposed towards this party. For thc combined 'other' partics the cohon effects over time nm in exactly the opposite direction. They experienced above average elector.d success in the l 950s not only as a result of election specific effccts, but also because older cohorts still in the electorate at that time were especially attracted to them. The composition of the electorate in the I 960s and 1970s led to hard times for these parties, and in the l 980s they benefited from a reversal of this trend.
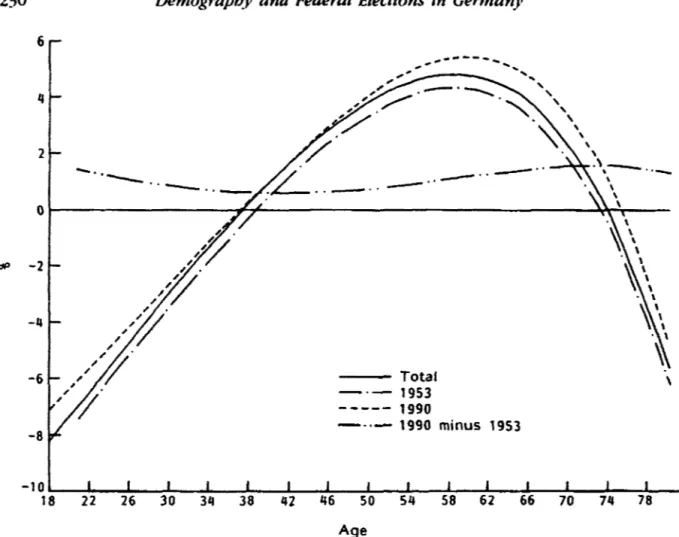
Due to the large numbers of categories, graphic presentation of life cycle cffccts on the distribution of votes among the parties again is appropriate. Fig. 4 shows this effect on the electoral prospects for the CDU/CSU. For each age, the deviation of the CDU/CSU share of the votc from the grand mean ( controlling for period eff ects and generational affiliation) is reproduced, analogous to Fig. 2 and 3 for tumout. To put it another way: Fig. 4 shows how strongly below or above average the probability of a vote for the CDU/CSU lks at each age, where thc avcragc of thcsc deviations (weighted by thc number of voters at each age level) equals zero.
Below averclge suppon. for the CDU/CSU is found among voters up until 50 years of age; above average support is found among thosc SO years and older. Among younger voters the probability of casting a vote for the CDU/CSU first decreases with incrcasing age, reaching a minimum between the ages of 30 and 35. Thcre- after a vote being cast for the CDU/CSU bccomcs morc likcly with growing age.
This age dkct is noticcably wt.>aker ;1mong men than among women: youngcr mcn rejn·t the CDU/CS\ 1 less str<>n1tly than younger woml·n do. ;111d with age the temlency of women eo vote t'C.>r this party gcts even more above avt:rage than thal of men. As has alrcady bccn mentioned, the calculation of a time-dependent a~e effect did not contribute any ~rcat additional cxplanatory power lO the m0<.lel.
8
---Total
6 - - - Men
--- Women -·-1953 ... „. 1990
1
-2 - - - - -...
' ' .... ,
_„ ..... ,.: .. :~· „ ... ...... " ... .
~
--
-----HANS RAlTINGER
Age
F1G. 4. Net effect of life cycle on CDU/CSU vote share
235
However, it appears that the tendency of younger voters towards below average suppon for the CDU/CSU has somewhat increased from 1953 to 1990.
The age effect on SPD voting runs in exactly the opposite direction (Fig. 5). The probability of such a vote decreases monotonously with growing age. This decrease occurs very quickly at the beginning, reaching average probability at around 44 years of age, thereafter the probability of a vote for the SPD is below averagc. The loss of votes due to increasing age is considerably more pronounced among women.
Younger women turn out for the SPD more above average than men of the same age, and older women vote SPD more strongly below average than older men. The age at which above average support for the SPD tums into below average support shifted downward between 1953 and 1990. that is, the curve for 1990 slopes downward sceeper at the beginning, and is flatter at the end, than the curve for 1953. In other words: the probability of a vote being cast for the SPD decreased especially among voters of middle age (35 to 55) between these two elections.
The age etiect for the FDP shows a totally different pattem (Fig. 6). Average to slightly below average votes for the FDP char.icterize the youngest voters. Above average shares of the vote bcgin at just below 30 years of age, an<l the maximum is rea<.·hed at a littlc over 40. Thereafter the FDP percentage decreases monoconously with growing agc, moving below avcrage at around 60 years of age.
While at each given time the CDU/CSU is more the party of ol<ler peoplc. and the SPD the party of younger voters, the FDP is the party of middle age. Men and women differ here systematically as weil. Younger women vote above average for the FDP more strongly than men of the same age, an<l at greater agc the
236 Demograpby and Federal Elections in Gennany
5
---Total - - - Men --- Women -·-19SJ
3 .. „ .. „.„. 1990
2
-1 . · ... ;:....::--... ·„ ... _
-- -- --
-„ ... ~--
:-:---- -2-~
Age
F1G. 5. Net effect of lifc cycle on SPD vote share 1.5
1.0 --
o.s
-0.5
-1.0
---Total - - - Men --- Women
-1.S - · - 1953
.... „„.„. 1990
Age
F1c;. 6. Net effe<.'t of life cycle on fOP vote share
3 2
1
-1
-2 -3
···
...
---Total - - - Men
--- Women
-·-1953
... „ ..•.... 1990
HANS RA.mNGER 237
-q.__ __ -'-__ _._ ____ ..__ __ -'-__ _._ ____ ..__ __ ..._ __ _._ _ __..._ __ -'-__ _._ _______ ..._
18 22 26 30 34 38 112 46 Age
so S8 62
F1G. 7. Net effect of life cyde on vote share of 'othcr' parties
66 70
relationship is cxactly thc othcr way around. The calculation of a time-dependent age effect, finally, leads to the conclusion that the aversion of the youngest voters against the FDP has disappeared to such an extent between 1953 and 1990 that the earty phase of the life cycle now is no longer characterized by below average FDP voting.
The age curve for all 'other' partics combined is similar to that for the FDP (Fig.
7). The major diffcrences are that the vote for thesc parties is below average among very young voters, and that the maximum above average percentages are reached considerably earlier in the life cycle (betwcen around 30 to 35 years of age). Below avcrage values are then reached again earlier in the ageing process. There are barely any differences here between men and women. Only at a greatcr age can it be seen that men vote for these parties more strongly below average than women. Tue most notablc change between the beginning and end point of our period of analysis is an increased tcndency of middle-aged persons to vote for these 'other' parties.
Polarization of Voting Behaviour by Age
These results allow us to see age differences in voting behaviour in a new light.
Such differences are often reported and commenred upon. However, withom the analysis conducted here it is impossible to separate them into those elements which can be attributed either to age or to membership in particular generations.
Lacking such an analysis there is the very real danger that increasing diff erences
238 Demograph)• and Federa/ E/ectlons i11 Gennany
20
- - - CDU/CSU - - - SPD
15 --- FDP
- · - Others 10
s
-·--·-·""'·
oi---~---
.... _ ... „„, __ - -----~\--- - -- ---- - ----·-· - - - --- --- - ---- ---
-s
---- ---
---~ '--·-·---.
... / / ----10 '--·-·-... ...
1957 1961 1965 1969 1972 1976 1980 1983 1987 1990 Year
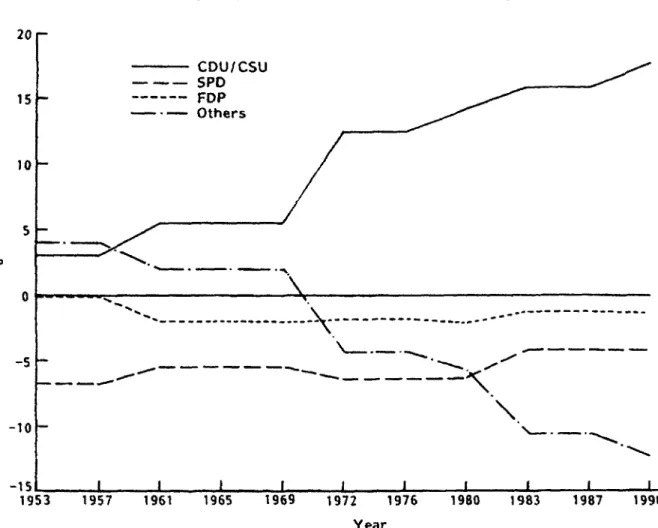
frG. 8. Pany vote shares for 70-year-old minus for 21-year-old voters
in voting patterns among different age groups get misinterpreted as growing polar- ization of voting behaviour within the life cycle, even though this developmem might have in reality been caused rnore by polarization between different gener- ations of votcrs.
Bascd upon the analysis pursued herc we can avoid this danger. From the estimated cohort analytic models we can derive predictions for the distribution of votes among parties for each election and age level. In addition, partial predicted values can be computed from either the age or the cohon portion of the model.
Thus it can be determined for any two age Jevels for any election to what extent their deviation in the vote can be attributed either to differences in age or to membership in different birth cohorts. The results of such calculations are presented in Fig. 8 and 9.
Fig. 8 depicts the total differences in voting behaviour between 21 and 70-year·
oJd voters. Keeping in mind our earlier findings conceming the net effects of age and cohort membership on the proportion of lhe voce for the FDP, it is not surpris- ing that a clear polarization of voting by age cannot be detected for this party. Up until 1957 there was no difference between 21 and 70 year olds in the FDP vote, whereas after 1957 the proportion of the vole going to the FDP was one to two percentage points Jower among the latter. This can be attributed mainly to th<."
negative age effect. Until 1957 this dfect was compensated for among oJder votc:rs by a positive cohort effect, but in later dections this was no longer the case (Fig.
9).