Properties of the Hematopoietic Transcription Factor PU.1
DISSERTATION ZUR ERLANGUNG DES
DOKTORGRADES DER NATURWISSENSCHAFTEN (DR. RER. NAT.) DER FAKULTÄT FÜR BIOLOGIE UND VORKLINISCHE MEDIZIN
DER UNIVERSITÄT REGENSBURG
vorgelegt von
Julia Minderjahn
aus Regensburg
im Jahr 2018
Properties of the Hematopoietic Transcription Factor PU.1
DISSERTATION ZUR ERLANGUNG DES
DOKTORGRADES DER NATURWISSENSCHAFTEN (DR. RER. NAT.) DER FAKULTÄT FÜR BIOLOGIE UND VORKLINISCHE MEDIZIN
DER UNIVERSITÄT REGENSBURG
vorgelegt von
Julia Minderjahn
aus Regensburg
im Jahr 2018
Die vorliegende Arbeit entstand in der Zeit von Mai 2013 bis Oktober 2018 in der Klinik und Polyklinik für Innere Medizin III des Klinikums der Universität Regensburg.
Das Promotionsgesuch wurde eingereicht am: 05.10.2018
Die Arbeit wurde angeleitet von: Prof. Dr. Michael Rehli
Unterschrift:
______________________________
(Julia Minderjahn)
“Ever tried. Ever failed. No matter. Try Again. Fail again. Fail better.”
(Samuel Beckett)
Table of Contents
1 SUMMARY ...1
2 INTRODUCTION ...3
2.1 Chromatin Accessibility & Transcription ...4
2.1.1 Chromatin- & DNA-Modifications ...4
2.1.2
Cis-regulatory DNA Elements ...62.1.2.1 Promoters ...6
2.1.2.2 Enhancers, Silencers & Boundary Elements ...7
2.1.3 Transcription Factor Binding & Chromatin Remodeling ...9
2.2 The Master Regulator PU.1 ... 15
2.3 Objectives ... 19
3 MATERIAL AND EQUIPMENT ...20
3.1 Equipment ... 20
3.2 Consumables ... 21
3.3 Chemicals ... 22
3.4 Enzymes and Kits ... 22
3.5 Antibodies... 23
3.6 Molecular Weight Standards ... 24
3.7 Oligonucleotides ... 24
3.7.1 Primer for Cloning Experiments and PCR ... 24
3.7.2 Primer for Sequencing ... 24
3.7.3 qPCR-Primer for ChIP ... 24
3.7.4 Primer for Library Preparation ... 25
3.7.5 Oligonucleotides for Motif Affinity Measurements ... 25
3.8 gBlocks
®Gene Fragments ... 25
3.9 Antibiotics ... 28
3.10 Plasmids ... 28
3.11
E.coliStrains ... 29
3.13 Databases and Software ... 29
4 METHODS ...31
4.1 General Cell Culture Methods ... 31
4.1.1 Cell Line Culture ... 31
4.1.1.1 Cell Culture Conditions and Passaging ... 31
4.1.1.2 Assessing Cell Number and Viability ... 31
4.1.1.3 Freezing and Thawing Cells ... 32
4.1.1.4 Mycoplasma Assay ... 32
4.1.1.5 Differentiation and Fixation of THP-1 Cells ... 32
4.1.2 Primary Cells ... 33
4.1.2.1 Isolation of Monocytes ... 33
4.1.2.2 Cultivation of Monocytes ... 34
4.1.3 Transient Transfection of Mammalian Cells ... 35
4.1.3.1 Electroporation of Mammalian Cell Lines and Human Primary Cells ... 35
4.2 General Molecular Biology ... 36
4.2.1 Bacterial Culture ... 36
4.2.1.1 Cultivation of E.coli strains ... 36
4.2.2 Cloning Experiments ... 36
4.2.2.1 Transformation of Chemically Competent E.coli ... 36
4.2.2.2 Plasmid Isolation from E.coli ... 37
4.2.2.3 Molecular Cloning ... 37
4.2.2.4 Gibson Assembly ... 37
4.2.3 Preparation and Analysis of DNA ... 38
4.2.3.1 Isolation and Quality Control of Genomic DNA ... 38
4.2.3.2 Precipitation of DNA using Polyethylene Glycol (PEG)... 38
4.2.3.3 Purification of DNA using Phenol-Chloroform Extraction and Ethanol Precipitation 39 4.2.3.4 Agarose Gel Electrophoresis ... 39
4.2.3.5 Restriction Endonuclease Digestion ... 40
4.2.3.6 Dephosphorylation of DNA with Alkaline Phosphatase ... 40
4.2.3.7 Purification of DNA Fragments by Gel Extraction ... 40
4.2.3.8 Ligation of DNA Fragments ... 40
4.2.3.9 DNA Sequencing and Sequence Analysis ... 41
4.2.4 Polymerase Chain Reaction (PCR) ... 41
4.2.4.1 Analytical PCR ... 41
4.2.4.2 Quantitative Real Time PCR (RT-qPCR) ... 42
4.2.5 Preparation and Analysis of RNA ... 42
4.2.5.2
In Vitro Synthesis of Capped mRNA ... 434.2.6 Chromatin Immunoprecipitation (ChIP) ... 44
4.2.7 Generation of DNA Libraries for Next Generation Sequencing (NGS) ... 46
4.2.8 Assay for Transposase-Accessible Chromatin Sequencing (ATACseq) ... 47
4.2.9 RNA sequencing (RNAseq) ... 49
4.2.10 Targeted Bisulfite Amplicon sequencing (TBSAseq) ... 49
4.3 Protein Biochemical Methods ... 51
4.3.1 Preparation of Whole Cell Lysates ... 51
4.3.2 Preparation of Nuclear Extracts... 51
4.3.3 Discontinuous SDS-PAGE ... 53
4.3.4 Coomassie Staining of SDS-Gels ... 54
4.3.5 Western Blot Analysis and Immunostaining (WB, Semi-dry technique) ... 54
4.3.6 Microscale Thermophoresis (MST) ... 56
4.3.7 Proximity-dependent Biotin Identification (BioID) ... 57
5 RESULTS ...60
5.1 Cell Type-Specific PU.1 Binding Site Selection ... 60
5.1.1 Cooperativeness between Sequence-Specific Transcription Factors ... 60
5.2 Epigenetic Determinants of PU.1 Binding Site Selection ... 64
5.2.1
In vitro Binding Affinity to Methylated DNA ... 645.2.2 Comparison of Methylated vs. Unmethylated Binding Sites in vivo ... 67
5.3 PU.1 Binding Site Selection in Lymphoid CTV-1 Cells ... 78
5.3.1 PU.1-induced Transcriptome in Lymphoid CTV-1 Cells ... 79
5.3.2 PU.1-induced Chromatin Accessibility in Lymphoid CTV-1 Cells ... 83
5.3.3 Cooperative Binding Events of ETS-Family Transcription Factors ... 89
5.3.4 Binding Site Selection of PU.1-deletion Constructs in Lymphoid CTV-1 Cells ... 93
5.4 Protein-Protein Interaction Analysis ... 99
6 DISCUSSION AND PERSPECTIVES ... 111
6.1 Cell Type-Specific PU.1 Binding Site Selection ... 112
6.2 Restriction of PU.1 Binding Site Selection ... 113
6.3
De novoBinding Site Selection & Chromatin Remodeling ... 115
6.3.2 Interaction of PU.1 and Chromatin Modifying Enzymes ... 120
6.4 Perspectives ... 123
7 ZUSAMMENFASSUNG ... 125
8 REFERENCES ... 127
9 ABBREVIATIONS... 138
10 APPENDIX ... 144
10.1 Computational Analysis of NGS Data Sets ... 144
10.1.1 Mapping of NGS Data... 144
10.1.1.1 Mapping of ChIPseq Data ... 144
10.1.1.2 Mapping of ATACseq Data ... 151
10.1.1.3 Mapping of RNAseq Data ... 155
10.1.2 Analysis of PU.1 ChIPseq Data of Various Cell Types ... 162
10.1.3 Analysis of TBSAseq Data of CTV-1 Cells ... 176
10.1.4 Analysis of NGS Data of DAC-treated CTV-1 Cells... 180
10.1.5 Analysis of NGS Data of Conventional CTV-1 Cells ... 191
10.1.6 Analysis of Homotypic PU.1 Clusters ... 244
10.1.7 Analysis of Heterotypic PU.1 Clusters ... 246
10.1.8 Analysis of NGS Data of PU.1-deletion Constructs ... 249
10.1.9 Analysis of the Binding Properties of PU.1-fusion Proteins and Corresponding Mass- spectrometry Data ... 282
10.2 Supplementary Tables and Figures ... 287
10.2.1 Appendix I – Cell Type-Specific PU.1 Binding Site Selection ... 287
10.2.2 Appendix II – Epigenetic Determinants of PU.1 Binding Site Selection ... 287
10.2.3 Appendix III – PU.1 Binding Site Selection in Lymphoid CTV-1 Cells ... 289
10.2.4 Appendix IV – Binding Site Selection of PU.1-deletion mutants ... 290
10.2.5 Appendix V – PU.1 Interactome in diverse hematopoietic cell lines ... 291
ACKNOWLEDGEMENT ... 292
LIST OF FIGURES
Figure 2-1 - Schematic view of transcriptional regulatory elements ... 7
Figure 2-2 - Enhancer features ... 9
Figure 2-3 - Mechanisms involved in chromatin remodeling ... 11
Figure 2-4 - SWI/SNF remodeling... 12
Figure 2-5 - SWI/SNF induce TF binding ... 13
Figure 2-6 - Hematopoiesis & PU.1 ... 15
Figure 2-7 - PU.1 & interacting proteins ... 16
Figure 2-8 - Three classes of PU.1 consensus motifs ... 18
Figure 4-1 - Typical WB composition ... 55
Figure 5-1 - Selected IGV genome browser tracks of PU.1 reads across three representative loci ... 61
Figure 5-2 - Distribution of PU.1 peaks across different cell types ... 62
Figure 5-3 - Motif enrichment across analyzed cell types ... 63
Figure 5-4 - PU.1 binding affinity to methylated DNA oligomers ... 66
Figure 5-5 - FACS and WB analysis of transfected CTV-1 cells ... 68
Figure 5-6 - Methylation (MCIp-seq) & Targeted Bisulfite Amplicon Sequencing data (TBSAseq) of untreated and treated CTV-1 cells ... 69
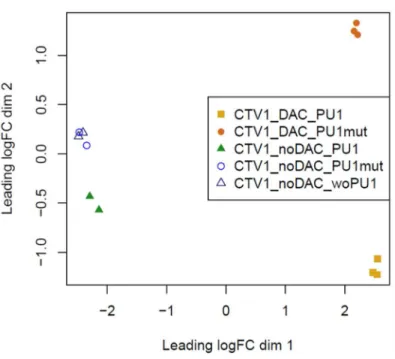
Figure 5-7 - MDS Plot of transfected CTV-1 cells treated with DAC vs. untreated ... 70
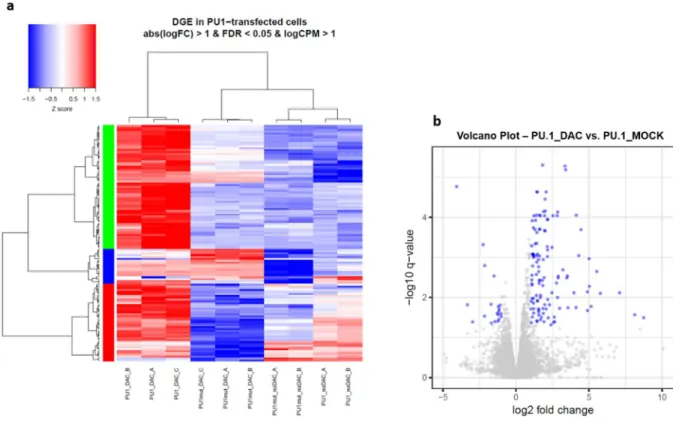
Figure 5-8 - DGE in PU.1-transfected CTV-1 cells treated with DAC vs. untreated ... 72
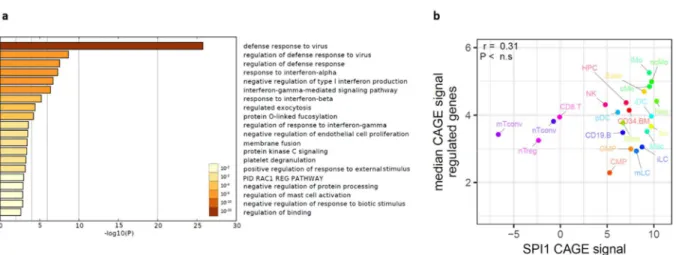
Figure 5-9 - GO-terms & blood expression of 2-fold upregulated genes in PU.1-transfected, DAC-treated CTV- 1 cells ... 73
Figure 5-10 - IGV genome browser track of transfected, DAC-treated CTV-1 cells across the VAMP8 locus .... 74
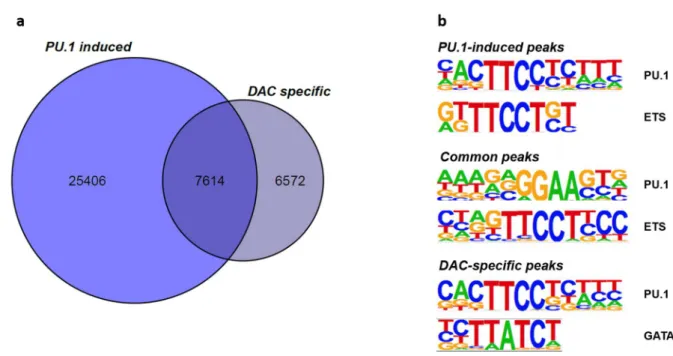
Figure 5-11 - Differential ATACseq peak distribution and motif signature of DAC-treated CTV-1 cells ... 75
Figure 5-12 - CpG- and GC-content of PU.1 binding sites in DAC-treated CTV-1 cells ... 76
Figure 5-13 – MCIp-seq and PU.1 ChIPseq coverage of DAC-specific & PU.1-induced CTV-1 ATACseq regions bound by PU.1 ... 77
Figure 5-14 - mRNA expression profile of all ETS-family TFs & PU.1-heterodimerization partners IRF4 & IRF8 in CTV-1 cells ... 78
Figure 5-15 - Methodology & IGV genome browser track of transfected CTV-1 cells across the CXCR2 locus . 79 Figure 5-16 - PCA of the logCPM data of transfected CTV-1 cells ... 80
Figure 5-17 - DGE in PU.1- vs. PU.1mut-transfected CTV-1 cells ... 81
Figure 5-18 - Correlation of induced gene expression with PU.1 expression in human blood cells & gene ontology analysis ... 82
Figure 5-19 - K-means clustering of ATACseq, ChIPseq & RNAseq data of PU.1-transfected CTV-1 cells ... 84
Figure 5-20 - Motif cooperativeness & PU.1 motif log odds score distribution across the 14 K-means cluster 85 Figure 5-21 - Motif co-enrichment, evolutional conservation & gene ontology across K-means cluster ... 86
Figure 5-22 - Relationship of homotypic clusters & PU.1 binding site selection ... 88
Figure 5-23 - Comparison of PU.1-, ETS-1- and FLI-1-specific binding sites in PU.1-expressing and conventional
CTV-1 cells ... 90
Figure 5-24 - Relationship of ETS class 1 and PU.1 binding sites at heterotypic PU.1 clusters ... 92
Figure 5-25 - Design and expression pattern of PU.1-deletion mutants ... 93
Figure 5-26 - Distribution of PU.1 peaks from deletion constructs ... 94
Figure 5-27 - ChIPseq coverage across differential peaks of PU.1-mutants in CTV-1 cells ... 96
Figure 5-28 - K-means clustering of ATAC & ChIPseq data of differential peak sets from PU.1-deletion mutants ... 97
Figure 5-29 - Motif score distribution of enriched peaks and gene ontology terms of selected PU.1-deletion mutants... 98
Figure 5-30 - Expression of PU.1-fusion proteins and controls in THP-1 cells ... 100
Figure 5-31 - IGV genome browser track and comparison of ChIPseq reads of PU.1-fusion proteins in CTV-1 cells ... 101
Figure 5-32 - PU.1 protein-protein interactions in myeloid THP-1 cells ... 103
Figure 5-33 - PU.1 protein-protein interactions in erythroid K-562 cells ... 105
Figure 5-34 - PU.1 protein-protein interactions in lymphoid CTV-1 cells ... 106
Figure 5-35 - PU.1 vs. PU.1-delA protein-protein interactions in lymphoid CTV-1 cells ... 108
Figure 5-36 - IGV genome browser track and comparison of ChIPseq reads of PU.1-fusion proteins in CTV-1 cells ... 109
Figure 6-1 - Schematic view of PU.1 binding site selection in terms of the chromatin structure ... 122
Figure 10-1 - Multi variance analysis of differential expressed genes between PU.1-transfected CTV-1 cells treated with DAC or left untreated ... 288
Figure 10-2 - Scatter plot comparing read counts of CTV-1-specific PU.1 reads ... 288
Figure 10-3 - Multi variance analysis of differential expressed genes between PU.1- and PU.1mut transfected CTV-1 cells ... 289
Figure 10-4 - mRNA expression across remaining K-means ATAC cluster ... 289
Figure 10-5 - Distribution of differential peaks of PU.1-mutants in CTV-1 cells ... 290
Figure 10-6 - Gene ontology of enriched proteins in PU.1-BirA-transfected vs. NLS-BirA-transfected THP-1 cells ... 291
Figure 10-7 - Gene ontology of enriched proteins in PU.1-BirA-transfected vs. NLS-BirA-transfected CTV-1 cells ... 291
Figure 10-8 - Gene ontology of enriched proteins in PU.1-BirA-transfected vs. delA-BirA-transfected CTV-1 cells ... 291
LIST OF TABLES
Table 4-1 - Culture and passaging conditions... 31
Table 4-2 - Elutriation parameters and cell types ... 34
Table 4-3 - Gibson Assembly reaction setup and parameters ... 38
Table 4-4 - Agarose concentration for different separation ranges ... 40
Table 4-5 - Reaction setup for analytical PCR... 41
Table 4-6 - Reaction parameter for analytical PCR ... 41
Table 4-7 - Reaction setup for real time PCR ... 42
Table 4-8 - Reaction parameter for real time PCR ... 42
Table 4-9 - Reaction setup for mRNA synthesis ... 43
Table 4-10 - Reaction setup for poly (A)-tailing ... 43
Table 4-11 - Reaction setup for PCR amplification of transposed DNA fragments ... 48
Table 4-12 - Reaction parameters for ATACseq-PCR ... 48
Table 4-13 - Reaction setup for PCR amplification of bisulfite converted DNA ... 49
Table 4-14 - Reaction parameters for first TBSAseq-PCR ... 50
Table 4-15 - Reaction setup for PCR amplification of amplified bisulfite converted DNA ... 50
Table 4-16 - Reaction parameters for second TBSAseq-PCR... 50
Table 4-17 - SDS-PAGE stock solutions ... 53
Table 4-18 - SDS-PAGE gel mixture ... 53
Table 5-1 - KD values analyzed by MST for the oligomer modified distal from the core sequence ... 65
Table 5-2 - KD values analyzed by MST for an individual oligomer modified within the core sequence ... 65
Table 5-3 - KD values analyzed by MST for two additional oligomers modified within the core sequence ... 67
Table 10-1 - Public available PU.1 ChIPseq data used in this study ... 287
Table 10-2 - Targeted Bisulfite Amplicon Sequencing Data ... 287
1 SUMMARY
Transcription factors are defined through their ability to recognize and bind specific sequence motifs in genomic DNA. Such sequence motifs are very small compared to the length of the human genome, which is why there is a large proportion of non-functional motifs, where binding of a transcription factor is undesired. The myeloid and B cell-specific transcription factor PU.1 provides a well-suited model to study global dynamic binding processes. This transcription factor is a central regulator of hematopoietic cell differentiation and plays diverse roles in different hematopoietic lineages by regulating cell-type specific genes. How this master transcription factor gains access to its binding sites in the context of chromatin is only partially understood yet. Here, I analyzed its motif cooperativeness and epigenetic regulation and used a transient mRNA-transfection model to study the de novo binding of PU.1 in the lymphatic leukemia cell line CTV-1 that neither expresses PU.1 nor its related ETS-factors SPIB and SPIC. Introduction of PU.1 rapidly initiated a gene expression program (as measured by RNA- sequencing) dominated by myeloid genes which were correlated with PU.1 expression across hematopoietic lineages. ATAC-sequencing revealed extensive remodeling of the chromatin upon PU.1 expression, which was partially associated with the deposition of the histone modification H3K27ac and the enhanced expression of neighboring genes.
De novo remodeled sites were significantlyassociated with clusters of PU.1 sites and/or higher motif scores, suggesting that homotypic binding sites and high affinity consensus sequences are responsible for a large fraction of de novo remodeled PU.1 binding sites. Moreover, shared sites between PU.1 and its ETS-family members ETS-1 and FLI-1 seemed to enhance PU.1’s chromatin remodeling capacity in the lymphoid cell line, likely by establishing novel ETS-dependent co-associations in less wide-open chromatin regions. PU.1 binding in pre-existing open chromatin, however, was predominantly found at single PU.1 binding sites with lower motif scores and many surrounding consensus motifs for other transcription factor families, including GATA and RUNX, which likely enable PU.1 binding at low affinity sites. Titration of PU.1 levels and the analysis of several deletion mutants showed that the efficient binding of PU.1 to
de novoremodeled sites was dependent on PU.1 concentration, reduced in the absence of the glutamine-rich domain and even more diminished in the absence of the acidic domain, suggesting that the latter is required for accessing binding sites in closed chromatin.
In vivo proximity-dependent biotinylationanalysis (BioID) uncovered the association of PU.1 with several components of the SWI/SNF family of chromatin remodeling complexes, including ARID1A, SMARCD2 and SMARCA4 (BRG1) among others.
These interactions were specifically lost in the PU.1 mutant lacking the acidic transactivation domain.
In conclusion, we could show that the
de novo binding of PU.1 to nuclear DNA induces rapid andmarked changes in the chromatin landscape of the lymphatic CTV-1 cell line, which requires the acidic
transactivation domain and its interaction with the SWI/SNF remodeling complex.
2 INTRODUCTION
The majority of the cells of a multicellular organism comprises the same genetic information, however
the specific gene expression profiles differ from cell to cell (Eeckhoute et al. 2009). Cell type-specific
transcriptional programs establishing those distinct gene expression profiles are mainly regulated by
transcription factors (TFs), which bind cis-regulatory DNA elements like promotors and enhancers in a
sequence-dependent manner (Choukrallah and Matthias 2014). Besides basal TFs, which are expressed
ubiquitous in every cell type (Zehavi et al. 2015), eukaryotes possess a diversity of cell type- and tissue-
specific TFs, which regulate the transcription of cell type- and tissue-specific genes by either activating
or repressing the basal transcription machinery. The vast majority of TFs recognize specific DNA motifs
that frequently range from 6-12 base pairs (bp) in length, suggesting that most sequence-specific TFs
will have million potential binding sites throughout the genome (Heinz et al. 2015). Nevertheless, the
access to their potential binding sites is highly restricted and only a relatively small proportion of
regulatory elements are effectively bound. Furthermore, since gene regulation is cell type-specific, a
single TF shows distinct binding profiles in different cell types. This indicates that the interaction
between the TFs and their target DNA motifs alone is not sufficient to explain their transcriptional
output. Indeed, besides DNA sequence preferences the main component controlling cell type-specific
TF occupancy is the dynamic state of the chromatin structure on nucleosome or higher-order structure
levels (Choukrallah and Matthias 2014). The positioning of nucleosomes throughout the genome
modifies the availability of binding sites to TFs and the basal transcription machinery, therefore
affecting almost all DNA-dependent processes such as transcription, replication and recombination in
a highly cell-specific manner (Tsompana and Buck 2014). The ability to overcome this restrictive
structure of the chromatin may be a key feature of master TFs or so called pioneering factors. Specific
features of those master regulators which enable them to overcome chromatin restriction remain to
be defined, but may include their capability to recruit cofactors like chromatin remodeling complexes,
as well as epigenetic modifiers to create active chromatin states. In addition, they may more efficiently
compete with nucleosomes for DNA binding, either autonomously or in a cooperative fashion with
additional factors. This project makes use of the well-studied master regulator of the hematopoietic
system PU.1 to address the central question of how a TF is able to influence the expression profiles of
diverse human cell types in cooperation with the cellular enzymes that shape chromatin accessibility.
2.1 Chromatin Accessibility & Transcription
It remains a key question in biology, how DNA-recognizing proteins interact with enzymes to either activate or silence regulatory elements in a given cellular context. In principle and as already stated above, transcriptional regulation occurs on two joint levels. The first one involves TFs as well as the basal transcription machinery, and the second involves the chromatin structure and its regulators.
Chromatin features that are involved in this epigenetic regulation can be divided into three general classes. The first class involves specific histone modifications that are associated with altered activity states for both promoters and enhancers, as well as direct modifications of the genomic DNA sequence. The second class involves interactions of
cis-regulatory DNA elements like long-rangeinteractions between enhancers and their targets, which occur on a genome-wide scale and shaping the nuclear architecture. The third class deals with the accessibility of the chromatin and the enzymes mediating this process, which inhibit the access to the underlying DNA sequence and impede TF binding (Voss and Hager 2014).
2.1.1 Chromatin- & DNA-Modifications
The packaging of the DNA in the nucleus is one of the major features that regulates differential gene expression in eukaryotic cells. The basic subunits of chromatin are so-called nucleosomal core particles. Each nucleosome consists of 145-147 bp of DNA wrapped around an octamer comprised of two copies of each of the canonical histones H3, H4, H2A and H2B. These four proteins interact in an ordered manner during nucleosome assembly to establish the modular nature of the nucleosome. The core particles are connected by a short stretch of linker DNA, forming a structure resembling beads on a string, where the ‘nucleosome-beads’ are usually found every 200 bp (Lawrence et al. 2016). Linker histone H1 family members are another key component of chromatin. They bind to the nucleosomal core particle around the DNA entry and exit sites, stabilizing both, nucleosome structure and higher- order chromatin architecture (Hergeth and Schneider 2015). In general, this packaging of the DNA into nucleosomes impedes transcription, by physical obstruction as well as by bending the DNA, hence reducing its accessibility for TFs (Lawrence et al. 2016). To distinguish inactive or closed versus active or open chromatin, the terms hetero- and euchromatin respectively have been established (Bell et al.
2011). In heterochromatin, the DNA is tightly coiled, thus preventing the access of the transcriptional
machinery. Heterochromatin is usually found in regions of repetitive DNA and often associated with
the nuclear envelope. In the euchromatin state, the DNA is less tightly coiled, allowing the access of
TFs and chromatin remodelers (Sanders and Mason 2016). The switch from an inactive,
nucleosome stability by altering the interactions within nucleosomes or within neighboring nucleosomes. Hence, PTMs influence all DNA-based processes, including chromatin folding, nucleosome remodeling, and transcriptional gene expression (Lawrence et al. 2016). Amino acids of the N-terminal histone tail can be acetylated, phosphorylated or methylated among other modifications (Bannister and Kouzarides 2011). Most of these PTMs are reversible, since the cell possesses specified histone-modifying enzymes for adding and removing these marks. These enzymes can be grouped into two major classes: writers like histone acetyl transferases (HATs) and histone methyltransferases (HMTs) and erasers such as histone deacetylases (HDACs) and histone demethylases (KDMs; Choukrallah and Matthias 2014). PTMs act in a combinatorial fashion to regulate transcriptional activity. Some modifications are associated with transcriptional activation and others with transcriptional repression, depending on their relative position in histones.
DNA methylation of cytosines (C) within CG (cytosine-guanine) dinucleotides (CpGs) provides an additional mechanism regulating gene expression and genome architecture. In the mammalian system, most of the CpGs are methylated, but their appearance seems to be rarer than statistically predicted.
In part, this can be explained by the spontaneous deamination of the 5’-methyl cytosines (5mC) that results in thymine thereby creating G/T mismatches, which can be repaired by DNA glycosylases such as the methyl-CpG binding domain protein 4 (MBD4) and the thymine DNA glycosylase (TDG) followed by base excision repair (BER) pathways (Moore et al. 2013). Vertebrate CpG islands (CGIs) which are short interspersed DNA sequences, represent an exception to this rule and are GC-rich, CpG-rich, and predominantly unmethylated. CGIs are mostly associated with promotor regions, hence representing sites for transcription initiation (Deaton and Bird 2011). Nucleosome-associated DNA sequences however, show an increased rate of methylation when compared with the more accessible linker regions between nucleosomes. Gene bodies of highly expressed genes on the other hand, are heavily methylated, while active gene regulatory elements show a lower degree of methylation. Methylation patterns outside of CGIs strongly vary between different cell types and correlate with the resulting gene expression profile (Yin et al. 2017). When present, DNA methylation can block TF binding, either directly through interference with their base recognition or indirectly by recruiting methylation- specific binding proteins involved in gene repression (Domcke et al. 2015, Moore et al. 2013). Such proteins include methyl-CpG binding-domain (MBD) proteins, which are thought to be the readers of DNA methylation patterns and which recruit HDACs promoting local chromatin condensation.
Moreover, emerging evidence suggests that some TFs lacking a MBD are also able to interact with
methylated DNA (Zhu et al. 2016). The cell type-specific TF CCAAT/enhancer-binding protein-α
(C/EBPα) for example was shown to specifically bind to methylated promotors in primary keratinocyte
cultures from newborn mice leading to their activation upon differentiation (Rishi et al. 2010). A recent
differences in TF binding specificities to unmethylated and CpG-methylated DNA sequences. For example, several factors, which regulate embryonic stem cell (ESC) self-renewal like PRDM4, Nanog, and the octamer-binding TF 4 (OCT4), were shown to be capable of binding to methylated CpGs, which may in part explain their ability to reprogram differentiated cells towards a pluripotent state.
Furthermore, this study could show that certain TF families differ in their CpG-methylation sensitivity.
For instance, basic leucine zipper (bZIP)- and E26 transformation-specific (ETS)-family TFs were inhibited by methylated CpGs, whereas NFAT (nuclear factor of activated T cells) factors preferred to bind to methylated CpG sequences (Yin et al. 2017). In addition, the major enzymes setting and erasing DNA methylation were also shown to interact with several cell type-specific TFs, thus influencing the methylation pattern among various cell types (Suzuki et al. 2017). The hematopoietic master TF PU.1 for example, was shown to be involved in the recruitment of the de novo DNA methyltransferase 3B (DNMT3B) to hypermethylated promotors. Moreover, this factor also recruited the ten-eleven translocation methyl cytosine dioxygenase 2 (TET2), an enzyme involved in active DNA demethylation, to genes that become demethylated during monocyte (MO) to osteoclast (OC) differentiation, suggesting that this TF is able to directly interact with the main enzymes involved in DNA methylation and demethylation (de la Rica et al. 2013).
2.1.2 Cis -regulatory DNA Elements
2.1.2.1 Promoters
Transcription of a gene in eukaryotes is a highly complex process that requires precise coordination in
the assembly of
trans-acting factors through the recognition of various types of cis-regulatory DNAsequences. Promoters generally refer to DNA regions that allow accurate initiation of transcription of
a certain gene, by directing RNA Polymerase II (RNA Pol II) to initiate transcription at the transcription
start site (TSS; Hardison and Taylor 2012). A promoter is typically comprised of proximal, core and
downstream elements (see Figure 2-1). The core promoter is defined as a stretch of DNA of around 50-
100 bp surrounding the TSS of a gene that directly interacts with the transcription machinery (Kim and
Shiekhattar 2015). Canonical core promotor elements include the TATA-box, the Initiator (Inr), the
TFIIB recognition element (BRE), the downstream promotor element (DPE), and the downstream core
element (DCE). However, most active promoters in a given cell are GC- and CpG-rich regions that lack
TATA-boxes and tend to support initiation of transcription at a broad range of positions within a
roughly 100 bp interval (Hardison and Taylor 2012). Although promoters can be structurally diverse,
they all share the same function, which is the accurate initiation of messenger RNA (mRNA)
transcription. The assembly of the transcription machinery at the core promoter is initiated by TFs that
sequence. The binding of TFs leads to an increasing rate of transcription by facilitating the recruitment or assembly of the basal transcription machinery onto the core promoter or by mediating the recruitment of specific distal regulatory DNA sequences to the core promoter (Akbari et al. 2008), which will be further explored in the next chapter.
Figure 2-1 - Schematic view of transcriptional regulatory elements
The promoter usually consists of proximal, core and downstream elements. Multiple enhancers located distant from the promoter and interspersed with silencer and insulator elements influence transcriptional regulation. Regulatory DNA elements are marked by certain histone modifications reflecting either active (H3K4me1/2/3 i.e.) or passive (H3K27me3 i.e.) states (see next chapter; adapted from Ong and Corces 2011).
2.1.2.2 Enhancers, Silencers & Boundary Elements
Enhancers are one of the primary determinants of cell identity. Enhancers refer to DNA sequences, which can increase basal transcription levels from gene promoters and TSSs that can be located at any distance from their target gene varying between hundreds of bases up to megabases (Heinz et al.
2015). These
cis-acting DNA sequences are able to increase the transcription of genes throughcooperative and synergistic binding of TFs, DNA-binding effectors and chromatin-modifying complexes
(Huang 2016). Enhancers function in an orientation-independent manner and harbor distinct
chromatin features including increased chromatin accessibility, characteristic histone modifications,
DNA hypomethylation, and bidirectional transcription (Bulger and Groudine 2011). Their most
important feature however, is their ability to function as integrated platforms for TF binding (Buecker
and Wysocka 2012). The main characteristics of enhancers are depicted in Figure 2-2. Enhancer states
can be classified as inactive, primed, poised or active. An inactive enhancer is essentially located in
compact chromatin and is devoid of TF binding and histone modifications. Primed enhancers are
characterized by closely bound sequence-specific TFs that establish a nucleosome-free region, but still
need to be activated upon distinct signaling pathways. Poised enhancers are primed enhancers, which
p300, which is accompanied by the covalent modification of histone tails in enhancer-associated nucleosomes. Active enhancers are associated with acetylation of lysine 27 of histone 3 (H3K27ac) or H3K9ac, which often coincides with the presence of actively transcribing RNA Pol II (Heinz et al. 2015).
These regulatory elements are often interspersed by silencers, which can be marked by histone 3 lysine
27 tri-methylation (H3K27me3). Silencers on the other hand, repress transcription mainly by recruiting
repressive TFs or by blocking DNA-binding of additional activators. Furthermore, so-called boundary
or insulator elements that are bound by regulatory proteins such as the CCCTC-binding factor (CTCF)
also reduce the gene expression of a target gene by blocking the interaction of distal enhancers with
their target promotors (see Figure 2-1). At active promotors, the interaction between the promotor
and an enhancer is often mediated by cohesin, which stabilizes the DNA loop formed between those
two (see Figure 2-2). However, many studies have shown that cohesin and the DNA-binding zinc-finger
TF CTCF also co-localize on chromatin. Here, they lie together at the anchors of the loops and form so-
called topologically associated domains (TAD), suggesting that cohesin is also implicated in the
formation of insulator elements (Rao et al. 2017). In flies and mammals, CTCF is mainly enriched at
accessible regions that do not function as active enhancers (Shlyueva et al. 2014). Thus, in contrast to
enhancers, silencers and boundary elements usually harbor a repressive phenotype and create barriers
between enhancers and other up- or downstream-located regulatory DNA elements like promotors
(see Figure 2-1).
Figure 2-2 - Enhancer features
a | Enhancers are distinct genomic regions that contain TF binding sites (TFBSs) and have the potential to enhance basal transcription levels from gene promoters and TSS. b | Active enhancers (Enhancer A) are bound by activating TFs and are looped into proximity to their target promotors. Cohesins and other protein complexes are known to mediate this process. Furthermore, active enhancers are characterized by a depletion of nucleosomes and flanking nucleosomes show specific histone marks like H3K4me1 and H3K27ac. Inactive enhancers however, are associated with repressive marks like H3K27me3 (b) and repressive TF binding (a) (adapted from Shlyueva et al. 2014).
2.1.3 Transcription Factor Binding & Chromatin Remodeling
TFs can bind and regulate different targets at the same time and corresponding targets on the other hand can be regulated by several TFs. To unveil the complex mechanisms, which underlie differential gene regulation, the interaction of TFs with their potential target genes in different cells types and tissues, in combination with the interaction of cell type-specific TFs with each other is of major scientific interest (MacQuarrie et al., 2011). Many studies were carried out over the recent years to analyze the genome-wide and cell type-specific binding properties of TFs (Carroll et al. 2005; Eeckhoute et al. 2009; Heinz et al. 2010; John et al. 2011; Lefterova et al. 2010; Lupien et al. 2008; Mullen et al.
2011; Palii et al. 2011; Pham et al. 2012; Siersbaek et al. 2011). Those studies unveiled two key
properties of TF binding. On the one hand, there are factors, which are expressed in the same cell type
and tend to bind nearby cooperative DNA elements. On the other hand, a single TF itself can be
expressed in distinct cell types and bind to various sequence motifs depending on the developmental
status of the cell. This phenomenon might be explained by specific protein-protein interactions, which
evidence for a close relationship between TF binding and the local occurrence or lack of various
epigenetic modifications creating poised or activated chromatin states. This includes histone
methylation and acetylation, diverse patterns of histone variants or DNA methylation. Those cell type-
specific epigenetic signatures appear frequently on promotor-distal enhancer elements, which are
usually marked by histone 3 lysine 4 mono- or di-methylation (H3K4me1/me2) and H3K27ac in an
active state as already stated in the previous chapter. These distal and cell type-specific elements
regulate the gene expression profile of a cell and can be bound cooperatively by different cell type-
specific master regulators (Pham et al. 2012). Moreover, the cooperative competition of one or more
factors with nucleosomes is of major functional importance to establish cell type-specific regulatory
elements (Heinz et al. 2010). In addition, pioneer factors, which are able to overcome chromatin
restriction, at least on nucleosome level, are of special interest here, because they are thought to be
capable of recruiting other cell type-specific TFs to those binding sites they just made accessible. Taking
together, TFs must exploit various strategies to induce the local reorganization of the chromatin on
the nucleosomal structure level to be able to stably interact with their specific regulatory DNA
elements buried in chromatin. The disruption of the nucleosome structure that allows for TF binding
is known to be coupled with the recruitment of specific adenosine triphosphate (ATP)-dependent
remodeling complexes. Those proteins can recognize and bind to modified histones promoting
transcription by several molecular mechanisms including nucleosome sliding and displacement,
histone disassembly and the substitution of histone variants (Voss and Hager 2014; see Figure 2-3).
Figure 2-3 - Mechanisms involved in chromatin remodeling
a | Mechanisms allowing for increased local access of TFs to their binding sites include nucleosome sliding and displacement, histone displacement as well as replacement of octamer subunits with specific histone variants. b | A common mechanisms leading to TF binding to closed chromatin structures is thought to involve the cooperative nucleosome attack of two factors (orange and blue circles), generating enough free energy for binding to overcome the histone-DNA contacts in the nucleosome. c | Furthermore, pioneering factors (shown in blue) are thought to harbor special binding properties, which allow them to interact with closed chromatin, at least on nucleosome level, thus pinching the histone-DNA contacts and facilitating the binding of additional TFs (shown in green). The molecular mechanisms allowing for the modulation of the nucleosomal structure though, are not clarified yet. d | An alternative concept includes proteins which recruit multiple chromatin remodeling complexes to induce transient chromatin conformation changes allowing for secondary factors (red, pink and blue circles) to bind their binding sites (adapted from Voss and Hager 2014).
Chromatin remodeling complexes are large multi-protein assemblies typically comprised of an ATPase (ATP triphosphatase)-containing motor protein and several accessory proteins (Erdel et al. 2011).
Based on their subunit composition and biochemical activity, remodeling complexes can be divided
into the four major classes SWI/SNF, ISWI, CHD and INO80 (Wilson and Roberts 2011). Among those,
the SWI/SNF-complex was the first one initially discovered in yeast. With more than 20% of cancers
harboring mutations to one subunit of this 15-subunit complex, it may be one of the most important
In mammals, the SWI/SNF family can be divided into the BAF (BRG1-associated factor, also known as SWI/SNF-A) and the polybromo BRG1-associated factor (PBAF, also known as SWI/SNF-B) complexes.
These complexes harbor one of two mutually exclusive catalytic ATPase subunits, which are either BRM (brahma homologue, also known as SMARCA2) or BRM/SWI2-related gene 1 (BRG1, also known as SMARCA4). Furthermore, they are comprised of several variant subunits, which contribute to the targeting and assembly of the nucleosomes as well as to the regulation of the lineage-specific functions of these complexes. For instance the AT-rich interactive domain containing proteins 1A (ARID1A, also known as BAF250A) and 1B (ARID1B) are mutually exclusive and only present in BAF complexes, whereas BAF200 and BRD7 (bromodomain-containing 7) subunits are only present in PBAF complexes (Wilson and Roberts 2011). Their well-conserved bromodomain leads to the recruitment of these factors to acetylated histones, where they initiate the sliding of the histone octamer along the DNA or even promote the complete removal of the octamer from the DNA (Hassan et al. 2002). The predicted remodeling mechanism and the induction of TF binding by the SWI/SNF complex are depicted in Figures 2-4 and 2-5, respectively.
Figure 2-4 - SWI/SNF remodeling
After binding of the SWI/SNF complex, the histone-DNA contacts are disrupted and a loop of DNA that propagates around the nucleosome is formed. This either leads to the sliding of a nucleosome, or as a consequence to the complete ejection of an adjacent nucleosome (adapted from Wilson and Roberts 2011).
Figure 2-5 - SWI/SNF induce TF binding
At silent genes, where nucleosomes are less positioned (disordered) and TSS (arrow) are buried inside the chromatin, SWI/SNF enzymes are usually under-represented. Active, mostly lineage-specific genes however, show a strong SWI/SNF binding and their TSS is flanked by highly ordered nucleosomes allowing for the access of TF to their TSS in this nucleosome depleted region (bottom left). Moreover, these complexes can also be involved in the dynamic target silencing, mainly of genes involved in lineage-specific differentiation and proliferation by recruiting repressive cofactors (bottom right; adapted from Wilson and Roberts 2011).
Those complexes have key roles in the control of lineage-specific differentiation and were shown to play essential roles during neurogenesis, myogenesis, adipogenesis, osteogenesis as well as hematopoiesis. Studies analyzing the induction of cell type-specific gene regulation unveiled that many of the promotors of SWI/SNF-dependent genes were devoid of CGIs and more tightly packed into chromatin, indicating that SWI/SNF complexes are mostly involved in the remodeling of nucleosomes within repressive chromatin structures. This study is further supported by the antagonistic relationship between SWI/SNF complexes and the Polycomb group (PcG) proteins. PcG proteins are responsible for the tri-methylation of lysine 27 of histone 3, which is known to be a repressive chromatin mark and impairs SWI/SNF-mediated nucleosome remodeling (Wilson and Roberts 2011). Furthermore, nucleosome remodelers are able to cooperate with cell type-specific TFs to coordinate the activation of lineage-specific genes and the suppression of certain proliferation programs (see Figure 2-5).
However, the mechanisms underlying these interactions are only poorly characterized so far. Pioneer
factors though, help to solve the “chicken and egg” problem of how restrictive regions of nucleosomal
DNA in chromatin become functional regulatory active regions, since they are able to target closed
chromatin and thereby allow additional factors to bind. However, little is known about how these
master regulators find their targets and coordinate additional cofactors
(Zaret et al. 2016). The
pioneering factors FoxA1 (forkhead box A1) and GATA4 (GATA binding factor 4) for instance were
shown to target sites in isolated nucleosomes, suggesting that those factors are able to penetrate
closed chromatin, thus creating open chromatin sites accessible for additional factors. Although this
residence times of most site-specific TFs on their cognate DNA motifs are rather short with a rapid exchange rate and a high mobility on those genomic sites (Swinstead et al. 2016). This leads to the assumption that additional mechanisms might exist, which allow pioneering factors to bind to restricted chromatin regions in a more dynamic manner. Those mechanisms strongly favor the idea that certain TFs can initiate chromatin remodeling events through the direct recruitment of chromatin remodeling enzymes. As part of this, it could be shown that BRG1 for example is correlated with the binding of the cell type-specific TF OCT4 in self-renewing ESCs. Moreover, it could be shown that the SWI/SNF complex itself is capable of displacing a TF from chromatin during nucleosome remodeling (Swinstead et al. 2016). Together these data suggest that ATP-dependent remodelers play a prominent role in regulating pioneering factor activity, since they either help to establish accessible chromatin regions allowing for TF binding or repress TF binding respectively. Thus, the functional analysis of mechanisms controlling the binding site selection of master regulators across different cell types with respect to the particular chromatin architecture is still of major interest for nowadays research and could unveil novel binding properties of these fascinating regulators of differential gene expression.
The hematopoietic system comprises a prime model to analyze TF functions and binding, and the myeloid and B cell-specific TF PU.1 (Spi1) is a well-studied example of a master regulator or pioneering factor involved in blood cell development. It is restricted to the hematopoietic compartment and required for the generation of common lymphoid and granulocyte-macrophage progenitor cells, as well as later stages of monocyte/macrophage (MO/MAC) and B cell development (Friedman 2007).
Moreover, PU.1 is able to reprogram T cells or fibroblasts e.g. into macrophages (Arinobu et al. 2007;
Feng et al. 2008; Laiosa et al. 2006). The next chapter will provide more insights into the biology of this
important and fascinating regulator of the hematopoietic system.
2.2 The Master Regulator PU.1
The myeloid and B cell-specific TF PU.1 is a well-studied example of a master regulator or pioneering factor, respectively. This ETS-family member TF, encoded by the Spi1 gene, is a key regulator of the hematopoietic system, controlling the expression of hundreds of genes including growth factor receptors, adhesion molecules, TFs and signaling components (Willis et al. 2017). However, its role at each hematopoietic stage is not fully understood yet. PU.1 is restricted to the hematopoietic compartment and is needed for the development of common myeloid progenitor cells (CMPs) as well as for later developmental stages of MO/MAC and B cells (Friedman 2007). The most important hematopoietic cell types regulated by PU.1 are depicted in Figure 2-6.
Figure 2-6 - Hematopoiesis & PU.1
PU.1 is involved in the differentiation of common myeloid progenitor cells as well as in the differentiation of granulocyte/monocyte progenitor cells (GMP) to mature granulocytes and monocytes/macrophages. Expression of PU.1 is also required for the transition from CMPs to megakaryocyte/erythroid progenitors (MEPs). PU.1-deficient progenitor cells are not able to differentiate and persist as CMPs (adapted from Tenen 2003).
PU.1 is expressed at low levels in CD34
+HSCs and is upregulated during myeloid differentiation. PU.1-
deficient mice show a strong impairment in hematopoiesis, die in utero and harbor deficiencies in the
development of MAC, neutrophils, B cells and T cells, which was already described 1994 by Fisher and
Scott. In terms of B cells, this requirement is limited to early lymphopoiesis however, as conditional
deletion of PU.1 in CD19-expressing B cells is compatible with normal development and function (Willis
early myeloid and lymphoid progenitors and PU.1 disruption in GMPs blocks their maturation but not proliferation, resulting in myeloblast colony formation. In humans, loss-of-function mutations in the
Spi1 gene have been found in acute myeloid leukemia (AML; Iwasaki et al. 2005) and recurrent PU.1fusions were also shown to be involved in high-risk pediatric T cell acute lymphoblastic leukemia (ALL;
Seki et al. 2017).
PU.1 belongs to the ETS-family of TFs, which are characterized by an evolutionary well-conserved DNA- binding domain (DBD), namely the ETS domain. NMR-analysis of this domain unveiled a winged helix- turn-helix structure, which consists of three α-helices and four β-sheets, where the third α-helix is responsible for the contact and binding to the DNA (Donaldson et al. 1996). Besides the ETS-domain, PU.1 also harbors additional domains including an N-terminal acidic domain and a glutamine-rich domain, both mainly involved in transcriptional activation and therefore collectively named transactivation domain (TAD). Furthermore, PU.1 contains a so-called PEST domain (a peptide sequence rich in proline, glutamic acid, serine and threonine), which is involved in protein-protein interactions and likely responsible for its degradation (Burda et al. 2010; see Figure 2-7). For example, PU.1 is known to physically interact with general TFs like TFIID and TBP (TATA-box binding protein), with early hematopoietic TFs like GATA2 (GATA binding protein 2) and Runx-1 (runt-related transcription factor 1), and with other cell type-specific TFs like IRF4/8 (interferon regulatory factor 4/8) or c-Jun (Jun proto-oncogene, AP-1).
Figure 2-7 - PU.1 & interacting proteins
The N-terminal TAD of the 272 aa long protein PU.1 can interact with basal TFs like TFIID, TBP and with GATA1 and GATA2 for example. The PEST domain preferentially interacts with IRFs, including PIP/NF-EM5 (IRF4) and the interferon consensus sequence binding protein (ICSBP/IRF8). The C-terminal ETS domain interacts with c-Jun, GATA1, GATA2 and C/EBPα or C/EBPβ for example. These interactions result in either positive (c-Jun) or negative (GATA1, C/EBPα) effects on PU.1 activity (adapted from Tenen 2003).
In addition, the PU.1 protein can be post-translationally modified via phosphorylation of the serines 41, 142 and 148, which may enhance its activity. All ETS-family members share one major feature which is that they recognize a purine-rich 5’-GGAA/T-3’ core sequence and that their specificity is often mediated by adjacent nucleotides (Wei et al. 2010). The ETS-family is one of the largest evolutionarily conserved TF families and comprises 28 factors in humans (Sizemore et al. 2017). They regulate the expression of multiple viral and cellular genes, often in a cooperative fashion with other sequence- specific TFs and additional cofactors. Adjacent to their DNA-binding sites, binding sites for ubiquitously expressed TFs like Sp1 (specificity protein 1), or for cell type-specific TFs like Runx-1 and C/EBP- factors have been found. The most well-known example however, is the interaction of the ETS-family with Jun-family proteins on DNA sequences called the Ras-responsive element (RRE), which consists of an ETS and an AP-1 binding site. ETS factors are preferentially expressed in specific cell lineages and regulate their development and differentiation by targeting specific genes, e.g. growth factors and integrines, which are unique for each cell lineage (Oikawa and Yamada 2003). Currently ETS proteins are divided into 9 classes according to their structural composition and their relative DNA binding site preferences, where PU.1 is grouped into the family of SPI factors together with SpiB and SpiC (Poon and Kim 2017).
Recent studies unveiled the cell type-specific distribution of PU.1 binding sites in mouse MAC or B cells (Ghisletti et al. 2010; Heinz et al. 2010), as well as in human MO and MAC (Pham et al. 2010/2013).
PU.1 binding sites are often characterized by the co-occurrence of sequence motifs of other cell type- specific TFs. In murine MAC for example, PU.1 is preferentially associated with the nearby binding of the TFs C/EBPα/β and AP-1, whereas in murine B cells, PU.1 binding frequently occurs in combination with a distinct set of B cell specific TFs like E2A, EBF and OCT2 (Heinz et al. 2010). In human MAC PU.1 binding is mainly associated with nearby binding sites of EGR-2 and an unknown E-Box binding factor.
Moreover, in primary human MO and MAC PU.1 shows a significant proportion of cell stage-specific
binding events despite comparable PU.1 expression levels in both cell types (Pham et al. 2012). Besides
binding to heterotypic clusters of TF binding sites, PU.1 is also an example for homotypic arrays of
binding sites. Many murine MAC-specific promotors e.g. are characterized by the presence of multiple
PU.1 binding sites (Ross et al. 1998). In addition to cell type-specific binding sites, which are mainly
found at promoter distal sites, there is a core set of PU.1 occupied sites that is shared between
hematopoietic cell types. These sites are frequently associated with motifs for promoter-located
general transcription factors and likely regulate genes that are commonly involved in hematopoietic
lineage selection.
Up to date, PU.1 consensus recognition sites, at least in human MO/MAC, can be grouped into three major classes (see Figure 2-8). Those are defined by the affinity of PU.1 to its specific binding sites, the cooperativeness between adjacent hetero- and homotypic binding sites, the nuclear concentration of PU.1, and the higher-order chromatin structure as well as the supposed capability of PU.1 to engage chromatin remodeling complexes or epigenetic modifiers. DNA methylation however, seems to play a minor role in restricting DNA binding of the master regulator PU.1, since cell type-specific recruitment of PU.1 to its binding sites is associated with local DNA demethylation (Pham et al. 2013).
Figure 2-8 - Three classes of PU.1 consensus motifs
1 | Non-bound sites mainly show low binding affinity and reside in inactive chromatin. 2 | PU.1-bound sites that are DNase I inaccessible mostly represent autonomous binding events preferentially at high affinity sites. 3 | PU.1-bound, mostly intermediate- and low-affinity sites are DNase I accessible, and binding here is likely stabilized by cooperativeness with neighboring transcription factor binding sites. Increasing PU.1 concentration reduces the binding affinity threshold, leading to a marked increase in autonomous binding sites and to a lower extent in cell type-specific sites (adapted from Pham et al. 2013).
The dependency of PU.1 on motif binding affinity distinguishes this pioneering factor from many other TFs that are mainly guided by open chromatin and bind in a cooperative manner with other cell type- specific TFs. However, the contribution of each component and the mechanisms controlling and stabilizing TF access and binding to DNA on a functional level are not completely understood so far.
Moreover, it is still not clear, why only a relatively small subset of TF binding sites distributed
throughout the entire genome, are efficiently bound. Therefore, the myeloid and B cell-specific
transcription factor PU.1 serves as a prime model to define specific molecular and functional features
that enable it to overcome chromatin restriction and to stably bind to DNA
.2.3 Objectives
As already stated above, motif affinity, cooperativeness between neighboring binding sites and higher- order chromatin structure are the major determinants of PU.1 binding site selection. However, the impact of each of these parameters on PU.1 binding is not clarified yet and the rules for binding or not- binding of potential binding sites are only partially understood. This is why this thesis combines high- throughput-sequencing, computational, biochemical and functional analysis to address the question, how the binding of the myeloid and B cell-specific TF PU.1 to its binding sites on genomic DNA is controlled. To better understand the mechanisms that control cell type-specific binding of PU.1, its binding sites are mapped across different PU.1-expressing cell types and analyzed with regard to sequence-associated features of cell type-specific and common sites with respect to the distribution of distinct active and repressive histone marks as well as the co-occurrence of co-associated TF motifs.
Moreover, the relationship between active and restrictive chromatin features - including DNA methylation and the chromatin structure - and PU.1 binding site selection is analyzed
in vivo.Furthermore, the functional importance of PU.1 expression and its individual protein domains is
studied to gain insights into the complex network of proteins, responsible for cell type-specific
transcriptional regulation across different cell types. In summary, PU.1 binding properties are analyzed
by high-throughput methods with regard to the accessibility of the chromatin, the local concentration
of PU.1, its motif affinity and its functional impact as well as its dependence on additional co-associated
factors.
3 MATERIAL AND EQUIPMENT
3.1 Equipment
Autoclave Walter, Geislingen, Germany
BioPhotometer Eppendorf, Hamburg, Germany
Caliper LabChip XT Perkin Elmer, Hamburg, Germany
Centrifuges Heraeus, Hanau; Eppendorf, Hamburg, Germany
Covaris
TMS220 Covaris, Brighton, UK
Electrophoresis equipment Bio-Rad, Munich, Germany
FLA-5000 Fujifilm, Tokyo, Japan
Flow Cytometer (Aria, Fortessa, LSR II) Becton Dickinson, Heidelberg, Germany
Fusion Pulse Vilber Lourmat, Eberhardzell, Germany
Gene Pulser Xcell
TMBio-Rad, Munich, Germany
Heat sealer Eppendorf, Hamburg, Germany
Heatblock Eppendorf, Hamburg, Germany
Incubators Heraeus, Hanau, Germany
J6M-E centrifuge Beckmann, Munich, Germany
Laminar air flow cabinet Heraeus, Hanau, Germany Mastercycler Nexus M2 Eppendorf, Hamburg, Germany
Megafuge 3.0 R Heraeus, Osterode, Germany
Microscopes Zeiss, Jena, Germany
Multifuge 3S-R Heraeus, Osterode, Germany
Multipipettor Multipette plus Eppendorf, Hamburg, Germany NanoDrop Spectrophotometer PeqLab, Erlangen, Germany Nanotemper Monolith NT.115 Nanotemper, Munich, Germany
NextSeq 550 Illumina, San Diego, USA
PCR-Thermocycler 4800 Perkin Elmer, Überlingen, Germany
PCR-Thermocycler PTC-200 MJ-Research/Biometra,Oldendorf, Germany PCR-Thermocycler Veriti 384-well Applied Biosystems, Foster City, USA
pH-Meter Knick, Berlin, Germany
Picofuge Heraeus, Hanau, Germany
Power supplies Biometra, Göttingen, Germany
Realplex Mastercycler epGradientS Eppendorf, Hamburg, Germany
Sonifier 250 Branson, Danbury, USA
Sorvall RC 6 plus Thermo Fisher Scientific, Waltham, USA
TapeStation 2200 Agilent Technologies, Böblingen, Germany
Thermomixer Eppendorf, Hamburg, Germany
Typhoon
TM9200 Molecular Dynamics, Krefeld, Germany
Ultracentrifuge Optima L-70 Beckman, Munich, Germany
Waterbath Julabo, Seelstadt, Germany
Water purification system Merck Millipore, Darmstadt, Germany
3.2 Consumables
384-well PCR plates Thermo Fisher Scientific, Waltham, USA 8-channel pipettor tips Impact 384 Thermo Fisher Scientific, Waltham, USA Adhesive PCR sealing film Thermo Fisher Scientific, Waltham, USA Cell culture flasks and pipettes Eppendorf, Hamburg, Germany
Cell culture plates (6-, 12-, 24-, 48-, 96-well) Eppendorf, Hamburg, Germany Centrifuge tubes (15, 50, 225 ml) Falcon, Heidelberg, Germany
Cryo tubes Nunc, Wiesbaden, Germany
Electroporation cuvettes (0.4 cm) PeqLab, Erlangen, Germany
Heat sealing Film Eppendorf, Hamburg, Germany
LabChip XT DNA 750 Assay Kit Perkin Elmer, Hamburg, Germany Micro test tubes (0.2 ml) Biozym Scientific, Oldendorf, Germany
Micro test tubes (0.5, 1.5, 2, 5 ml) Eppendorf, Hamburg; Sarstedt, Nümbrecht, Germany Multiwell cell culture plates and tubes Eppendorf, Hamburg, Germany
nProteinA Sepharose 4 FastFlow GE Healthcare, Munich, Germany nProteinG Sepharose 4 FastFlow GE Healthcare, Munich, Germany PCR plate Twin.tec 96 well Eppendorf, Hamburg, Germany
Petri dishes Falcon, Heidelberg, Germany
Pierce™ Streptavidin Magnetic Beads Thermo Fisher Scientific, Waltham, USA Sepharose Cl-4 beads Sigma-Aldrich, Taufkirchen, Germany Slide-A-Lyzer MINI Dialysis Devices Thermo Fisher Scientific, Waltham, USA Standard capillaries (NT.115) Nanotemper, Munich, Germany
Sterile combitips Eppendorf, Hamburg, Germany
Sterile plastic pipettes Costar, Cambridge, USA
Syringes and needles Becton Dickinson, Heidelberg, Germany
Teflon foils Heraeus, Hanau, Germany
twin.tec® real-time PCR-Platten Eppendorf, Hamburg, Germany
3.3 Chemicals
All reagents used were purchased from Sigma-Aldrich (Taufkirchen, Germany) or Merck Millipore (Darmstadt, Germany) unless otherwise noted. Oligonucleotides for PCR (polymerase chain reaction) and RT-qPCR (real time quantitative PCR) were synthesized and high-pressure liquid chromatography purified by Sigma-Aldrich (Taufkirchen, Germany). gBlocks gene fragments were synthesized and high- pressure liquid chromatography purified by Integrated DNA Technologies (IDT, San Jose, USA).
3.4 Enzymes and Kits
Advantage 2 Polymerase Mix Clontech, Mountain View, USA Agencourt AMPure XP beads Beckman Coulter, Krefeld, Germany Alkaline Phosphatase Thermo Fisher Scientific, Waltham, USA ECL Prime Western Blotting System Sigma-Aldrich, Taufkirchen, Germany Blood and Tissue Culture Kit Qiagen, Hilden, Germany
dNTP Mix Agena Bioscience, San Diego, USA
dNTPs Thermo Fisher Scientific, Waltham, USA
EZ DNA Methylation Kit Zymo Research, Irvine, USA Gibson Assembly® Master Mix NEB, Frankfurt, Germany
Klenow Enzyme Thermo Fisher Scientific, Waltham, USA
Klenow exo- (3’-5’ exo minus) NEB, Frankfurt, Germany
Lipofectamine 2000 transfection reagent Thermo Fisher Scientific, Waltham, USA MinElute Gel Extraction Kit Qiagen, Hilden, Germany
mMESSAGE mMACHINE® T7 Ultra Kit Thermo Fisher Scientific, Waltham, USA Monarch DNA Gel Extraction Kit NEB, Frankfurt, Germany
Monarch PCR & DNA Cleanup Kit NEB, Frankfurt, Germany
Monarch Plasmid Miniprep Kit NEB, Frankfurt, Germany
MycoAlert® Mycoplasma Detection Kit Lonza, Basel, Switzerland
Nextera XT DNA Library Preparation Kit Illumina, San Diego, USA
NextSeq 550 High Output v2 kit (75, 150, 300 cycles)
Illumina, San Diego, USA
NucleoSpin Plasmid Quick Pure Macherey-Nagel, Düren, Germany 25x Phosphataseinhibitor Cocktail Thermo Fisher Scientific, Waltham, USA 50x Proteaseinhibitor Cocktail Thermo Fisher Scientific, Waltham, USA Phusion High-Fidelity DNA Polymerase Thermo Fisher Scientific, Waltham, USA Plasmid Plus Midi Kit Qiagen, Hilden, Germany
Proteaseinhibitors Thermo Fisher Scientific, Waltham, USA
Proteinase K Thermo Fisher Scientific, Waltham, USA
ScriptSeq™ Complete Kit (Human/Mouse/Rat) Epicentre, Chicago, USA ScriptSeq™ Index PCR Primers Epicentre, Chicago, USA QIAGEN Plasmid Plus Midi Kit Qiagen, Hilden, Germany QIAquick Gel Extraction Kit Qiagen, Hilden, Germany QIAquick PCR Purification Kit Qiagen, Hilden, Germany
ReBlot Plus Mild Antibody Stripping Solution, 10x