Research Collection
Journal Article
Characterization of endocarp powder derived from cocoa pod
Author(s):
Grob, Lucas; Ott, Eileen; Schnell, Selina; Windhab, Erich J.
Publication Date:
2021-09
Permanent Link:
https://doi.org/10.3929/ethz-b-000479185
Originally published in:
Journal of Food Engineering 305, http://doi.org/10.1016/j.jfoodeng.2021.110591
Rights / License:
Creative Commons Attribution-NonCommercial-NoDerivatives 4.0 International
This page was generated automatically upon download from the ETH Zurich Research Collection. For more information please consult the Terms of use.
ETH Library
Journal of Food Engineering 305 (2021) 110591
Available online 29 March 2021
0260-8774/© 2021 The Author(s). Published by Elsevier Ltd. This is an open access article under the CC BY-NC-ND license
(http://creativecommons.org/licenses/by-nc-nd/4.0/).
Characterization of endocarp powder derived from cocoa pod
Lucas Grob
*, Eileen Ott, Selina Schnell, Erich J. Windhab
ETH Zurich, Institute of Food, Nutrition and Health, Schmelzbergstrasse 9, 8092, Zurich, Switzerland
A R T I C L E I N F O Keywords:
Cocoa pod endocarp Ball mill
Milling efficiency Surface characterization
A B S T R A C T
The cocoa pod husk is a largely underexploited by-product of the cocoa value chain. Functionalization of this valuable side-stream as fiber source would be of great economic and ecological benefit, providing potential additional income opportunities for farmers as well as exploiting a bigger fraction of the cocoa bean. In this study, the endocarp from the cocoa pod husk was processed with a planetary ball mill. Processing parameters such as milling time and rotational speed were investigated and showed to have a major impact on the micronization of the cocoa pod endocarp (CPE). To obtain particles smaller than 30 μm two milling steps, pre- milling and fine milling, with different ball diameters (20 and 10 mm) were necessary. The processed CPE was characterized in size, color, crystallinity, and morphology as function of the energy input. A significant color change of the powder was observed with increased energy input. Similar to that, the decomposition temperature, crystallinity and morphology, changed to more amorphous and rougher surfaces. Thus, depending on the size, shape and surface of the powder, the flow behavior in suspension could be adjusted. This research contributes to a better characterization of cocoa pod endocarp powder and its use in confectionery products as fiber source or coloring agent.
1. Introduction
The production of cocoa (Theobroma cacao L) is essential for small farmers and families in developing countries such as Cˆote d’Ivoire and Ghana. In the season 2017/18 over 905 thousand tons have been exported from a Ghanaian origin (ICCO, 2020). As mentioned by several sources and the scientific community, by-products of the cocoa pro- duction are largely underexploited and several valorization strategies have been launched (Lu et al., 2018). The cocoa pod husk comprises the epicarp, mesocarp, sclerotic part and endocarp. Composition-wise the husk consists of cellulose, hemicellulose, lignin and pectin. Sobamiwa and Longe (1994) reported the composition of the endocarp as: 20.8%
db cellulose, 7% db hemicellulose, 13.2% db lignin and 10.5% db pectin.
Although multiple extraction (Mansur et al., 2014; Vriesmann et al., 2011) and valorization strategies (Gyedu-Akoto et al., 2015; Lu et al., 2018) for functional and multipurpose ingredients of cocoa pod husk have been presented, little research has been conducted on the pro- cessing of the different layers of the cocoa pod husk with focus on the functionalization and characterization of the different components.
Grinding is one of the most important unit operations for the food industry. In order to obtain the desired final texture of a food product, the controlled size reduction of ingredients is crucial. A planetary ball
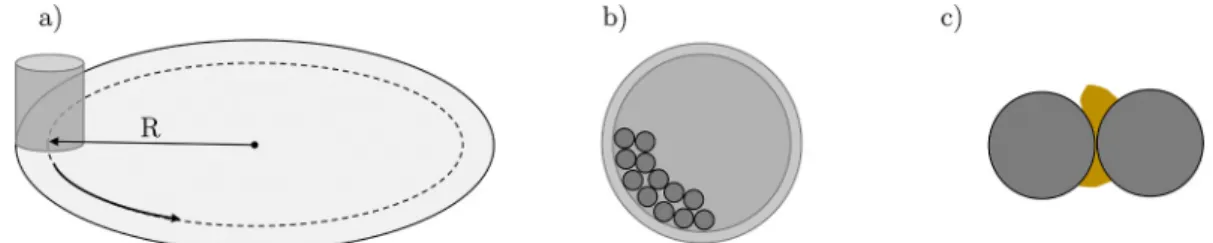
mill, schematically represented in Fig. 1, with its rotating pot is able to create high energy impact and reduce even hard minerals such as ore.
The impact energy Ei (J) of the balls during milling is dependent on the operating parameters, such as rotational speed and its direction of the pot to that of the revolution of the disk. Rosenkranz et al. (2011) mentioned in their work also the importance of the friction coefficient of the balls.
Further, the resulting grinding efficiency is dependent on the mate- rial properties. This paper focusses on the impact of processing param- eters, such as milling time and rotational speed and therefore energy input, on the micronization and powder properties of the cocoa pod endocarp (CPE).
2. Materials and methods 2.1. Materials
The endocarp from the cocoa pod husk was obtained from Koa Switzerland AG, Switzerland. The pods have been harvested in Assin Akrofuom, Ghana between October and November 2019. The endocarp was manually extracted and then further dried and pre-milled (<3 cm) with a hammer mill. The batch of endocarp was stored in a closed
* Corresponding author.
E-mail address: lugrob@ethz.ch (L. Grob).
Contents lists available at ScienceDirect
Journal of Food Engineering
journal homepage: http://www.elsevier.com/locate/jfoodeng
https://doi.org/10.1016/j.jfoodeng.2021.110591
Received 30 November 2020; Received in revised form 19 February 2021; Accepted 10 March 2021
Journal of Food Engineering 305 (2021) 110591
2 container at room temperature.
2.2. Milling and milling conditions
The milling was performed using a planetary ball mill (PM100, Retsch, Haan, Germany) with a 500 mL stainless steel pot. Stainless steel balls with a density of ρb =7640 kgm−3 and a diameter of d =20 mm and 10 mm were used to mill 100 g of sample for pre-milling and fine milling, respectively. The ball to cocoa pod endocarp mass ratio was kept constant at 8.08 g/g. The temperature was not controlled thus the initial temperature was equivalent to room temperature and during the milling it rose depending on the milling time and rotational speed. The mill was operated in 5 min interval setting, 5 min rotation followed by 5 min of break before changing direction. The milling process was divided into a pre-milling step with balls d =20 mm and a fine milling step with balls d =10 mm. Parameters such as the brutto ball milling time (5-140 min) and rotational speed (340-430 rpm) were investigated. The power consumption of the milling operation was determined with a power logger (No-Energy, NZR, Bad Laer, Germany).
2.3. Particle size and distribution
The milled endocarp (1 g) was mixed at 10% wb with medium chain triglyceride (MCT) oil (WITARIX MCT 60/40, IOI Oleo GmbH, Hamburg, Germany) and ultra-sonicated with 200 W at 24kHz and a maximum amplitude of 175 μm for 2.5 min (Hielscher Ultrasonics GmbH, Teltow, Germany). The particle size distribution was evaluated by a laser diffraction particle size analyzer (LS 13 320 Laser Diffraction Particle Size Analyzer, Beckman Coulter, Brea, United States). The sonicated samples were measured in triplicates (N =3). The obscuration during the measurement amounted to around 10% with a pump speed set at 70%. To evaluate the size the Fraunhofer theory was used (de Boer et al., 1987).
2.4. Color
The lightness and color of the endocarp and milled powder were evaluated based on the CIELAB space (Spectrophotometer CM-5, Konica Minolta, Tokyo, Japan), which measured the lightness variable L* and the chromaticity coordinates a* and b* with CIE standard illuminant D65 and at observer view angle of 10◦in triplicate (N =3). The samples were placed in a transparent container and placed on the measuring area of 30 mm to ensure a repeatable measurement of the heterogeneous surfaces or particles. To highlight the difference between the colors of processed powder at time step t and the raw material the total color difference ΔE is calculated according to:
ΔE=
̅̅̅̅̅̅̅̅̅̅̅̅̅̅̅̅̅̅̅̅̅̅̅̅̅̅̅̅̅̅̅̅̅̅̅̅̅̅̅̅̅̅̅̅̅̅̅̅̅̅̅̅̅̅̅̅̅̅̅̅̅̅̅̅̅̅̅̅̅̅̅̅̅̅̅
(L*t− L*0)2 +(
a*t − a*0)2 +(
b*t− b*0)2
√
Eq. (1) Values of ΔE >6 are perceived by the eye as a very obvious differ- ence (Stokes et al., 1992).
2.5. Thermal analysis
Thermal analysis was conducted with a Differential Scanning
Calorimeter (DSC) (DSC 3+STARe System, Mettler Toledo, Columbus, Ohio, United States) with a purge gas flow rate of 1 mL/min of N2. To determine the decomposition temperature, sample of approximately 5 mg was placed into open pin crucibles and held for 10 min at 102 ◦C to evaporate water. Subsequently, the temperature was increased to 450 ◦C with a heating rate of 10 ◦C/min. The decomposition peak temperature was determined with a peak finder at maximum peak height of the exothermic decomposition. The measurement was done once per sample (N =1).
2.6. Crystallinity - XRD
The crystallinity of samples was analyzed by X-ray diffraction (XRD) (D8 Advance, Bruker, Billerica, Massachusetts, United States) with Cu- kα radiation (λ =0.154 nm) at a voltage of 40 kV and a current of 40 mA.
The intensity was measured over a range of 2θ =10–60◦. A step size of 0.02◦and a time/step of 1 s were chosen. The samples were filled into plastic holders ensuring random orientation. The relative degree of crystallinity CrI was calculated based on equation Eq. (2) proposed by Segal et al. (1959):
CrI= I002− Iam
I002
⋅100 Eq. (2)
where CrI is the crystallinity index, I002 is the intensity of the crystalline peak at 2θ ≈ 21.67◦ and Iam is the minimum intensity between the secondary peak at 2θ ≈ 15.93◦ and the main crystalline peak. The measurement was done twice per sample (N =2).
2.7. Morphology characterization with SEM
The SEM images were taken at the Scientific Center for Optical and Electron Microscopy (ScopeM), ETH Zurich. For the SEM images small amounts of the milled powder were applied with a spatula on SEM aluminum stubs covered with double adhesive carbon tape (Plano, Germany). The powder was pressed, cleaned with N2 gas, and then sputter-coated with 4 nm of platinum/palladium (CCU-10, Safematic, Bad Ragaz, Switzerland). Secondary electron (SE)-inlens and Everhart- Thornley (ET) SEM images were recorded at a working distance of 4–5 mm with a scanning electron microscope (Merlin FE-SEM, Zeiss, Oberkochen, Germany), operated at an accelerating voltage of 1.5 kV SE2 and inLens detectors were used.
2.8. Specific surface area of micronized powder
Congo red dye (Sigma Aldrich) adsorption to cellulose was used to determine the specific surface area (Wiman et al., 2012). Langmuir-type adsorption was prepared in 0.03 M phosphate buffer (pH 6) with 1.4 mM NaCl and 1 wt% ball milled sample. For each sample a series of increasing dye concentration (0.1, 0.2, 0.5 and 0.6 g/l) was added to 100 mL of the buffered solution. The screw-top bottles were then placed in a shaker (InforsHT Multitron Pro, Bottmingen, Switzerland) at 60 ◦C at 180 rpm for 24 h. Subsequently, an aliquot of 15 mL was taken and centrifuged (Z366K, Hermle, Gosheim, Germany) at 5000 g for 5 min.
The absorbance of the supernatant was measured in triplicate (N =3) at
Fig. 1. a) Schematic of a planetary ball mill rotating. b) Top view of jar filled with balls. c) Collision between two balls with feedstock in between.
L. Grob et al.
a wavelength of 498 nm with a UV–Vis spectrophotometer (Genesys 10 S UV–Vis Spectrophotometer, Thermo Scientific, Waltham, Massachu- setts, United States).
The specific surface area (SSA) of the micronized powder can be calculated using Eq. (3), where Amax is the maximum dye amount adsorbed by sample particles (mg/g), NA is the Avogadro’s constant (mol−1), SACR the surface area of Congo red, 1.73 nm2 and Mw the molecular weight of Congo red, 696.66 g/mol.
SSA=Amax⋅NA⋅SACR
MW Eq. (3)
The specific energy consumption (SEC) can then be estimated by the total power (ΔPt) at a time step t needed per gram of a powder mass (m) in relation to the new specific surface area created (SSA0- SSAt).
SEC=
1 m
∫t
0ΔPt⋅dt
(SSA0− SSAt) Eq. (4)
2.9. Flow behavior in suspension
The powders were mixed into medium chain triglyceride oil (WITARIX MCT 60/40, IOI Oleo GmbH, Hamburg, Germany) to create a model suspension at different solid fractions (5, 10, 20, 30 and 40 wt%).
The flow curves were measured with a couette geometry (CC27) on an Anton Paar MCR300 (Anton Paar, Graz, Austria) at 25 ◦C according to the ICO standard method (Afoakwa et al., 2009). The suspensions were pre-sheared at 5 s−1 for 5 min. Followed by ramping shear rate up from 2
to 50 s−1 and down in 3 min respectively, with holding of 1 min at 50 s−1. The measured viscosity of the MCT oil at 25 ◦C was η0 =23.84 mPa s.
2.10. Statistical analysis
The differences of the grinding rates Kp and decomposition temper- ature Tdecomp were analyzed with an unpaired t-test. A p-value less than 0.05 was considered statistically significant.
3. Results and discussion
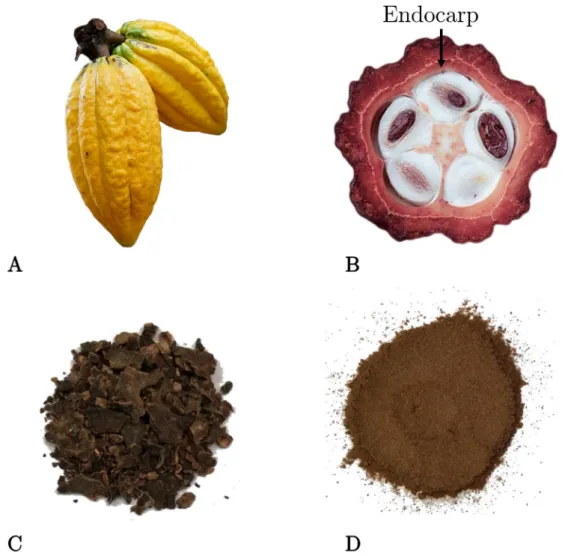
3.1. Grinding rate and energy consumption of planetary ball mill In order to obtain the final product, the cocoa pod endocarp (CPE) had to undergo several pre- and processing steps. Fig. 2 shows the different intermediate processing steps to the final product obtained by ball milling. The cocoa pod endocarp was derived during the cocoa harvesting season (A). The CPE was removed from the cocoa pod by hand (B), dried in the oven at 70 ◦C and initially milled with a hammer mill to pieces <3 mm (C). Afterwards the CPE was processed with a ball mill (D).
In the process of ball milling, milling time and rotational speed are the most important parameters to achieve small particles. The longer the milling time, the higher the number of potential impacts between the balls and the material can occur. The particle size reduction during the grinding process can be described by Eq. (5) (Mio et al., 2004):
Fig. 2. Intermediate processing steps from cocoa pod to the final cocoa-pod endocarp powder. Cocoa pod (A) is harvested and the endocarp (B) is removed. After initial drying and grinding in a hammer mill (C). Final processing in the ball mill (D). Photo credits Koa Switzerland AG (A) and Akos Neuberger (B).
Journal of Food Engineering 305 (2021) 110591
4 d50,t
d50,0
= (
1− d50,l
d50,0
) exp(
− Kpt) +d50,l
d50,0 Eq. (5)
where dt/d0 denotes the normalized particle size of the respective me- dian diameter d3,50 (μm) at a time step t, d50,l the grinding limit (μm) and the grinding rate Kp (1/h). The size of the original sample d50,0 was therefore adjusted according to the experimental setting.
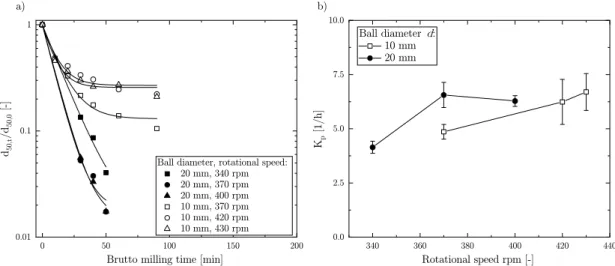
As mentioned before, the grinding rate is characteristic for the feed, grinding media and process parameters. Increasing the rotational speed yielded a faster normalized particle size reduction over time (Fig. 3a).
Fig. 3b shows the relation between grinding rate Kp and rotational speed and different ball diameter d. As expected, the grinding rate increased with elevated rotational speed. On one hand, a decreased ball diameter did not significantly (p >0.05, n =6) increase the grinding rate. On the other hand, the calculated grinding limit d50,l further decreased with the reduction of the ball diameter from approx. 58 to 13 μm. This is of importance if finer particles are needed. Moreover, the presented results are in good agreement with the findings from Mio et al. (2004).
Obtaining a certain particle size is crucial for further processing steps, such as the addition to cocoa mass and organoleptic properties.
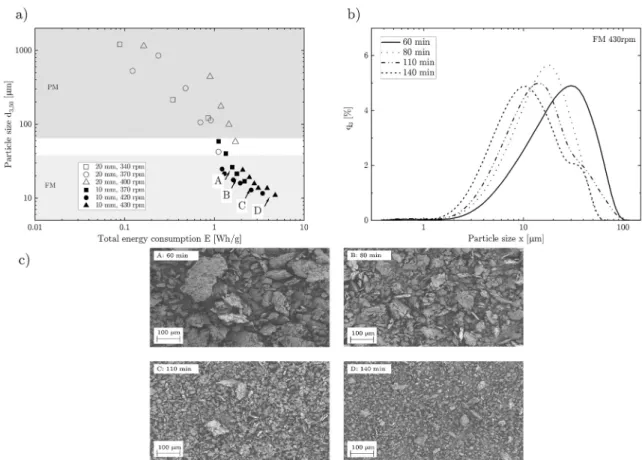
Thus, the final milling of the CPE consisted of a pre-milling (PM) step with steel balls d =20 mm and a fine milling (FM) step with d =10 mm, with the above-mentioned grinding rates, to achieve a fine powder. To investigate the energy consumption, the particle median diameter d3,50
was plotted as a function of the measured energy consumption (Wh/g).
Fig. 4a shows that particle size reduction followed a power law reduc- tion in the PM step. To obtain fine particles, a FM step was applied (particle size distribution shown in Fig. 4b). This realized particle sizes smaller than 30 μm. The increase in milling time linearly increased the energy consumption, as to be expected. The application of different rotational speed suggested that the efficiency in the PM step is best at 370 rpm (see also Fig. 3b). At higher rpm, more energy was dissipated instead of further breaking up the particles. Similar for the FM step, the most efficient processing was found to be around 420 rpm. In Fig. 4c, the SEM images of the produced fine particles at the indicated points (A-D) are shown. These images revealed rough and anisotropic particles with an increasing aspect ratio from 1.7 to 1.9.
3.2. Color change
As color perception can be a critical parameter for consumer acceptance and further product development, the color change during milling was investigated. As the particles became smaller, a significant change in color was apparent with a total color difference of ΔE >10 for all processed samples to the feedstock CPE. The lightness variable L*
increased linearly during PM as well as FM (see Fig. 5a). The chroma- ticity coordinates, a* and b*, denoting redness and yellowness, increased during PM and flattened during FM (Fig. 5b and c). Further- more, the feedstock CPE (dashed line) had similar redness and yellow- ness values as the milled CPE, however, was less light. Thus, as the particles size was reduced, the CPE appeared lighter, more red and yellow. Li et al. (2014) also found an increase of a* and b* and Germann et al. (2019) recorded an increase of a* upon alkalization. The high temperature and low pH caused the observed increase of red-yellow color due to reactions such as Maillard, sugar degradation and antho- cyanin polymerizing. However, compared to the milling, the alkaliza- tion led to the formation of darker color (Li et al., 2014). This phenomenon of a decrease in L* was not observed during milling at elevated temperatures, as the darkening might have been suppressed by the fact that smaller particles appear brighter due to a higher number of scattering events. The change in color might in addition be attributed to changes in particle size and particle size distribution, as they are important factors in determining optical properties (Galinski et al., 2020). This shift in color could be beneficial if the powder is used as natural coloring agent for confectionery products. Thus, a proper design of the color of the powder could lead to additional value.
3.3. Thermal stability
As shown in the previous section, the longer and more intense (rotational speed), the larger the energy was imposed on the CPE pow- der. For wood pulp it has previously been reported by Huang et al.
(2019), that the energy input can change the composition of the degree of polymerization and amorphic composition of cellulose. Therefore, the thermal stability of the powder was further investigated.
As a measure of the degree of polymerization, the decomposition temperature of CPE for different milling times is depicted in Fig. 6a.
Moreover, Fig. 6b summarizes the decomposition temperature as a function of the total energy input for all trials conducted. The decom- position temperature Tdecomp was significantly (p ≤ 0.05, n = 32) reduced by the milling from 312 ◦C to about 306 ◦C. This indicated a change in the degree of polymerization and amorphic parts of the cel- lulose. Interestingly, it was shown that with larger total energy input than 1.5 Wh/g, no significant change (p >0.05, n =9) in decomposition temperature was further observed, resulting in a robust product for further storage and refinement.
3.4. Crystallinity
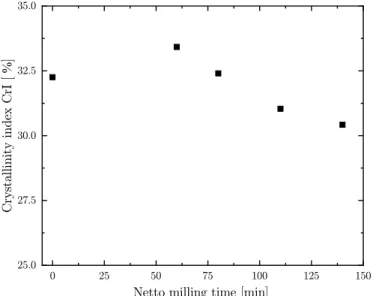
To complement the findings of the decomposition temperature, XRD
Fig. 3.a) Normalized particle size as a function of milling time at different rotational speed and varied ball diameter d. b) Grinding rate Kp as a function of different rotational speed and varied ball diameter d.
L. Grob et al.
measurements were also conducted. As reported by Segal et al. (1959), the crystallinity of cellulose could be extracted with Eq. (1). Fig. 7 summarizes this change of amorphic composition as function of the crystallinity index CrI over milling time. A slight reduction of the crys- tallinity index was observed, this is in contrast to findings from other cellulose based materials (El-Sakhawy and Hassan, 2007; Kano and Saito, 1998; Mio et al., 2004). There a significant reduction of the CrI as a consequence was found (p ≤0.05). It could be suggested that the lack of change in crystallinity could be due to the pre-treatment preceded by harvesting. In addition, the initial drying and milling with a hammer
mill could influence the observed crystallinity and should be further investigated. From our findings it could be concluded that no further change in composition occurred during the FM milling with 10 mm balls. In summary, as previously shown in Fig. 6, an energy input of smaller than 1.5 Wh/g is not of interest as it yielded too large particle sizes for further confectionery applications.
3.5. Specific surface area
Due to the particle size reduction, the specific surface area (SSA) of Fig. 4. a) Change of particle size due to ball milling summarized with total energy consumption. b) Corresponding particle size distribution to fine milling. c) Corresponding SEM pictures to the indicated milling parameters A-D.
Fig. 5.Change of CPE powder color with increasing energy consumption. a): L*, b): a*, and c): b* in the LAB* color scale. Dashed horizontal line indicates the dried starting material. (For interpretation of the references to color in this figure legend, the reader is referred to the Web version of this article.)
Journal of Food Engineering 305 (2021) 110591
6
the CPE powder was further increased. To get a relation to the energy consumption, the specific energy consumption (SEC) needed to create a new surface was also calculated according to Eq. (4). In Fig. 8, we have shown how SSA and SEC of the particles were increased as a function of milling time. The measured specific surface area created by the ball mill is in agreement with results obtained by Huang et al. (2019) for wood pulp of about 80 m2/g after 30 min of ball milling. Further, also a linear relationship was found for the specific energy needed to create a new surface area with milling time. This suggested that already a large amount of energy was dissipating and heating up the product with short milling times. Operating the mill in the interval setting, 5 min rotation followed by 5 min of break before changing direction, helped to prevent overheating and the product end temperature did not change.
3.6. Flow behavior in suspension
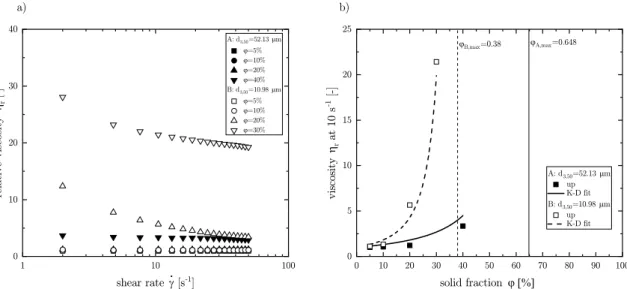
With decrease in particle size, change in anisotropy and surface roughness, the behavior of cellulose powders can express different flow behaviors when mixed in a suspension (see Fig. 9a). The obtained relative viscosity ηr (− ) is the viscosity η (Pa s) of the model suspension corrected by the viscosity of the MCT oil at 25 ◦C (η0 =23.84 mPa s). In the model suspension (particle loading in MCT oil), a shear thinning behavior was observed for two different particle size distributions (d3,50
=52.13 and 10.98 μm) at high solid fractions ϕ (40 wt% and 20 wt%
respectively). The orientation of particles due to the increased shear decreased the relative viscosity. Whereas at low solid fractions a shear independent flow behavior was observed. When comparing the relative viscosity at 10 s−1 to the packing fraction, the application possibility of different particle sizes became apparent (see Fig. 9b). The relative vis- cosity behaves like expected by Eq. (5) (Krieger and Dougherty, 1959) with a Newtonian behavior at low solid fractions followed by a rapid increase at high solid fractions.
ηr=η η0=
( 1− ϕ
ϕmax )− [η]⋅ϕmax
Eq. (6) The best fit to the relative upper viscosities measurements lead for (A) to a maximum packing fraction ϕmax =0.65 and an intrinsic viscosity [η] =2.5 resembling the value of an ideal sphere. When particle size was decreased (B) the maximum packing fraction decreased to ϕmax =0.38 and the intrinsic viscosity rose to [η] =7.4, suggesting an increase in the aspect ratio and surface roughness. Marti et al. (2005) found for fibers with an aspect ratio of 4 an intrinsic viscosity of 4.2. The plate-like character of the powder could also be confirmed by the SEM pictures.
The observed aspect ratio of 1.7–1.9 concluded that surface properties were also changed drastically. This change in surface properties lead to the immobilization of more surrounding oil thus the increased apparent Fig. 6. a) Heat flux of CPE powder milled at 340 rpm with ball diameter d =20 mm for different milling times. b) Decomposition temperature Tdecomp for different total energy consumption. Line to guide the eye.
Fig. 7. Crystallinity index (CrI) of material fine milled (d =10 mm) at 430 rpm.
Initial crystallinity of dried starting material is also included.
Fig. 8. Increase in specific surface area (SSA) and specific energy (SEC) con- sumption as function of milling time for CPE milled at 430 rpm.
L. Grob et al.
intrinsic viscosity.
4. Conclusion
In this study we have investigated the processing parameters of a planetary ball mill on cocoa pod endocarp (CPE) as a functional ingre- dient. Processing parameters such as milling time and rotational speed showed large influence on the grinding rate Kp and therefore on the micronization of the CPE. It was shown that the preferred parameters in order to obtain particles smaller than 30 μm (d3,50) are a combination of two different ball diameters and rotational speed of 370 and 420 rpm.
The processed powder showed to have a rough surface and anisotropic shape with an aspect ratio of 1.7–1.9. In accordance, the change in intrinsic viscosity lead to a more pronounced immobilization of the oil phase and a decrease in the maximum packing fraction of approximately 38% for a powder with d3,50 =10.98 μm was reported. Further, it was shown that the final CPE powder properties, such as color, thermal stability and crystallinity can be adjusted according to the total energy input. Thermal stability and crystallinity did not show a significant change (p ≤ 0.05) during the fine milling step. This study provides valuable insight in the processing of cocoa pod endocarp as a functional ingredient for further use in applications in the confectionery industry.
These applications could include the use of the powder as fiber source or coloring agent.
Credit author statement
Lucas Grob: Conceptualization, Writing – original draft, Visualiza- tion. Eileen Ott: Investigation. Selina Schnell: Investigation. Erich J.
Windhab: Writing – review & editing, Funding acquisition.
Declaration of competing interest
The authors declare that they have no known competing financial interests or personal relationships that could have appeared to influence the work reported in this paper.
Acknowledgements
This work was supported by Innosuisse [Project number 38337.1 IP- LS], Switzerland. We would like to thank ScopeM ETH Zürich especially Stephan Handschin for the SEM and Lydia Zehnder of the Institute of Geochemistry and Petrology for the advisory of the XRD measurements.
The authors also want to extend their gratitude to Koa Switzerland AG for providing the raw material.
References
Afoakwa, E.O., Paterson, A., Fowler, M., Vieira, J., 2009. Comparison of rheological models for determining dark chocolate viscosity. Int. J. Food Sci. Technol. 44, 162–167. https://doi.org/10.1111/j.1365-2621.2008.01710.x.
de Boer, G.B.J., de Weerd, C., Thoenes, D., Goossens, H.W.J., 1987. Laser diffraction spectrometry: fraunhofer diffraction versus mie scattering. Part. Part. Syst. Char. 4, 14–19. https://doi.org/10.1002/ppsc.19870040104.
El-Sakhawy, M., Hassan, M.L., 2007. Physical and mechanical properties of microcrystalline cellulose prepared from agricultural residues. Carbohydr. Polym.
67, 1–10. https://doi.org/10.1016/j.carbpol.2006.04.009.
Galinski, H., Jeoffroy, E., Zingg, A., Grob, L., Rühs, P.A., Spolenak, R., Studart, A.R., 2020. Optical properties and structural coloration of chocolate. Appl. Phys. Lett.
117, 183701. https://doi.org/10.1063/5.0028535.
Germann, D., Stark, T.D., Hofmann, T., 2019. Formation and characterization of polyphenol-derived red chromophores. Enhancing the color of processed cocoa powders: Part 1. J. Agric. Food Chem. 67, 4632–4642. https://doi.org/10.1021/acs.
jafc.9b01049.
Gyedu-Akoto, E., Yabani, D., Sefa, J., Owusu, D., 2015. Natural skin-care products: the case of soap made from cocoa pod husk potash. Adv. Res. 4, 365–370. https://doi.
org/10.9734/AIR/2015/17029.
Huang, L., Wu, Q., Wang, Q., Wolcott, M., 2019. Mechanical activation and characterization of micronized cellulose particles from pulp fiber. Ind. Crop. Prod.
141, 111750. https://doi.org/10.1016/j.indcrop.2019.111750.
ICCO, 2020. ICCO Quaterly Bulletin of Cocoa Statistics, XLVI. No.3.
Kano, J., Saito, F., 1998. Correlation of powder characteristics of talc during Planetary Ball Milling with the impact energy of the balls simulated by the Particle Element Method. Powder Technol. 98, 166–170. https://doi.org/10.1016/S0032-5910(98) 00039-4.
Krieger, I.M., Dougherty, T.J., 1959. A mechanism for non-Newtonian flow in suspensions of rigid spheres. Trans. Soc. Rheol. 3, 137–152. https://doi.org/
10.1122/1.548848.
Li, Y., Zhu, S., Feng, Y., Xu, F., Ma, J., Zhong, F., 2014. Influence of alkalization treatment on the color quality and the total phenolic and anthocyanin contents in cocoa powder. Food Sci. Biotechnol. 23, 59–63. https://doi.org/10.1007/s10068- 014-0008-5.
Lu, F., Rodriguez-Garcia, J., Van Damme, I., Westwood, N.J., Shaw, L., Robinson, J.S., Warren, G., Chatzifragkou, A., McQueen Mason, S., Gomez, L., Faas, L., Balcombe, K., Srinivasan, C., Picchioni, F., Hadley, P., Charalampopoulos, D., 2018.
Valorisation strategies for cocoa pod husk and its fractions. Curr. Opin. Green Sustain. Chem. 14, 80–88. https://doi.org/10.1016/j.cogsc.2018.07.007.
Mansur, D., Tago, T., Masuda, T., Abimanyu, H., 2014. Conversion of cacao pod husks by pyrolysis and catalytic reaction to produce useful chemicals. Biomass Bioenergy 66, 275–285. https://doi.org/10.1016/j.biombioe.2014.03.065.
Marti, I., H¨ofler, O., Fischer, P., Windhab, E.J., 2005. Rheology of concentrated suspensions containing mixtures of spheres and fibres. Rheol. Acta 44, 502–512.
https://doi.org/10.1007/s00397-005-0432-9.
Mio, H., Kano, J., Saito, F., 2004. Scale-up method of planetary ball mill. Chem. Eng. Sci.
59, 5909–5916. https://doi.org/10.1016/j.ces.2004.07.020.
Rosenkranz, S., Breitung-Faes, S., Kwade, A., 2011. Experimental investigations and modelling of the ball motion in planetary ball mills. Powder Technol. 212, 224–230.
https://doi.org/10.1016/j.powtec.2011.05.021.
Fig. 9.a) Upward flow curve for suspensions with different particle fractions in MCT oil. Different processing conditions A and B yielding mean particle size of d3,50
=52.13 and 10.98 μm. b) Relative viscosity at 10 s-1 as a function of solid fraction. Fit according to Krieger-Dougherty model included.
Journal of Food Engineering 305 (2021) 110591
8 Segal, L., Creely, J.J., Martin, A.E., Conrad, C.M., 1959. An empirical method for
estimating the degree of crystallinity of native cellulose using the X-ray diffractometer. Textil. Res. J. 29, 786–794. https://doi.org/10.1177/
004051755902901003.
Sobamiwa, O., Longe, O.G., 1994. Utilization of cocoa-pod pericarp fractions in broiler chick diets. Anim. Feed Sci. Technol. 47, 237–244. https://doi.org/10.1016/0377- 8401(94)90127-9.
Stokes, M., Fairchild, M., Berns, R., 1992. Colorimetrically quantified visual tolerances for pictorial images. TAGA 757, 757.
Vriesmann, L.C., de Mello Castanho Amboni, R.D., de Oliveira Petkowicz, C.L., 2011.
Cacao pod husks (Theobroma cacao L.): composition and hot-water-soluble pectins.
Ind. Crop. Prod. 34, 1173–1181. https://doi.org/10.1016/j.indcrop.2011.04.004.
Wiman, M., Dienes, D., Hansen, M.A.T., van der Meulen, T., Zacchi, G., Lid´en, G., 2012.
Cellulose accessibility determines the rate of enzymatic hydrolysis of steam- pretreated spruce. Bioresour. Technol. 126, 208–215. https://doi.org/10.1016/j.
biortech.2012.08.082.
L. Grob et al.