16 Logistik und Supply Chain Management
Mobility in a Globalised World 2016
E ric Sucky, Reinhard Kolke, Niels Biethahn, Jan Werner, Günter
Koch (Hg.)
Band 16
2017
Herausgegeben von
Prof. Dr. Eric Sucky
Eric Sucky, Reinhard Kolke, Niels Biethahn, Jan Werner, Günter Koch (Hg.)
2017
Deutschen Nationalbibliographie; detaillierte bibliographische Informationen sind im Internet über http://dnb.d-nb.de/ abrufbar.
Dieses Werk ist als freie Onlineversion über den Hochschulschriften-Server (OPUS;
http://www.opus-bayern.de/uni-bamberg/) der Universitätsbibliothek Bamberg er- reichbar. Kopien und Ausdrucke dürfen nur zum privaten und sonstigen eigenen Gebrauch angefertigt werden.
Herstellung und Druck: docupoint, Magdeburg Umschlaggestaltung: University of Bamberg Press
© University of Bamberg Press Bamberg 2017 http://www.uni-bamberg.de/ubp/
ISSN: 2191-2424
ISBN: 978-3-86309-489-8 (Druckausgabe)
eISBN: 978-3-86309-490-4 (Online-Ausgabe)
URN: urn:nbn:de:bvb:473-opus4-492050
Logistik und Supply Chain Management
Herausgegeben von
Prof. Dr. Eric Sucky
Kontakt
Univ.-Prof. Dr. Eric Sucky, Otto-Friedrich-Universität Bamberg, Lehrstuhl für BWL, insb. Produktion und Logistik,
Feldkirchenstr. 21, 96052 Bamberg
Das erfolgreiche Management sowohl unternehmensinterner als auch unternehmensübergrei-
fender Wertschöpfungsprozesse, Wertschöpfungsketten und ganzer Wertschöpfungsnetzwerke
basiert im Besonderen auf dem zielgerichteten Einsatz von bestehenden und weiterentwickel-
ten Methoden und Konzepten des Produktions- und Logistikmanagements sowie des Operati-
ons Research, dem Einsatz von innovativen Informations- und Kommunikationstechnologien
sowie theoretischen und praktischen Erkenntnissen des Kooperationsmanagements. Die Schrif-
tenreihe dient der Veröffentlichung neuer Forschungsergebnisse auf den Gebieten Logistik und
Supply Chain Management. Aufgenommen werden Publikationen, die einen Beitrag zum wis-
senschaftlichen Fortschritt in Logistik und Supply Chain Management liefern.
Mobility in a
Globalised World 2016
Editors
The term mobility has different meanings in the following science disciplines. In economics, mobility is the ability of an individual or a group to improve their eco- nomic status in relation to income and wealth within their lifetime or between gen- erations. In information systems and computer science, mobility is used for the con- cept of mobile computing, in which a computer is transported by a person during normal use. Logistics creates by the design of logistics networks the infrastructure for the mobility of people and goods. Electric mobility is one of today’s solutions from engineering perspective to reduce the need of energy resources and environ- mental impact. Moreover, for urban planning, mobility is the crunch question about how to optimise the different needs for mobility and how to link different transporta- tion systems.
In this publication we collected the ideas of practitioners, researchers, and govern- ment officials regarding the different modes of mobility in a globalised world, fo- cusing on both domestic and international issues.
Eric Sucky, Reinhard Kolke, Niels Biethahn, Jan Werner, Günter Koch
Dr.-Ing. Rein- hard Kolke
Reinhard Kolke holds a PhD in engineering from the Mechanical engineering faculty at Otto-von-Guericke University in Magde- burg, Germany. After different tasks at the Federal Environment Agency, he headed the research and development department at medium-size company in Germany. In 2007, he became the Di- rector of ADAC’s strategic business unit Test and Technical Af- fairs. Furthermore, he is a Director in the Euro NCAP Board, chairman of the FIA Technical Working Group of the European Automobile Clubs and chairman of the FIA Technical Commis- sion on world level.
Univ.-Prof. Dr.
Eric Sucky
Eric Sucky received his PhD from the School of Economics and
Business Administration at the Johann Wolfgang Goethe Univer-
sity Frankfurt, Germany. Currently, he is Professor of Operations
Management and Business Logistics at the University of Bam-
berg, Germany.
Jan Werner holds a PhD in Economics from the Johann Wolfgang Goethe University in Frankfurt, Germany. He has worked inter alia for the World Bank, UNDP, the Asian Development Bank, the European Parliament and the GIZ. He was a Guest Professor at the Université Lumière de Lyon 2, France and at the Istanbul Bilgi Universit, Turkey. Currently, he is the Lead Economist at the Institute of Local Public Finance in Langen, Germany as well as Professor of Economics at the Cologne Business School, Uni- versity of Applied Sciences, Germany.
Prof. Dr. Niels Biethahn
Prof. Dr. Jan Werner
Niels Biethahn received his doctorate in Economic Sciences at the Ruhr-Universität in Bochum, Germany. Besides various posi- tions in business consultancy, he significantly contributed to a restructuring process for a medium-sized automobile supplier as its Commercial Managing Director. Since 2009, he has been a lecturer at the Business and Information Technology School in Iserlohn. Additional to his task as a professor he is one of the founder of the “Institut für Automobil Forschung” in Dortmund.
Moreover, he is one of the owners of the OPEX management simulation.
Prof. Günter Koch
Günter Koch is guest professor in telecom management at “Dan- ube University”, and adj. professor in informatics at the IICM- Institute of the Technical University of Graz. His current profes- sional affiliations are with Humboldt Cosmos Multiversity in Tenerife, an interdisciplinary discourse platform. His latest ap- pointment as CEO of a science organisation was with
the Austrian Institute of Technology (AIT), Austria’s largest ap-
plied research organization. Key area of his today's work is in
knowledge economics and management. In this role he was one of
three founders of the international New Club of Paris.
Danksagung
Wir als Herausgeber wollen uns zunächst bei allen Vortragenden der 6. „Mobility in a Globalised World“-Konferenz in Wien bedanken. In diesen zwei Tagen wurde den Teilnehmern ermöglicht, einen Überblick über die wesentlichen Forschungsthemen zum Thema Mobilität zu erhalten. Den Vortragenden einen vielen lieben Dank für diese spannenden Beiträge.
Unser größter Dank geht dieses Jahr an unseren Wiener Kollegen Prof. Koch. Gün- ter Koch hat die Konferenz zu etwas Besonderem gemacht, indem er nicht nur viele Türen zu Wiener Kollegen geöffnet, sondern auch ein sehr schönes, regional gepräg- tes Konferenzbegleitprogramm entwickelt hat. Er hat maßgeblich dafür gesorgt, dass die Konferenz auch in diesem Jahr ein in bleibender Erinnerung bleibendes Ereignis geworden ist.
Danken möchten wir des Weiteren Herrn Thomas Madreiter, dem Planungsdirektor der Stadt Wien, für seinen Begrüßungsvortrag zum Thema „Wien als Smart City“.
Herrn John Favaro möchten wir ganz herzlich neben seinem Vortrag für das wun- derschöne Gitarrenkonzert am Abend des ersten Veranstaltungstages danken.
Ein Dank geht auch an Prof. Dr. Dr. hc mult. Martin Gerzabek, der uns die Nutzung der Räumlichkeiten an der Universität für Bodenkultur Wien ermöglicht hat.
Herzlich danken möchten wir den diesjährigen Sponsoren der Konferenz, nämlich der Kapsch AG, vertreten durch deren Vorstandsvorsitzenden Mag. Georg Kapsch sowie dem Austrian Institute of Technology, vertreten durch den Leiter des Depart- ments Digital Safety & Security, Dipl. Ing. Helmut Leopold.
Ein besonderer Dank dient den Verantwortlichen der interdisziplinären „For- schungsstelle für nachhaltige Güter- und Personenmobilität“ an der Universität Bamberg, den Herren Niels Biethahn, Reinhard Kolke, Eric Sucky sowie Jan Wer- ner. Zu danken ist auch den Mitgliedern des Scientific Commitees, die viel Zeit für die Prüfung der eingegangenen Abstracts aufgewendet haben.
Ein herzlicher Dank geht auch an die Modulleiter, die für die Ausgestaltung des Programms zuständig waren.
Herzlichen Dank gilt dem Team von Eric Sucky an der Universität Bamberg, insbe- sondere Immanuel Zitzmann und Andreas Amschler. Immanuel Zitzmann und An- dreas Amschler haben in vielen Stunden aus verschiedensten Vorlagen dafür ge- sorgt, dass Sie als Leser ein ansprechendes Werk vor sich haben.
Bamberg, März 2017
Eric Sucky, Günter Koch, Niels Biethahn, Jan Werner, Reinhard Kolke
Inhaltsverzeichnis
Mobility in Logistics ... 3 Eric Sucky
Supply Chain Performance Measurement – A Case Study ... 5 Jan Strahwald, Eric Sucky
Das transatlantische Handels- und Investitionsabkommen (TTIP) aus Sicht
der Unternehmen – Ergebnisse einer empirischen Studie ... 33 Sabine Baschke, Eric Sucky
Analyse des Potenzials der Elektromobilität im Hinblick auf das logistische
Problem der letzten Meile ... 55 Jonas Wiese, Kristina Gumpert
Smart und Sustainable? – Industrie 4.0 aus der Perspektive der
Nachhaltigkeit ... 78 David Karl, Immanuel Zitzmann
Logistics & Business Models ... 101 Niels Biethahn
ÖPP-Modell unter Beteiligung einer Verkehrsinfrastrukturgenossenschaft ... 103 Melanie Beck
Von Stadt und Land: Unterschiede in Nutzung und Wahrnehmung des
eigenen Fahrzeugs ... 123 Jan Hendrik Schreier, Niels Biethahn
Analyse des Änderungsdrucks im Autohandel – aus Sicht der Händler ... 139
Niels Biethahn
Mobility in Urban Economics ... 155 Jan Werner
Wer hat für die Sicherheit bei Fußballgroßveranstaltungen zu zahlen – der
Zuschauer, der Verein oder der Steuerzahler?... 157 Volker Busch
Freihandel, Protektionismus und der Amtsantritt des amerikanischen
Präsidenten – eine vorläufige Bewertung ... 164 Michael Vogelsang
Options to support urban infrastructure delivery in Pakistan – a survey
for the province of Khyber Pakhtunkhwa ... 175 Jan Werner
New Urban Tourism and its Implications for Tourism Mobility – the Case of Munich ... 202 Andreas Kagermeier, Werner Gronau
E-Mobility in Local Public Transport – The Next ‘Big Thing’ of the
‘Energiewende’? ... 217 Andreas Seeliger
Klassische Konzepte zur Dynamisierung des Raums ... 224 Nicolai Scherle
Engineering – Towards Autonomous Driving ... 237 Reinhard Kolke
Development & Simulation of a Test Environment for Vehicle Dynamics a
Virtual Test Track Layout ... 239
Kmeid Saad
Einfluss von Reifen- und Fahrbahneigenschaften auf die Funktionalität von
Fahrerassistenzsystemen ... 251 Cornelia Lex et al.
Zukünftige Tests von Fahrerassistenzsystemen im Verbraucherschutz ... 267 Andreas Riegling
Urban Mobility Trends ... 293 Niels Biethahn
From public mobility on demand to autonomous public mobility on demand – Learning from dial-a-ride services in Germany ... 295 Alexandra König, Jan Grippenkoven
Mobil mit der Smartwatch: Ergebnisse eines Prototypentests ... 306 Christoph Link et al.
Organizational Flexibility and Aging Population in Germany ... 325
Nils Britze
Mobility in
Logistics
Mobility in Logistics Univ.-Prof. Dr. Eric Sucky
Lehrstuhl für Betriebswirtschaftslehre, insb. Produktion und Logistik, Otto-Friedrich-Universität Bamberg, Feldkirchenstr. 21, 96052 Bamberg, eric.sucky@uni-bamberg.de
Die Mobilität von Gütern und Personen stellt eine wesentliche Grundlage von Wirt- schaft und Gesellschaft dar. Effiziente Personen- und Güterverkehrssysteme sind daher unverzichtbar, um wirtschaftliches Wachstum in Volkswirtschaften sicher zu stellen. Der Wunsch nach individueller Mobilität und individuellem Waren- und Güterverkehr im Spannungsfeld von Zeit, Kosten und Qualität erfordert dynamische Innovationsprozesse, welche mit Blickrichtung auf die Faktoren Sicherheit, Funkti- onalität, Umwelt und Globalisierung neben neuen Technologien auch zukunftswei- sende Logistiksysteme, Logistikkonzepte und logistische Dienstleistungen umfas- sen.
Logistische Leistungsprozesse finden in Supply Chains statt. Das zielgerichtete Ma- nagement von Supply Chains ist somit einerseits Grundlage für effiziente Logistik- prozesse, andererseits stellen effiziente Logistikprozesse eine Voraussetzung für ein erfolgreiches Supply Chain Management dar.
Seit der ersten Nennung des Begriffs Supply Chain Management in den späten 1980er Jahren werden Unternehmen kontinuierlich mit steigenden Anforderungen an das Management ihrer Supply Chains konfrontiert. Im Rahmen des Beitrags Supply Chain Performance Measurement – A Case Study wird anhand einer Fallstu- die gezeigt, wie Ineffizienzen in der Supply Chain identifiziert und überwunden werden können.
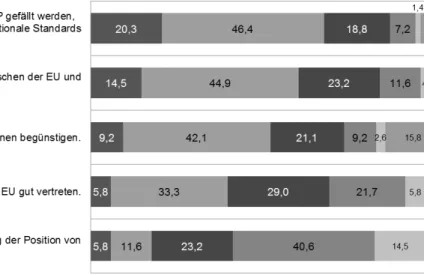
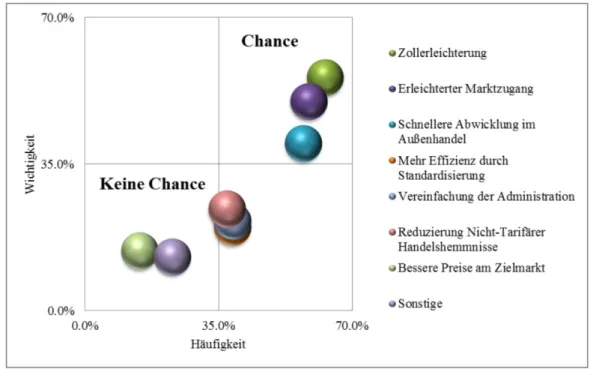
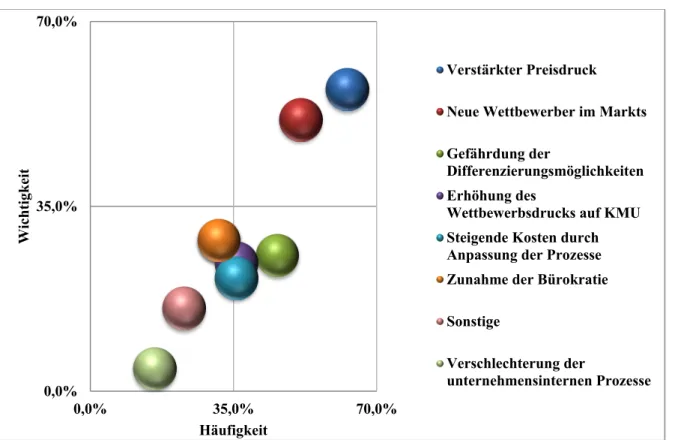
Der zweite Beitrag widmet sich dem stark mit der Globalisierung verbundenen
freien Welthandel. Im Fokus steht dabei Das transatlantische Handels- und Investi-
tionsabkommen (TTIP) aus Sicht der Unternehmen – Ergebnisse einer empirischen
Studie. Ziel dieses Beitrags ist es, die Bedeutung von TTIP aus Sicht der Unterneh-
men darzustellen. Dabei geht es vor allem um mögliche Auswirkungen des Ab-
kommens auf die Unternehmensumgebung sowie dessen Chancen- und Risikopo-
tenzial. Der Beitrag arbeitet Unterschiede in den Auswirkungen des Abkommens auf
die klein- und mittelständischen sowie die großen Unternehmen heraus. Insbesonde-
re wird analysiert, welcher Stellenwert beziehungsweise welches Veränderungspo-
tenzial TTIP von Seiten der Unternehmen eingeräumt wird. Auch wird geklärt, ob
Unternehmen, vor allem klein- und mittelständische Unternehmen, TTIP genauso
positiv einschätzen wie von Seiten der EU erhofft. Zur Beantwortung diese For-
schungsfragen wurde eine empirische Studie durchgeführt, deren Ergebnisse präsen-
tiert und interpretiert werden.
Im Rahmen der wachsenden Globalisierung nimmt auch die Mobilität innerhalb von Supply Chains zu. Die Individualisierung einzelner Produkte für Kunden sowie das Wachstum des E-Commerce-Handels führen zu einem generellen Anstieg des Gü- terverkehrsaufkommens. Grüne Logistik rückt daher insbesondere die ökologischen Auswirkungen von Transporten in den Mittelpunkt und erachtet deren Reduktion neben der obligatorischen Kostenminimierung als zusätzliches Formalziel. Der Bei- trag Analyse des Potenzials der Elektromobilität im Hinblick auf das logistische Problem der letzten Meile untersucht das Potenzial der Elektromobilität auf der letz- ten Meile in urbanen Ballungsräumen aus ökonomischer, ökologischer und sozialer Perspektive. Für die Analyse sind sowohl der theoretische Rahmen als auch der der- zeitige Stand der Forschung maßgebend, da sie die Grundlage für die empirische Untersuchung mittels leitfadengestützter Experteninterviews bilden. Die Befragung von sechs Experten aus dem (Güter-) Verkehrssektor verdeutlicht, dass speziell bat- terieelektrische Fahrzeuge schon heute vielseitige Vorteile bieten und wegen des Tourenprofils der letzten Meile prädestiniert für die Verteilfahrten in Stadtgebieten sind.
Industrie 4.0 ist sowohl Herausforderung wie auch Chance für den Wirtschafts- standort Deutschland. In der Diskussion um die Veränderung der industriellen Ar- beitswelt wird neben Cyber-Physischen Systemen, dem Internet der Dinge und Dienstleistungen, Selbststeuerung und Mobilität auch von der Nachhaltigkeit dieser Entwicklung gesprochen. Was darunter zu verstehen ist, bleibt jedoch meist unklar.
Dies mag zum einen am ebenfalls schwer zu fassenden Begriff der Nachhaltigkeit liegen, zum anderen aber auch an der Tatsache, dass oft unklar ist, welche Auswir- kungen die vierte industrielle Revolution auf ökologische oder soziale Aspekte der Produktion hat. Diesen Konsequenzen geht der Beitrag Smart und Sustainable? – Industrie 4.0 aus der Perspektive der Nachhaltigkeit nach.. Ziel ist es dabei, Chan- cen und Risiken aufzuzeigen, die die Industrie 4.0 für ein nachhaltiges Wirtschaften birgt.
Supply Chain Performance Measurement – A Case Study Jan Strahwald, Univ.-Prof. Dr. Eric Sucky
Otto-Friedrich-Universität Bamberg, Lehrstuhl für Betriebswirtschaftslehre, insb.
Produktion und Logistik, Feldkirchenstraße 21, 96052 Bamberg, eric.sucky@uni-bamberg.de
1 Introduction ... 6
2 Supply Chain Performance Measurement ... 7
3 Supply Chain Performance within an Electrical Industry Enterprise ... 22
4 Conclusion ... 28
5 Bibliography ... 29
Abstract:
Today, organizations are confronted with numerous changes in the business environment, such as increasing levels of global competition, rising customer requirements, shrinking product lifecycles, and the fast pace of technological change. To meet these environmental changes, organizations need to expand outside their legal boundaries and form competitive networks. This includes the development of strategically aligned capabilities among all organizations that are part of their val- ue-adding networks. Increased networking with suppliers, sales partners, and customers requires active management to guarantee optimization of the entire supply chain. Supply chain management (SCM) has therefore evolved into a strategic factor of differentiation and competitiveness in many business segments. However, many companies have not succeeded in maximizing their supply chain’s potential. The lacking implementation of the SCM concept in practice is one common rea- son. Another widespread reason is the deficiency of performance measures and metrics to fully integrate the supply chain. Performance measurement and metrics play an important role in setting objectives, evaluating performance, and determining future courses of action. In this case study, an electrical industry enterprise will be considered. The company offers a wide spectrum of products, systems, solutions, software and services. To create transparency, identify performance gaps, and come up with improvements to close these gaps, this contribution aims to answer the following questions:
How can supply chain performance be measured in general?
What is an appropriate approach to meet the requirements of the considered company’s daily oper- ations to create transparency?
What is the enterprise’s performance? What are the recommendations for actions to overcome per- formance gaps?
JEL Classification: M21
Keywords: Supply chain management, performance measurement, maturity models
1 Introduction
Today, organizations are confronted with numerous changes in the business envi- ronment, such as increasing levels of global competition, rising customer require- ments, shrinking product lifecycles, and the fast pace of technological change.
1To meet these environmental changes, organizations need to expand outside their legal boundaries and form competitive networks. This includes the development of strate- gically aligned capabilities among all organizations that are part of its value-adding networks. Increased networking with suppliers, sales partners, and customers re- quires active management to guarantee the optimization of the entire supply chain.
2Supply chain management (SCM) has therefore evolved into a strategic factor of differentiation and competitiveness in many business segments.
3However, many companies have not succeeded in maximizing their supply chain’s potential.
4The lacking implementation of the SCM concept in practice is one common reason.
5An- other widespread reason is the deficiency of performance measures and metrics to fully integrate the supply chain.
6Performance measurement and metrics play an im- portant role in setting objectives, evaluating performance, and determining future courses of action. Therefore, it is doubtful whether managers have actual and specif- ic information about their deficits related to SCM performance and the ability to make the right decisions to overcome these gaps.
7Due to the increasing level of complexity, supply chain visibility is becoming an increasingly important criterion in the long-term competitiveness of the supply chain.
8It ensures accurate and fast delivery of relevant information and thus represents a critical basis for decision mak- ing.
9The more accurate the information shared within a supply chain network, the higher the transparency.
10According to Enslow (2006), a lack of critical supply chain process visibility is the top concern of most companies for maintaining their supply chain operations.
11Companies are therefore prioritizing visibility programs to enhance customer satisfaction and operational efficiency.
In this case study, an electrical industry enterprise will be considered. The company offers a wide spectrum of products, systems, solutions, software and sevices. In or- der to create transparency, identify performance gaps, and come up with improve- ments to close these gaps, this contribution aims to answer the following questions:
1
Cf. Lockamy III/McCormack (2004), p. 272; Arndt (2008), pp. 8–26; Handfield/Bechtel (2002), pp. 368- 369.
2
Cf. Corsten/Gabriel (2004), p. 4.
3
Cf. Staberhofer/Rohrhofer (2007), pp. 37-38.
4
Cf. Gunasekaran et al. (2004), p. 335.
5
Cf. Jording/Sucky (2016), p. 99.
6
Cf. Gunasekaran et al. (2004), p. 335.
7
Cf. Gunasekaran et al. (2004), p. 333; Jording/Sucky (2016), p. 99.
8
Cf. Bartlett et al. (2007), p. 294.
9
Cf. Chan (2003), p. 540.
10
Cf. Svensson (2004), p. 743.
11
Cf. Enslow (2006), pp. 1-2.
How can supply chain performance be measured in general?
What is an appropriate approach to meet the requirements taken from the con- sidered company’s daily operations to create transparency?
Which performance metrics exist in the field of SCM and which are most suita- ble for measuring the company’s performance?
What is the enterprise’s performance? What are the recommendations for ac- tions to overcome performance gaps?
This paper is therefore organized as follows. Chapter 2 presents maturity models as a method of measuring SCM performance. The examination of different maturity models helps identify an approach that meets the requirements of the practical ex- ample. Chapter 2 also provides an overview of existing performance measurements and metrics in the context of SCM. Chapter 3 demonstrates the approach and the results of the performance study for the examined company. This includes the per- formance analysis as well as the recommendations for action. Chapter 4 summarizes the findings and arrives at a conclusion regarding the importance of supply chain performance measurement and the creation of transparency.
2 Supply Chain Performance Measurement
In this chapter, we describe how SCM performance can be measured and why com- panies should address SCM and its performance measurement. In the first instance, this requires an explanation of the term and importance of SCM. Subsequently, ma- turity models are introduced as a method of measuring SCM performance. The in- troduction includes the characterization of maturity models in general, the definition of SCM maturity models in particular, and the analysis of existing SCM maturity models in the literature. The analysis is based on the literature review of Jording and Sucky (2016) and intends to find an approach that meets the requirements of the practical example as described in the introduction. Finally, chapter 2 explains the crucial aspects of effective performance measurement and provides an overview of performance metrics in the context of SCM.
2.1 Supply Chain Management
A supply chain can be defined as a network of several business entities collectively responsible for product or service-related value creation, linked by a flow of goods, information, and funds.
12Ideally, the supply chain includes all business processes cutting across all organizations, from the initial supplier to the ultimate point of con- sumption.
13Then, supply chain management describes the integrated, coordinated
12
Cf. Asdecker (2014), p. 37; Swaminathan et al. (1998), p. 607; Tsay et al. (1999), p. 301; Sucky (2004), p.
13
18. Cf. Cooper et al. (1997), p. 5; Asdecker (2014), pp. 37-38.
planning, implementing, and controlling of value creation networks, comprising several business entities that are linked by a flow of goods, information, and funds.
14Cost reduction and the continuous improvement of competitiveness and customer service are the main objectives of SCM.
15The considered company defines supply chain management for itself as integrated, process-oriented planning, controlling, execution and monitoring of the processes of the value chain—within and across companies—to fulfill customer orders and sus- tainably improve performance and costs. The enterprise refers to the Supply Chain Operations Reference (SCOR) Model, developed by the Supply Chain Council, an independent, not-for-profit, global corporation.
16The SCOR Model is a cross- functional framework for evaluating and improving enterprise-wide supply chain performance. It is structured in four levels and focuses on the six supply chain pro- cesses: plan, source, make, deliver, return, and enable. This framework enables the considered company to model their processes and benchmark their performance against other supply chains.
17Then, the company can develop a roadmap to improve their performance vis-à-vis the benchmarks.
The high level of effort necessary for the development of an efficient SCM as well as the uncertainty and risk connected with this concept raise the question of why SCM is seen as a key to success.
18Would it not be easier to minimize the efforts for communication, coordination, and exchange of information between companies in order to save time and work? Would it not be beneficial for companies to focus on themselves in order to reduce complexity? According to practical and scientific stud- ies, the potential of SCM is significant. Studies show a reduction of inventory (up to 60 %), shorter lead times (up to 50 %), and improved forecasting accuracy (up to 80 %).
19Eisenbarth (2003), for instance, conducted a survey with first-tier automo- tive suppliers. The results show that approximately 70 % of the participants attach high importance to SCM.
20Approximately 90 % state that SCM will be especially important in the future.
21However, these findings do not correspond to the level of practical SCM implementations.
22A common way to illustrate this progress is the use of maturity models, which classify companies into different stages depending on their realization of SCM implementation. The “Global Survey of Supply Chain Pro- gress” uses a five-stage maturity model:
23The “Five Levels of Supply Chain Evolu-
14
Cf. Asdecker (2014), p. 39.
15
Cf. Cooper et al. (1997), p. 3; Heusler (2004), pp. 17-18.; Kotzab (2000), p. 33.
16
Cf. Stewart (1997), pp. 62–66; Stephens (2001), pp. 471–473; Bolstorff/Rosenbaum (2003), pp. 2–8;
Holmberg (2000), pp. 862-863; Reyes/Giachetti (2010), p. 416.
17
Cf. Reyes/Giachetti (2010), p. 416; Bolstorff/Rosenbaum (2003), pp. 2–8.
18
Cf. Staberhofer/Rohrhofer (2007), p. 29.
19
Cf. Beckmann (2004), pp.15–17; Staberhofer/Rohrhofer (2007), p. 29.
20
Cf. Eisenbarth (2003), p. 198.
21
Cf. Eisenbarth (2003), p. 198, Mayer et al. (2009), p. 26.
22
Cf. Jording/Sucky (2016), p. 98.
23
Cf. Poirier/Quinn (2006), pp. 19–24; Jording/Sucky (2016), p. 98.
tion” begins with the basic level of enterprise integration (level 1) and ends with the highest level of full network connectivity (level 5). It is shown that 57 % of the par- ticipating companies are assigned to stage one or two. Although companies assign high importance to SCM, the mentioned survey reveals a lack of implementation, i.e., a gap between aspiration and reality.
24Therefore, it is doubtful whether manag- ers have up-to-date and specific information about their deficits related to SCM and the ability to prioritize actions necessary to overcome this gap. Maturity models pro- vide a common way to assess the implementation of concepts or to identify gaps.
2.2 Maturity Models to Measure Supply Chain Performance
Essentially, maturity models are intended to describe the typical behavior exhibited by a company at a number of levels of “maturity”.
25This allows companies to codify what might be considered good practice (and, conversely, bad practice). In addition, there are some intermediate or transitional stages. The concept applies to a range of activities, including quality management, software development, supplier relation- ships, and many more, both as a means of assessment and as part of a framework for improvement. One of the earliest maturity approaches was Crosby’s Quality Man- agement Maturity Grid (QMMG).
26For this reason, most of the following approach- es have their roots in the field of quality management. The QMMG expects compa- nies to evolve through five levels of maturity before ascending to quality manage- ment excellence: uncertainty, awakening, enlightenment, wisdom and certainty. At each level, the performance of a number of key activities is described. For this pur- pose, the approach provides a descriptive text for the characteristic traits of perfor- mance for each level. The Capability Maturity Model (CMM) for Software, devel- oped by the Software Engineering Institute at Carnegie Mellon, is perhaps the best- known derivative from this line of work.
27“The Capability Maturity Model for Software provides software organizations with guidance on how to gain control of their processes for developing and maintaining software and how to evolve toward a culture of software engineering and management excellence.”
28The CMM for soft- ware provides a framework consisting of five maturity levels that define the extent to which a specific process is defined, managed, measured, controlled, and effec- tive.
29The fundamental assumption of this approach is that quality can be cultivated through control.
30Therefore, companies at higher maturity levels are better man- aged, have less risk, and are more likely to deliver a quality product that meets the
24
Cf. Jording/Sucky (2016), p. 99.
25
Cf. Fraser et al. (2002), p. 244.
26
Cf. Fraser et al. (2002), pp. 244-245.
27
Cf. Fraser et al. (2002), p. 244; Reyes/Giachetti (2010), p. 416.
28
Paulk et al. (1993), p. 5.
29
Cf. Paulk et al. (1993), pp. 4–7.
30
Cf. Klimko (2001), p. 271; Reyes/Giachetti (2010), p. 416.
budget and schedule. The software CMM inspired the development of other frame- works, such as the CMM for systems engineering (SE-CMM) and the CMM for in- tegrated product and process development (IPD-CMM).
31The most recent attempt to consolidate the multiple models is the integrated CMM (CMM-I), which has moti- vated the development of similar frameworks in other disciplines.
32“Although a number of different types of maturity models have been proposed […], they share the common property of defining a number of dimensions or process areas at several discrete stages of levels of maturity, with a description of characteristics perfor- mance at various levels of granularity.”
33Therefore, various components are the same or similar in each model:
34 A number of maturity levels (typically 3-6) to describe the development of a sin- gle entity
35in a simplified way
A descriptor for each level (such as initial, repeatable, defined) to organize the levels sequentially, from an initial level up to an ending level of perfection
A generic explanation or summary of the characteristics of each level as a whole
A number of dimensions or process areas, which in turn consist of a number of elements or activities
A description of each activity that the entity has to achieve on that level.
During development, the entity progresses from some initial state to some more ad- vanced state.
36“Some do it faster than others and with fewer detours, but fast or slow, every company that gets to world class must evolve through theses stages to get there.”
37Therefore, no stages can be left out. In assessing performance (i.e., ma- turity), a distinction is made between two types of models:
38On the one hand, there are models in which different activities may be scored at different levels. On the other hand, there are models in which maturity levels are “inclusive”, where a cumu- lative number of activities must all be performed. In practice, however, maturity models are not primarily used as absolute measures of performance but rather as part of an improvement process.
39In this regard, the purpose of using a maturity model is to identify a gap that can be closed by subsequent improvement actions.
31
Cf. Fraser et al. (2002), p. 245.
32
Cf. Reyes/Giachetti (2010), p. 416; Fraser et al. (2002), p. 245.
33
Fraser et al. (2002), p. 246.
34
Cf. Fraser et al. (2002), p. 246; Klimko (2001), p. 271.
35
This entity can be anything of interest like a human being, an organizational function etc.
36
Cf. Klimko (2001), p. 271.
37
Shapiro (1996), p. 147.
38
Cf. Fraser et al. (2002), p. 246.
39
Cf. Fraser et al. (2002), p. 248.
2.2.1 Overview of SCM Maturity Models
Many of the aforementioned approaches and ideas of maturity have been adapted to supply chains and their management.
40To analyze the characteristics of maturity models in the field of SCM, Jording and Sucky (2016) developed a design-based characterization of SCM maturity models. The goal of their work is to provide the reader with a purpose-driven design-based catalog that serves as a guideline for a more efficient construction of maturity models.
41For this reason, the authors per- formed a literature review to analyze existing maturity models based on five differ- ent core attributes:
General attributes: all aspects related to the development of the model
Conceptual attributes: all aspects that describe the formal content of the stages
Operationalization attributes: all aspects that describe the evolution process
Retention attributes: all aspects that describe the change process
Survey attributes: all aspects related to the evaluation of the model itself
The analysis of these models and their shortcomings reveal quality attributes of SCM maturity models, which then provide the basis of the purpose-driven catalog.
42This catalog specifies the essential building blocks of SCM maturity models. For the purpose of this paper, the literature review helped us preselect SCM maturity models and find an appropriate approach that meets the requirements of the practical exam- ple described in the introduction.
Figure 1: Maturity Model Differentiation.
43Based on the components of the maturity models described above, the authors de- veloped a definition of SCM maturity models necessary for the literature review process: “A maturity model can be defined as a construction-based model which consists of an anticipated, limited development path, separated into stages with de- fined characteristics and dimensions. It has one or more objectives related to the stage evaluation, gap identification and transformation. If a model of this kind fo-
40
Cf. Reyes/Giachetti (2010), p. 416.
41
Cf. Jording/Sucky (2016), p. 99.
42
Cf. Jording/Sucky (2016), p. 99.
43
Source: Jording/Sucky (2016), p. 105.
cuses [on] intercorporate collaboration, customer focus, management of flow of goods and/or management of information flow, it is called a SCM maturity model.”
44The examination of the numerous models identified in the literature review reveals that those models differ between the anticipated evolutionary content and the opera- tionalization of the stages.
45As depicted in Figure 1, some models prioritize the evo- lutionary content, whereas others prioritize a complex operationalization without having an anticipated stage-driven process. The three maturity models, “Maturity description models”, “Maturity models without assessment” and “Maturity models (Stages & Assessment)”, represent the review focus. Maturity description models and maturity models without assessment both lack a substantial method of assessing maturity, but they illustrate an anticipated development process. The authors sum- marized these two categories under the notion of “general maturity models”. Maturi- ty models providing an anticipated development process and a related assessment method represent “specific maturity models”. For detailed information regarding the literature review, see Jording and Sucky (2016).
2.2.2 Applicability of Selected Maturity Models to the Case Study
Following the literature review by Jording and Sucky (2016), eight general and eight specific maturity models are identified, which have to be examined in order to find an appropriate approach and framework for the practical example.
2.2.2.1 Applicability of General Maturity Models to the Case Study
The SCM focus area of the general maturity models most importantly narrows down the choice of an appropriate model. The selection of appropriate maturity models takes place according to the requirements of the case study, as described in the in- troduction. Therefore, models with unsuitable focus areas are excluded. Ultimately, only two general maturity models are worth considering: the “Global Supply Chain Progress Framework” and the “Supply Chain Visibility Roadmap”. However, nei- ther general maturity model turned out to be applicable to the practical example to the same extent. For the considered general maturity models, the number of stages varies between three and five, but both have in common that collaborative aspects gain in significance with a rising maturity level.
46The models can be criticized for their insufficient documentation quality and absence of substantial assessment of maturity. For this reason, none of the general maturity models are suitable for the practical example in terms of SCM performance measurement. However, the Supply Chain Visibility Roadmap provides an appropriate project approach for the practical
44
Jording/Sucky (2016), p. 104.
45
Cf. Jording/Sucky (2016), pp. 104-105.
46
Cf. Jording/Sucky (2016), pp. 105–107.
example. Steps one and three of the roadmap especially serve as a valuable template since they describe what needs to be considered when defining the strategy and the rollout plan of such a project. Therefore, only the “Supply Chain Visibility Roadmap” provides a helpful approach for the investigated company, which is why this model is presented here.
Supply Chain Visibility Roadmap
The goal of this approach is to identify the necessary steps for a successful visibility program that improves supply chain productivity, responsiveness, and reliability.
47Companies must evolve through three levels of maturity when seeking operational improvement and financial value from visibility technology. In the first level (Ship- ment Tracking), the system provides shipment tracking to locate the product. This information improves customer satisfaction and helps internal operations planning.
In the second level (Supply Chain Disruption Management), disruption management is notified proactively if shipments deviate from planned milestones and assists in problem resolution.
48This information improves the on-time delivery performance and lowers expediting costs. The greatest financial value comes in the third level (Supply Chain Improvement), when visibility information helps identify and elimi- nate root causes of delays. Effectiveness at this level has a positive impact on lead time, inventory investment, and freight cost. The successful implementation of such a supply chain visibility technology requires five critical steps, described in the Roadmap for Supply Chain Visibility: First, it is important to devise a visibility strategy. Since visibility develops over time, the strategy should focus on the highest problem areas first and then expand from there. The creation of an “as is” assess- ment of key metrics, targeted for improvement, is part of the strategy process. Key metrics should include both cross-functional and department-based metrics, such as cycle times, on-time delivery performance, or safety stock levels. The definition of the visibility strategy also includes the identification of responsibilities for the im- provement of each metric and the establishment of a cross-functional team with an executive sponsor. Second, the company has to select a visibility technology that meets their requirements.
49There are different visibility technologies available.
These can be classified into three categories: internally developed systems, systems provided by logistics providers and systems from commercial technology vendors.
The most important aspect of a visibility project is the creation of a rollout plan, de- scribed in step three.
50The project team has to determine which areas of the supply chain to concentrate on first. This requires the identification of small, simple pro- jects. Depending on the company, this can mean concentrating on certain regions,
47
Cf. Enslow (2006), p. I.
48
Cf. Enslow (2006), pp. 11-13.
49
Cf. Enslow (2006), pp. 13–16.
50
Cf. Enslow (2006), pp. 17–20.
shipments for key customers, or certain product lines, perhaps those with the highest value or time sensitivity. Assessing the availability of quality status data is another consideration for determining the scope. Therefore, it is beneficial to start with the smallest data set possible that still drives value. “Successful pilot programs often focus on areas in which better visibility will lead to significant improvements in lead times and on-time delivery performance […].”
51The fourth step deals with the im- provement of disruption management. Many commercial visibility systems now in- clude functionality to not only serve as a problem detector but also to provide reso- lution insights and support. If necessary, these features help decide what actions should be taken if the actual status deviates from the planned status. As a result, res- olution functionality can help enforce corporate policies for expediting, rerouting, reallocating inventory, etc.
52This has positive effects on customer service capabili- ties and delivery performance. Driving structural supply chain improvement, how- ever, requires analytical discipline, as described in step five. Using visibility data to measure actual lead times across the supply chain network is one quick opportunity to update the inventory and customer service system with these times. Identifying bottlenecks and recurring points of variability, analyzing their underlying causes, and taking corrective actions, on the other hand, helps companies achieve the high- est value from visibility technology.
The conceptual background of the model describes the maturity of supply chain transparency with a special focus on the flow of goods
53. It therefore addresses the topics relevant for the practical example: first, the goal of this approach is to create transparency throughout the entire supply chain to increase customer satisfaction and improve the supply chain performance sustainably. Second, on-time delivery performance and lead time represent two very important parameters for measuring and improving supply chain performance. Third, the Roadmap to Supply Chain Vis- ibility provides an appropriate project approach for the practical example, although it describes the necessary steps to successfully implement a visibility technology.
Steps one and three especially serve as valuable templates.
2.2.2.2 Applicability of Specific Maturity Models to the Case Study
The eight specific maturity models—identified by Jording and Sucky (2016)—focus on a specific content, similar to the general maturity models. According to the SCM focus, two of the models focus on process maturity. Since process maturity seems to be the appropriate SCM focus in this case study, the following two models are worth considering: “Supply Chain Management (SCM) Process Maturity Model” and
“Supply Chain Capability Maturity Model”, named S(CM)2. These specific maturity
51
Enslow (2006), p. 18.
52
Cf. Enslow (2006), pp. 20-21.
53
Cf. Jording/Sucky (2016), p. 107.
models focus on more-collaborative aspects at higher stages as well.
54For the “SCM Process Maturity Model”, the SCOR Model serves as the basis for conceptualizing.
However, the S(CM)2 also divides its processes into several supply chain competen- cy areas. In both models, the assessment of maturity takes place via self-assessment by answering a questionnaire. Moreover, the “SCM Process Maturity Model” and the S(CM)2 also have the capability to identify gaps and provide a roadmap to over- come those gaps. After the examination of the specific maturity models, it turned out that the “SCM Process Maturity Model” and the S(CM)2 provide especially relevant frameworks for this case study. For this reason, the two models are presented in the following.
SCM Process Maturity Model
The SCM Process Maturity Model shows the progression of activities toward effec- tive SCM and process maturity based on five stages.
55Each of the stages contains characteristics associated with process maturity. These characteristics include pre- dictability, capability, control, effectiveness, and efficiency. Due to its process orien- tation and wide adoption by the supply chain academic and practitioner communi- ties, the SCOR model serves as the basis to conceptualize the SCM Process Maturity Model. The five stages describe the process maturity of four areas: plan, source, make and deliver. In Stage 1 (Ad hoc), the supply chain and its processes are un- structured without any process measures in place. Functional cooperation is low, and the process performance is unpredictable. As a result, customer satisfaction is low.
In Stage 2 (Defined), basic SCM processes are defined and documented, and process performance is more predictable.
56The improvement of functional cooperation re- quires considerable effort. Targets are defined but still missed most of the time. Cus- tomer satisfaction has therefore improved but remains low. Stage 3 (Linked) repre- sents the breakthrough, as broad SCM jobs and structures are put in place, and intra- company functions, vendors and customers are cooperating. Process performance is more predictable, and defined targets are often achieved. Increased customer satis- faction begins to show market improvement. In Stage 4 (Integrated), organizational structures and jobs are based on SCM procedures, and traditional functions begin to disappear. Cooperation between the company, its vendors, and suppliers takes place on a process level. Advanced collaboration with customers and suppliers helps pro- cess performance become highly predictable. Targets are reliably achieved, SCM costs are dramatically reduced, and customer satisfaction becomes a competitive advantage. In the fifth stage (Extended), individual companies are no longer just competing against each other but against entire supply chains. These supply chains represent a horizontal, customer-focused, collaborative culture that shares common
54
Cf. Jording/Sucky (2016), p. 109.
55
Cf. Lockamy III/McCormack (2004), p. 275.
56
Cf. Lockamy III/McCormack (2004), pp. 276-278.
processes and goals, as well as joint investments in improving the system. In order to investigate the relationship between SCM process maturity and overall SCM per- formance, the authors created a survey instrument.
57Their investigation revealed significant relationships. Performance measured by each area of the SCOR Model is the measurement of performance most related to SCM process maturity. An expla- nation for this result is that the four areas of the SCOR Model provide a clear pro- cess context. Delivery performance and order lead times are also significantly corre- lated with SCM process maturity. Both describe process measures that clearly reflect process performance.
Even though the authors conclude that their measures of business process maturity might be too high-level to reveal correlations with business performance, their re- search illustrates an important aspect relevant for the practical example:
58Direct process performance measures such as lead times are related to SCM maturity.
S(CM)2
The S(CM)2 consists of three dimensions: supply chain views, lifecycle maturity levels, and abstraction levels.
59To achieve the defined enterprise goals, a company needs to successfully manage the following seven supply chain views:
Supply chain management and logistics: functions, processes, activities, and tasks related to the integration, collaboration and development of the suppliers
Production systems: functions, processes, activities, and tasks regarding the transformation of the product or service
Inventory management: actions related to inventory management and control
Customer relationship management: actions regarding meeting the customer’s needs
Human resource management: actions related to the enterprise’s employees, their integration into the company, and the work environment
Information systems and technology management: actions linked to the devel- opment and implementation of information systems and the technology man- agement process
Performance measurement systems to measure the enterprise’s performance re- garding processes, functions, and employees
57
Cf. Lockamy III/McCormack (2004), pp. 276–278.
58
Cf. Reyes/Giachetti (2010), p. 416; Lockamy III/McCormack (2004), p. 278.
59
Cf. Reyes/Giachetti (2010), p. 418-419.
Table 1: Maturity Levels of the Supply Chain Maturity Model.
60For detailed information regarding the supply chain views, see Reyes and Giachetti (2010). Each of the seven competency areas develops through five supply chain ma- turity levels, illustrated in Table 1. All enterprises are assumed to begin for each view at the first level and develop from there.
61Based on the current maturity levels for each view, the model provides actions that need to be addressed to reach the pro- ceeding levels.
The S(CM)2 is designed to evaluate the maturity level of a company’s supply chain practices for different views. Theses seven supply chain views address topics rele- vant for the practical example. Furthermore, the model helps identify possible ac- tions to improve the processes and define an appropriate roadmap. This model pro- vides a beneficial framework, since it indicates, similar to the SCM Process Maturity Model, which process maturity refers to several different viewpoints. Furthermore, it is the first model that considers a performance measurement system, which is a cen- tral aspect in this case study.
2.3 Performance Measurement and Metrics in SCM
In practice, maturity models are not primarily used as absolute measures of perfor- mance but rather as part of an improvement process.
62Furthermore, the maturity levels of an enterprise can differ depending on the different model views or process areas.
63Consequently, there are two ways of measuring SCM performance based on a company’s maturity level: on the one hand, by assessing a company’s overall ma- turity level based on a framework that describes an anticipated development path; on the other hand, by assessing the company’s maturity levels for different supply chain views or process areas.
The goal of the practical example is to enhance supply chain processes and expand knowledge concerning customer expectations and market trends. This includes the
60
Source: Reyes/Giachetti (2010), p. 419.
61
Cf. Reyes/Giachetti (2010), p. 418.
62
Cf. Fraser et al. (2002), p. 248.
63
Cf. Reyes/Giachetti (2010), p. 418.
creation of transparency from both an internal and external point of view. The crea- tion of transparency from an internal point of view requires performance metrics that describe the current SCM performance of these processes appropriately. The crea- tion of transparency from an external point of view requires the feedback of the cus- tomer to understand their expectations and how they perceive the company’s SCM performance.
The considered maturity models contain valuable concepts and solutions to structure and address those topics. The Supply Chain Visibility Roadmap provides an appro- priate project approach, especially by describing the necessary steps of defining a visibility strategy and creating the rollout plan. According to the Visibility Roadmap, the following elements are important when defining a strategy that aims to create transparency:
64 Focusing on the main problem areas first and then expanding from there
Creating “as is” assessment of key metrics, targeted for improvement
Including both cross-functional and department-based metrics
Establishing a cross-functional team with an executive sponsor When creating the rollout-plan, the Visibility Roadmap recommends:
65 Determining which areas of the supply chain to concentrate on first
Identifying small, simple projects
Assessing the availability of quality status data
Starting with the smallest data set possible that still drives value
The specific maturity models use different supply chain views to analyze the process performance of each viewpoint. This is especially important, since the practical ex- ample considers processes that are cross-functional. The SCM Process Maturity Model uses the SCOR Model as a conceptual basis to describe the process maturity of the supply chain activities plan, source, make, and deliver. Since the regarded company’s definition of SCM is based on the SCOR processes, the SCOR Model hereinafter also represents the conceptual framework for measuring the SCM per- formance. However, this mainly represents the internal perspective on SCM perfor- mance. It is also important to consider other viewpoints, such as those presented in the S(CM)2: customer relationship management, for instance, assesses performance in terms of meeting the customers’ expectations. According to the SCM definition, all SCM activities focus on the needs and expectations of customers.
66Therefore, the customer’s viewpoint is indispensable to finding out about how SCM performance is perceived and how they measure their supplier’s SCM performance.
Performance measurement systems represent an important viewpoint, since they de- termine the performance metrics to measure the enterprise’s performance regarding processes, functions, and employees. Some of the maturity models considered al-
64
Cf. Enslow (2006), pp. 12-13.
65
Cf. Enslow (2006), pp. 17–20.
66
Cf. Staberhofer/Rohrhofer (2007), p. 39.
ready emphasize the importance of direct process performance measures, such as delivery performance and lead times.
67This chapter aims to analyze the importance of performance measures and metrics in each of the four basic supply chain process- es (plan, source, make, and deliver).
The following four aspects are crucial for effective performance measurement and improvement. First, measurement goals must represent organizational goals. This allows measuring the achievement of those targets and evaluating the effectiveness of the strategy employed. Second, selected metrics should reflect a balance between financial and non-financial measures. Financial performance measurements are im- portant for strategic decisions and external reporting, whereas non-financial measures support the day-to-day control of manufacturing and distribution opera- tions. Third, metrics should be related to strategic, tactical, and operational levels of decision making and control. The decisions of top-level management are based on the strategic level and, thus, mainly on financial measures. The tactical-level measures deal with the allocation of resources and the achievement of the results specified at the strategic level. Operational-level measurements and metrics assess the results of the decisions of low-level managers in order to achieve the tactical ob- jectives. Finally, performance assessment can be better addressed by using a few performance measures that are critical to success and truly capture the essence of organizational performance.
Gunasekaran et al. (2004) reviewed the literature on SCM performance measure- ments and metrics in the context of the following activities/processes: (1) plan, (2) source, (3) make/assemble, and (4) delivery/customer.
68Furthermore, the authors developed a survey to study SCM performance measures and metrics that are used in the environment of those four activities/processes. The purpose of the literature re- view was to identify metrics for the individual activity/process, whereas the purpose of the study was to weight these metrics according to their importance. The perfor- mance metrics identified in the literature review serve as the basis for the importance rating survey. The authors used three categories to prioritize the metrics (highly im- portant, moderately important, and less important). The following subchapters espe- cially focus on the highly and, to a certain extent, moderately important metrics of each activity area. For more-detailed information about all metrics, see Gunasekaran et al. (2004).
Planning Performance Evaluation Metrics
The survey distinguishes between strategic planning and order planning. According to the survey, the level of customer-perceived value of the product is highly im- portant.
69This clearly indicates that customer satisfaction is of the utmost im-
67
Cf. Lockamy III/McCormack (2004), p. 278.
68
Cf. Gunasekaran et al. (2004), pp. 335–340.
69
Cf. Gunasekaran et al. (2004), pp. 340-341.
portance in increasing competiveness. The measures considered within the moder- ately important category include three financial and three non-financial measures, which reflect the importance of a balance between financial and non-financial measures in strategic planning. Variances against budget represent the highest-rated financial metric, whereas order lead time represents the highest-rated non-financial metric. At the order planning level, the customer query time is highly important, whereas the product development cycle time is moderately important. Both metrics are related to meeting customer needs by performing in a timely fashion, which again emphasizes the importance of customer service. At the bottom line, customer satisfaction and service is most important at the planning level.
Sourcing Performance Evaluation Metrics
The sourcing process includes purchasing and supplier management activities.
70In their literature review, the authors identified six metrics related to the sourcing pro- cess. The participants of the survey clearly rated supplier delivery performance as highly important. Supplier lead time against industry norm and supplier pricing against market are two of the moderately important metrics. Most notable is that firms regard delivery performance as more important than price.
Production Performance Evaluation Metrics
The importance rating survey identified three metrics as highly important for the production performance evaluation:
71percentage of defects, cost per operation hour, and capacity utilization. The first metric measures product quality, whereas the latter two are fundamentally measures of efficiency regarding the utilization of resources.
Efficiency of operations translates into lower costs per unit to manufactured prod- ucts/provided services. The range of products and services is the only moderately important measure. In short, product quality and manufacturing efficiency seem to be more important when evaluating production performance.
Delivery Performance Evaluation Metrics
Similarly to the production performance metrics, there are three delivery perfor- mance metrics that are highly important.
72The first two measures, quality of deliv- ered goods and on-time delivery of goods, have nearly the same rating. Flexibility of service systems to meet customer needs represents the third highly important metric.
The authors assume that these three metrics influence the perceived customer value of the product. The following sentence describes the overall goal of the delivery ac- tivities, basically summarizing the highly important delivery performance evaluation metrics. “Providing the customer with a quality product in a timely fashion, and
70
Cf. Gunasekaran et al. (2004), p. 342.
71
Cf. Gunasekaran et al. (2004), pp. 342-344.
72
Cf. Gunasekaran et al. (2004), pp. 343-345.
maintaining customer satisfaction with a service system designed to flexibly respond to customer needs are key in producing value for the customer”.
73Gunasekaran et al. (2004) aimed to create a framework to promote a better under- standing of the importance of SCM performance measures and metrics that helps organizations in developing a performance measurement program for SCM.
74The framework, presented in Table 2, considers the four major supply chain activities (plan, source, make/assemble, and deliver), as well as the three management levels (strategic, tactical, and operational). The measures are therefore grouped in cells at the intersection of these two axes, listed in order of importance. Since some measures are appropriate at more than one management level, they appear in more than one cell. It seems that customer satisfaction is paramount in importance in in- creasing competitiveness, especially for the planning and delivery activities: each first-mentioned metric, at least on the tactical or strategic level, in some way deals with meeting the customers’ needs. Companies can use this framework to identify the supply chain activity to be measured, the appropriate metric, and the level of management to which the measure should be applied. However, not all supply chains are identical, and the company will certainly have individual performance measurement needs that reflect the unique operations of their business. In terms of the practical example, it is necessary to first devise a strategy and create a rollout plan to determine which areas of the supply chain to focus on. This allows for the selection of performance measures reflecting the operations of the respective supply chain areas.
73
Gunasekaran et al. (2004), p. 343.
74
Cf. Gunasekaran et al. (2004), pp. 344-345.
Table 2: Supply Chain Performance Metrics Framework.
753 Supply Chain Performance within an Electrical Industry Enterprise
The company in this case-study offers a wide spectrum of products, systems, solu- tions, software and services. The current situation and challenges result in the need for action: first, improvement of transparency regarding logistics and SCM perfor- mance is paramount. Furthermore, the company needs to be aware of the latest ex- pectations and trends from the market it is operating in with regards to logistics and SCM performance. Finally, in order to identify best practices and gaps, a compari- son of the current performance, customer expectations, and market trends is re- quired. The performance component represents the internal point of view and aims to create transparency by analyzing the logistics and SCM performance using appro- priate performance metrics.
According to the Visibility Roadmap, it is crucial to establish a cross-functional team with defined responsibilities.
76For this reason, in the practical example, the study used a cross-functional approach. For the visibility strategy, as well as for the rollout plan, it is important to focus on the main problem areas first and then expand from there.
77Consequently, the project team, which was driving the study, had to determine which areas of the supply chain to concentrate on first. The objectives
75
Source: Gunasekaran et al. (2004), p. 345.
76
Cf. Enslow (2006), pp. 12-13.
77
Cf. Enslow (2006), pp. 12 and 17.
include the enhancement of supply chain processes by improving lead times and be- ing a more reliable supplier. This clearly emphasizes the delivery perspective of SCM and thus determines the supply chain focus area. Delivery performance direct- ly impacts customer satisfaction.
78As a result, it is the key to supply chain excel- lence. Customer satisfaction is one of the main goals of SCM, which is why measur- ing and improving delivery performance is always desirable in order to increase competitiveness.
According to the Visibility Roadmap, it is important to create an “as is” assessment of key metrics targeted for improvement.
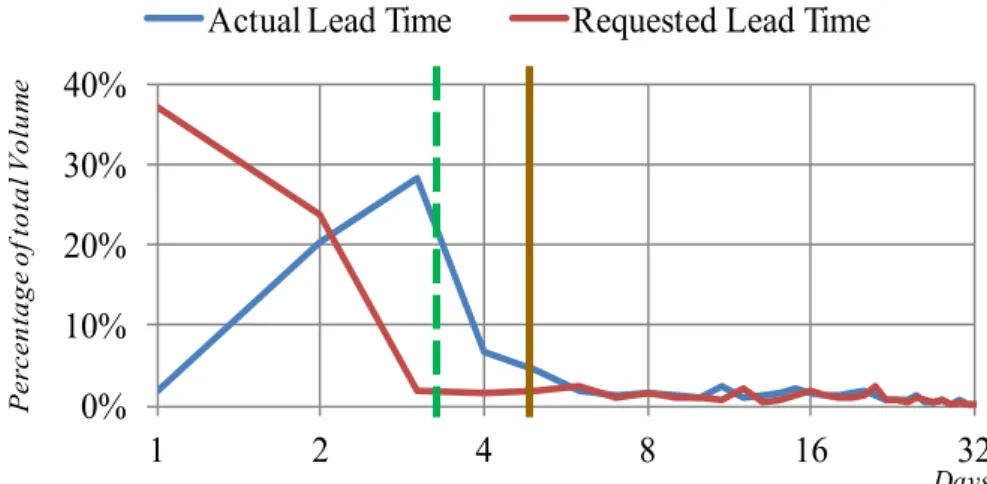
79The objectives of the company already determine one cross-functional metric, lead time, to increase transparency along the supply chain processes. Reducing lead times is one way of improving delivery per- formance and customer satisfaction, especially because there is continuing pressure from the marketplace to shorten lead times.
80For this reason, the objective of this study was to measure the SCM performance by analyzing the lead times: on the one hand, to identify average lead times and deviations from this lead time; on the other hand, to compare the actual lead times with those requested by the customer. The Visibility Roadmap suggests starting with the smallest data set possible that still drives value.
81In this case, the timeframe from order entry to delivery at the custom- er site represented the smallest data set possible that still drives value. Deviations from the overall average and requested lead time then required a detailed investiga- tion to find possible bottlenecks.
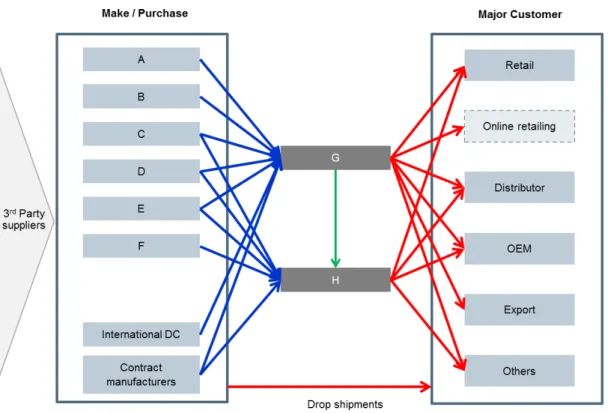
3.1 The Company’s Supply Network
The supply chain depicted in Figure 2 describes the simplified processes up through delivery to customer via various sales channels, either of raw materials being trans- formed into final products or of final products being purchased directly from con- tract manufacturers. The supply chain contains four levels: supply, manufacturing or purchasing, distribution, and customers. Each level of the supply chain comprises numerous facilities. There are a variety of external suppliers that are not part of this analysis and are therefore illustrated in a simplified manner. The manufacturing or purchasing level in Figure 2, described as make or purchase, comprises basically seven facilities: A, B, C, and D represent national plants, while E and F represent international plants. Furthermore, the company has a large international DC and some contract manufacturers. The third level contains the national DCs, in this case, G and H. Finally, there are customers who obtain their products through different sales channels. In this case, the study focuses on five sales channels.
78
Cf. Stewart (1995), p. 41; Gunasekaran et al. (2004), p. 337.
79
Cf. Enslow (2006), p. 12.
80
Cf. Stewart (1995), p. 41.
81