doi: 10.3389/fphar.2018.01258
Edited by:
Lina Ghibelli, Università degli Studi di Roma Tor Vergata, Italy
Reviewed by:
Claudio Sorio, Università degli Studi di Verona, Italy Federica Barbieri, Università di Genova, Italy
*Correspondence:
Kathrin Renner Kathrin.Renner-Sattler@ukr.de Marina Kreutz Marina.Kreutz@ukr.de
Specialty section:
This article was submitted to Experimental Pharmacology and Drug Discovery, a section of the journal Frontiers in Pharmacology
Received: 13 August 2018 Accepted: 15 October 2018 Published: 02 November 2018
Citation:
Renner K, Seilbeck A, Kauer N, Ugele I, Siska PJ, Brummer C, Bruss C, Decking S-M, Fante M, Schmidt A, Hammon K, Singer K, Klobuch S, Thomas S, Gottfried E, Peter K and Kreutz M (2018) Combined Metabolic Targeting With Metformin and the NSAIDs Diflunisal and Diclofenac Induces Apoptosis in Acute Myeloid Leukemia Cells.
Front. Pharmacol. 9:1258.
doi: 10.3389/fphar.2018.01258
Combined Metabolic Targeting With Metformin and the NSAIDs Diflunisal and Diclofenac Induces Apoptosis in Acute Myeloid Leukemia Cells
Kathrin Renner
1,2* , Anton Seilbeck
1, Nathalie Kauer
1, Ines Ugele
1, Peter J. Siska
1, Christina Brummer
1, Christina Bruss
1, Sonja-Maria Decking
1, Matthias Fante
1, Astrid Schmidt
1, Kathrin Hammon
1, Katrin Singer
1, Sebastian Klobuch
1, Simone Thomas
1,2, Eva Gottfried
1, Katrin Peter
1and Marina Kreutz
1,2*
1
Department of Internal Medicine III, University Hospital Regensburg, Regensburg, Germany,
2Regensburg Center for Interventional Immunology (RCI), Regensburg, Germany
The accelerated metabolism of tumor cells, inevitable for maintaining high proliferation rates, is an emerging target for tumor therapy. Increased glucose and lipid metabolism as well as mitochondrial activity have been shown in solid tumors but also in leukemic cells. As tumor cells are able to escape the blockade of one metabolic pathway by a compensatory increase in other pathways, treatment strategies simultaneously targeting metabolism at different sites are currently developed. However, the number of clinically applicable anti-metabolic drugs is still limited. Here, we analyzed the impact of the anti-diabetic drug metformin alone or in combination with two non-steroidal anti-inflammatory drugs (NSAIDs) diclofenac and diflunisal on acute myeloid leukemia (AML) cell lines and primary patient blasts. Diclofenac but not diflunisal reduced lactate secretion in different AML cell lines (THP-1, U937, and KG-1) and both drugs increased respiration at low concentrations. Despite these metabolic effects, both NSAIDs showed a limited effect on tumor cell proliferation and viability up to a concentration of 0.2 mM. In higher concentrations of 0.4–0.8 mM diflunisal alone exerted a clear effect on proliferation of AML cell lines and blocked respiration. Single treatment with the anti-diabetic drug metformin blocked mitochondrial respiration, but proliferation and viability were not affected. However, combining all three drugs exerted a strong cytostatic and cytotoxic effect on THP-1 cells. Comparable to the results obtained with THP-1 cells, the combination of all three drugs significantly reduced proliferation of primary leukemic blasts and induced apoptosis. Furthermore, NSAIDs supported the effect of low dose chemotherapy with cytarabine and reduced proliferation of primary AML blasts. Taken together we show that low concentrations of metformin and the two NSAIDs diclofenac and diflunisal exert a synergistic inhibitory effect on AML proliferation and induce apoptosis most likely by blocking tumor cell metabolism. Our results underline the feasibility of applying anti-metabolic drugs for AML therapy.
Keywords: metabolism, acute myeloid leukemia, AML, diclofenac, diflunisal, metformin, apoptosis
INTRODUCTION
Acute myeloid leukemia (AML) is a heterogeneous group of neoplastic disorders characterized by the accumulation of myeloid blasts in the bone marrow and blood as well as an arrest in differentiation. AML represents the most common acute leukemia in adults and is still a mostly incurable and lethal disease in the majority of patients. Induction therapy with cytarabine and anthracyclines is highly effective in killing leukemic cells and has largely remained unchanged since the 1970s (Perl, 2018). Despite a high rate of complete remissions, the overall survival is very poor as many patients relapse. Relapses are caused by regrowth of chemotherapy-resistant leukemic cells.
New studies expanded the knowledge on AML heterogeneity and identified new molecular groups. These advances are now translated into several new targeted therapies (Perl, 2017). Mutations in isocitrate dehydrogenase (IDH)1 or IDH2 are detected in approximately 15% of AML patients.
Both enzymes are important for cell energy metabolism and catalyze the interconversion of isocitrate into α -ketoglutarate.
AML therapy with oral, small-molecule inhibitors of mutant IDH1 and mutant IDH2, respectively, has shown promising results (Stein et al., 2017; DiNardo et al., 2018) indicating that metabolic targeting is an effective approach for AML therapy.
In solid tumors it is well-established that oncogenes reprogram tumor metabolism and accelerate glucose metabolism.
This phenomenon, known as the “Warburg effect,” is associated with an aggressive phenotype and poor prognosis in many tumor entities (Renner et al., 2017). Ju et al. (2017) described that internal tandem duplication (ITD) mutation in fms like tyrosine kinase (FLT) 3 (FLT3/ITD), which is detected in about 30% of AML patients, promotes the Warburg effect. Leukemia cell lines overexpressing FLT3/ITD exhibited increased glucose uptake and lactate secretion. In line, the commonly used glycolytic inhibitor 2-deoxyglucose (2-DG) potentiated the anti-leukemia effect of sorafenib. These data suggest that combination of metabolic intervention and conventional chemotherapy could be exploited as therapeutic strategy in patients with FLT3/ITD mutation (Ju et al., 2017).
In line, inhibition of glycolytic metabolism by 2-DG increased the efficacy of Aurora kinase inhibitors in AML cell lines (Liu et al., 2013) and potentiated the cytotoxicity of arabinofuranosyl cytidine (Chen et al., 2014).
Many hypotheses tried to explain the therapeutic resistance in AML patients. A linkage between reduced sensitivity to chemotherapy and accelerated glycolysis has been described in a murine AML model. Here, chemotherapy-resistant AML exhibited increased lactate production and fewer mitochondria (Nobrega-Pereira et al., 2018). In contrast, another study demonstrated that cytarabine-resistant cells displayed a shift to fatty acid oxidation and increased oxidative phosphorylation (OXPHOS) (Farge et al., 2017). Similar results were obtained by Qian et al. (2016) showing that high expression of TP53-induced glycolysis and apoptosis regulator (TIGAR), which inhibits glycolysis, was associated with poor survival and high incidence of relapse. Furthermore, Gallipoli et al. (2018) showed that
FLT3/ITD AML depends on glutaminolysis which supports mitochondrial activity.
Vascular endothelial growth factor (VEGF)-signaling seems to be associated with changes in metabolism and chemoresistance.
Blocking VEGF receptor 2 (VEGFR2) induced mitochondrial biogenesis and increased the vulnerability of leukemic cells (Nobrega-Pereira et al., 2018). VEGF-C induces cyclooxygenase (COX)-2 expression in AML cell lines and COX-2 inhibition limits tumor cell proliferation in vitro and suppresses xenograft tumor formation (Zhang et al., 2013; Hua et al., 2014). Moreover, combination of celecoxib, a COX-2 inhibitor, with doxorubicin revealed a synergistic effect on growth inhibition and apoptosis induction in the AML cell line HL-60 and primary AML cells (Chen et al., 2013).
These results suggest that AML cells are heterogeneous in their metabolic profile and use different metabolic pathways to fuel proliferation and acquire resistance to chemotherapy.
Here we investigated the impact of three inhibitors which target glycolysis, COX, and OXPHOS alone and in combination on AML cell lines and primary human AML blasts. Our study illustrates that simultaneous targeting of different metabolic pathways may represents a powerful therapeutic strategy for AML patients.
MATERIALS AND METHODS Chemicals and Drugs
All drugs were purchased from Sigma-Aldrich (St Louis, MO, United States) and dissolved in water, unless otherwise indicated.
The sodium salt of diclofenac (Fagron, Barsbüttel, Germany) and metformin hydrochloride (Sigma-Aldrich) were dissolved in culture medium. Diflunisal (Fluka, Munich, Germany) was dissolved in 20 mM arginine containing water and cytarabine (Stada, Bad Vilbel, Germany) in 0.11 mM sodium lactate solution.
Cells and Cell Culture
The cell lines U937 (human histiocytic leukemia, DSMZ) and THP-1 (monocytic leukemia cell line, DSMZ) were cultured in RPMI 1640, 10% fetal calf serum (both from PAN Biotech, Aidenbach, Germany), 2 mM glutamine, 50 U/mL penicillin/50 µ g/mL streptomycin (all from Gibco/Life Technologies, Carlsbad, CA, United States) at 5% CO2 and 37 ◦ C.
Primary AML blasts were obtained from patients after
written informed consent. The study was approved by the
Institutional Ethics Committee of the University Hospital of
Regensburg and designed and conducted in accordance with
the Declaration of Helsinki (ethic vote 05-097). AML blasts
were cultured in RPMI 1640, 10% fetal calf serum (both from
PAN), 10% human AB serum, 2 mM glutamine, 50 U/mL
penicillin/50 µ g/mL streptomycin (all from Gibco), 20 ng/mL
IL-3, G-CSF as well as TPO (all from Peprotech, Hamburg,
Germany). 5 × 10 5 cells/mL medium were seeded in 24-well
plates at 5% CO2 and 37 ◦ C. Every 3–4 days, medium was
changed.
Determination of Cell Proliferation
To measure proliferation of cell lines, 3 × 10 4 cells/0.2 mL medium were seeded into flat-bottom 96-well plates with indicated concentrations of diclofenac, diflunisal, metformin and cytarabine. To analyze immediate anti-proliferative effects, 0.5 µCi/0.2 mL 3 H-thymidine (Amersham Pharmacia, Piscataway, NJ, United States) was added after 2 h and
3 H-thymidine incorporation was determined after 24 h. In a second set of experiments, cells were labeled after 24 h and cultured for another after 24 h (48 h total).
Determination of Apoptosis
For analysis of apoptosis, 3–5 × 10 5 cells/mL medium were treated with diclofenac, diflunisal, metformin and cytarabine for 24 h or 48 h. After treatment, cells were stained with Annexin-V-FITC and 7-aminoactinomycin D (7-AAD) (both from BD Biosciences, Franklin Lakes, NJ, United States) according to the manufacturer’s instructions.
Flow cytometric analyses were performed on a FACSCalibur (BD Biosciences) using BD CellQuestPro for data acquisition and analysis. Final processing and analysis was performed with FlowJo v9.5.3 software (FlowJo,LLC, Ashland, OR, United States).
Determination of Lactate in Tumor Cell Supernatants
Cells were seeded into 24-well plates at a concentration of 5 × 10 5 cells/ mL medium with or without diclofenac, diflunisal, metformin and cytarabine. After 24 or 48 h, lactate levels in cell culture supernatants were determined with a Dimension Vista (Siemens, Munich, Germany) using reagents from Roche (Mannheim, Germany) at the Department of Clinical Chemistry, University Clinic, Regensburg, Germany.
Online-Measurement of Oxygen Concentration in Cell Culture
The SDR SensorDish
RReader (PreSens Precision Sensing GmbH, Regensburg, Germany) is a 24-channel oxygen and pH meter. The optical oxygen (OxoDish
R) sensor is integrated at the bottom of each well of a 24-well multidish.
The sensors are luminescent dyes embedded in an analyte- sensitive polymer. The luminescence lifetime of these dyes depends on the amount of analyte. The sensors are read out non-invasively through the bottom of the multidish by the SensorDish
RReader. The resulting signal is converted automatically to the respective parameter (dissolved oxygen) using calibration parameters stored in the software. 5 × 10 5 cells/mL medium were incubated with or without diclofenac, diflunisal, metformin and cytarabine. The SensorDish
RReader was used in the incubator for the whole duration of the 16-h cultivation period and measurements were performed in 30–60 s intervals.
Statistical Analysis
All results represent mean ± standard error (SEM) of at least three independent experiments. Significance was
determined by ANOVA and post hoc by Holm-Sidak’s multiple comparisons test, ∗∗∗ p < 0.001; ∗∗ p < 0.01; and
∗ p < 0.05.
RESULTS
Tumor metabolism supports tumor growth and is associated with chemotherapy resistance. Targeting tumor metabolism is an attractive option to support conventional tumor therapy. Here we investigated the impact of anti-metabolic drugs alone or in combination on human AML cell lines and primary AML blasts.
Impact of Metformin, NSAIDs and 2-DG on Metabolism and Proliferation of AML Cell Lines
The anti-diabetic drug metformin lowers OXPHOS via inhibiting complex I of the electron transport chain in the mitochondria.
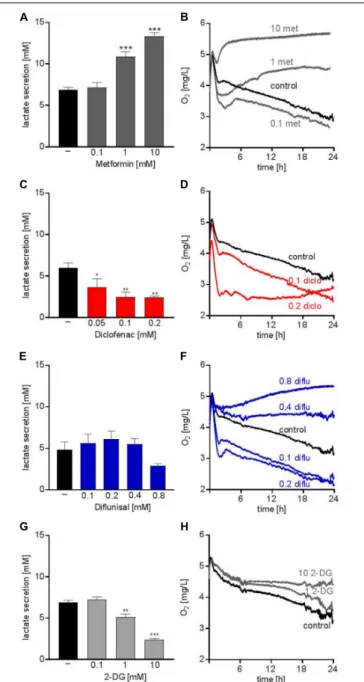
Several studies addressed the anti-cancer potential of metformin in vitro and in clinical trials, however, mainly in solid tumors (Pollak, 2014). Metformin accelerated glucose metabolism and increased lactate secretion in the human AML cell line THP-1 starting from concentrations of 1 mM (Figure 1A). In parallel, oxygen consumption was blocked (Figure 1B). Diclofenac, a non-steroidal anti-inflammatory drug (NSAID) which has been shown to inhibit glucose metabolism (Gottfried et al., 2013) significantly decreased lactate secretion starting from 0.05 mM and increased oxygen consumption (Figures 1C,D).
Another NSAID, diflunisal, exhibited no effect on lactate secretion but increased oxygen consumption in concentrations of 0.1–0.2 mM (Figures 1E,F). However, at higher diflunisal concentrations of 0.4–0.8 mM, OXPHOS was inhibited (Figure 1F). In comparison, we tested a classical glycolytic inhibitor, 2-deoxyglucose (2-DG). A decrease in lactate secretion was obtained with high 2-DG concentrations of 1–10 mM (Figure 1G); OXPHOS inhibition occurred at 10 mM 2-DG (Figure 1H).
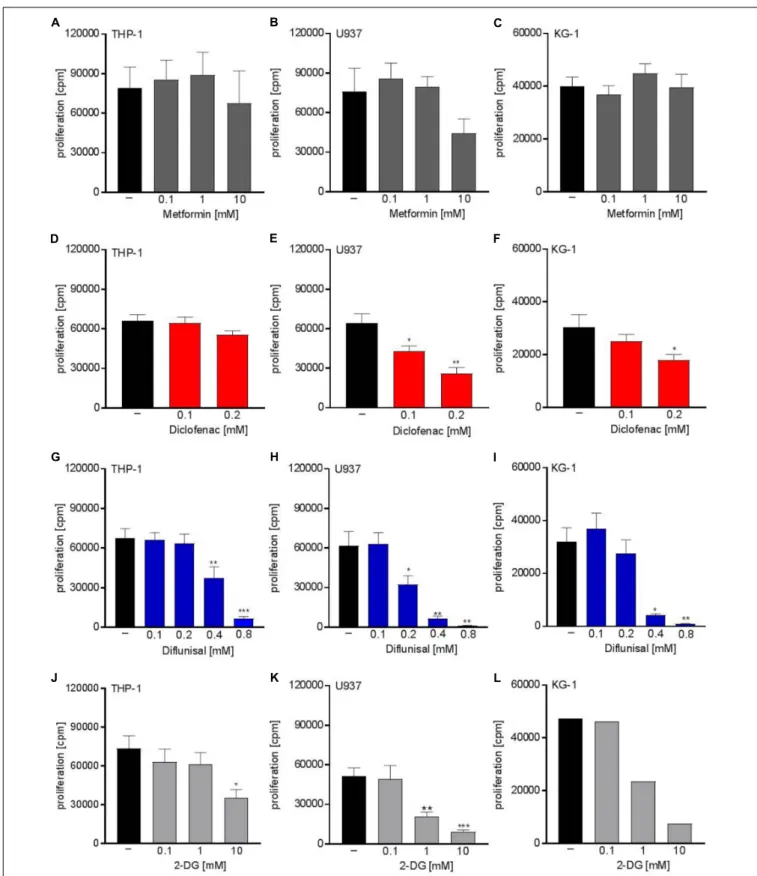
Next we analyzed whether metabolic targeting modulates cell growth of different AML cell lines. Even though metformin significantly blocked respiration at doses of 1-10 mM, no significant effect on proliferation was detected for THP-1, U937, and KG-1 AML cell lines (Figures 2A–C). This could in part be because decreased OXPHOS was compensated by increased glycolytic activity as shown by increased lactate secretion after metformin treatment (Figure 1A). Proliferation was not significantly lowered by diclofenac in THP-1 cells (Figure 2D) whereas U937 and KG-1 were more susceptible to diclofenac treatment resulting in decreased proliferation (Figures 2E,F).
Diflunisal significantly inhibited proliferation in all three AML
cell lines (Figures 2G–I) starting from a concentration of
0.4 mM where OXPHOS was clearly blocked. In contrast
to metformin, AML cells treated with diflunisal showed no
compensation regarding glycolytic activity as lactate production
was not altered after diflunisal treatment. (Figure 1E). 2-DG
also inhibited proliferation at concentrations of 10 mM where
both OXPHOS and glycolysis was blocked (Figures 2J–L). These
FIGURE 1 | Metabolic effects of single treatment with metformin, diclofenac, diflunisal and 2-DG on THP-1 cells. (A,C,E,G) Cells were seeded in 24-well plates at a concentration of 5 × 10
5cells/ mL medium with or without metformin, diclofenac, diflunisal and 2-DG in the indicated concentrations.
After 24 h, cumulative lactate levels in cell culture supernatants were determined. (B,D,F,H) Cells were seeded in the same density in 24-well dishes with integrated optical oxygen (OxoDish
R) sensors in the bottom of each well. The SensorDish
RReader was placed in the incubator for 24 h and measurements were performed in 30–60 s intervals. (A,C,E,G) data are shown as mean ± SEM (n ≥ 3),
∗P < 0.05,
∗ ∗P < 0.01, and
∗ ∗ ∗P < 0.001 significance was calculated by ANOVA and post hoc Holm-Sidak’s multiple comparisons test. (B,D,F,H) data are shown as mean (n ≥ 3 with the exception of (F) 0.4–0.8 mM diflunisal n = 2).
data indicate that metabolic targeting only results in robust proliferation arrest when glycolysis and OXPHOS are targeted simultaneously.
Combined Metabolic Targeting Limits Proliferation of Leukemia Cell Lines and Primary Blasts
Next we tried to combine low physiological doses of the drugs to augment the effect compared to the single treatment.
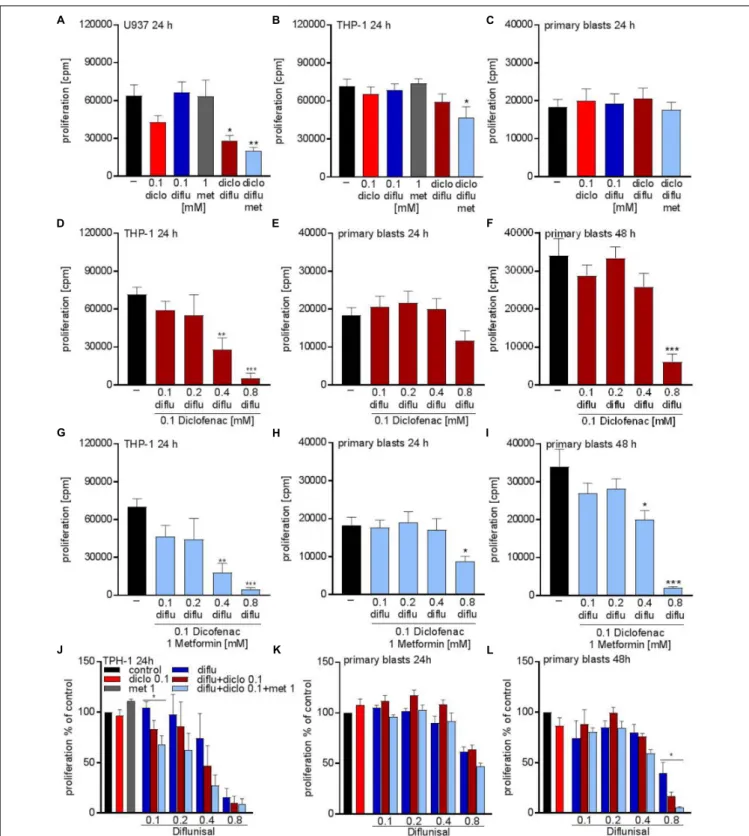
Combination of 0.1 mM of diclofenac and 0.1 mM diflunisal, clearly suppressed the proliferation of U937 but not in THP-1 and primary AML blasts (Figures 3A–C). Addition of 1 mM metformin, which as a single drug had no impact on proliferation, could overcome the resistance of THP-1 against NSAIDs and the combined treatment significantly lowered the proliferation rate of THP-1 cells but not primary AML blasts (Figures 3B,C).
As the salicylic acid derivative diflunisal can be administered to patients in 10-fold higher concentrations compared to diclofenac, we increased the diflunisal dose and combined it with low concentrations of diclofenac and metformin (Figures 3D–I).
As shown in Figure 2G, diflunisal alone inhibited THP-1 proliferation at a concentration of 0.4–0.8 mM. Combined treatment with diclofenac and metformin could not further decrease the proliferation rate of THP-1 cells (Figures 3D,G).
In primary AML blasts no significant effect was detected with diflunisal plus diclofenac (Figure 3E) after 24 h, but addition of metformin reduced proliferation (Figure 3H).
When we prolonged the treatment to 48 h, this effect was even more pronounced and also 0.4 mM diflunisal as triple combination therapy significantly reduced proliferation of primary blasts (Figure 3I). For direct comparison we normalized the proliferation under single drug treatment and the various combinations to untreated cells (Figures 3J–L). Taken together, these data prove that combination of two or three treatments which alone were not effective resulted in cytostatic effects not only in cell lines but also primary blasts.
Metabolic Effects of NSAIDs and Metformin on Primary AML Blasts
Analysis of the metabolic effects of the drugs on AML blasts revealed similar results compared to the leukemia cell lines. Metformin accelerated lactate secretion whereas diclofenac alone or in combination with diflunisal reduced lactate secretion (Figures 4A,B). Combination of all three drugs resulted in a slightly reduced lactate secretion even though metformin alone doubled the lactate secretion (Figures 4A,C).
Furthermore, oxygen consumption was determined with the Presens technology. In contrast to THP-1 cells (Figure 1F), diflunisal increased oxygen consumption in primary blasts even in high diflunisal concentrations of 0.8 mM (Figure 4D).
Diclofenac alone or in combination with 0.1 mM diflunisal had no effect on oxygen consumption (Figures 4D,E). Metformin again inhibited respiration alone and in combination with the NSAIDs (Figures 4D,F) thereby counteracting the effect of diflunisal on OXPHOS.
Apoptosis Induction by Combined Metabolic Targeting
To distinguish proliferation arrest from the induction of
cell death, we incubated THP-1 cells with the drugs alone
FIGURE 2 | Cytostatic effects of single treatment with metformin, diclofenac, diflunisal and 2-DG on the proliferation of myeloid leukemic cell lines. To analyze effects
on proliferation of (A,D,G,J) THP-1, (B,E,H,K) U937 and (C,F,I,L) KG-1, 3 × 10
4cells/0.2 mL medium were seeded in 96-well plates with indicated concentrations
of metformin, diclofenac, diflunisal and 2-DG.
3H-thymidine was added after 2 h and
3H-thymidine incorporation was determined after 20–22 h. (A–K) data are
shown as mean ± SEM (n ≥ 4),
∗P < 0.05,
∗ ∗P < 0.01, and
∗ ∗ ∗P < 0.001 significance was calculated by ANOVA and post hoc Holm-Sidak’s multiple comparisons
test. L data are shown as mean (n = 2).
FIGURE 3 | Cytostatic effects after combined treatment with metformin, diclofenac and diflunisal on AML cells. 3 × 10
4cells/0.2 mL medium (A) U937 cells or
(B) THP-1 cells or (C) primary blasts were seeded in 96-well plates with 1 mM metformin, 0.1 mM diclofenac and 0.1 mM diflunisal alone or in the indicated
combinations.
3H-thymidine incorporation was determined after 24 h. In a second set of experiments we increased the diflunisal concentration. (D) THP-1 cells or
(E) primary blasts were incubated with 0.1 mM up to 0.8 mM diflunisal plus low dose 0.1 mM diclofenac for 24 h. (F) alternatively, the incubation period of primary
blasts was prolonged to 48 h. (G–I) in another set of experiments the triple combination with diclofenac and 1 mM metformin was used. Proliferation under single
drug treatment or the various drug combinations was normalized to respective controls and is shown for (J) THP-1 cells and primary blasts treated for (K) 24 h or (L)
48 h. data are shown as mean ± SEM (n ≥ 3),
∗P < 0.05,
∗ ∗P < 0.01, and
∗ ∗ ∗P < 0.001 significance was calculated by ANOVA and post hoc Holm-Sidak’s multiple
comparisons test.
FIGURE 4 | Metabolic effects of treatment with metformin, diclofenac and diflunisal on primary blasts. AML blasts were seeded in 24-well plates at a concentration of 5 × 10
5cells/mL medium with or without metformin, diclofenac and diflunisal and 2-DG in the indicated concentrations. (A–C) After 24 h, cumulative lactate levels in cell culture supernatants were determined. (D–F) Cells were seeded in the same density in 24-well dishes with integrated optical oxygen (OxoDish
R) sensors in the bottom of each well. The SensorDish
RReader was placed in the incubator for 24 h and measurements were performed in 30–60 s intervals. A,D show single treatments; in B,E diflunisal was combined with 0.1 mM diclofenac and in C,F triple treatments of diflunisal, diclofenac and metformin are shown. (A–C) data are shown as mean ± SEM (n ≥ 3),
∗P < 0.05 and
∗∗P < 0.01; significance was calculated by ANOVA and post hoc Holm-Sidak’s multiple comparisons test. (D–F) data are shown as mean (n = 3).
and in combination and stained with annexin-V/7-AAD to determine apoptosis. Low concentrations of diclofenac but not diflunisal and metformin induced apoptosis, however, high diflunisal concentration of 0.8 mM had a strong effect on cell viability (Figure 5A). The combination of low concentrations of diclofenac and diflunisal induced apoptosis (Figure 5B).
Metformin had no effect and could not further support the effect of diclofenac and diflunisal (Figure 5C). Morphology and original flow cytometry data presented either as scatter blots or histograms of Annexin-V/7-AAD staining of THP-1 cells under treatment are shown in Figures 5D–F. Percentage of Annexin- V single positive cells (lower right quadrant), regarded as early apoptotic cells, 7-AAD single positive cells (upper left quadrant), regarded as necrotic cells or Annexin V/7-AAD double positive cells (upper right quadrant), representing late apoptotic cells, can be depicted either from scatter blots or histograms (Figures 5D–F).
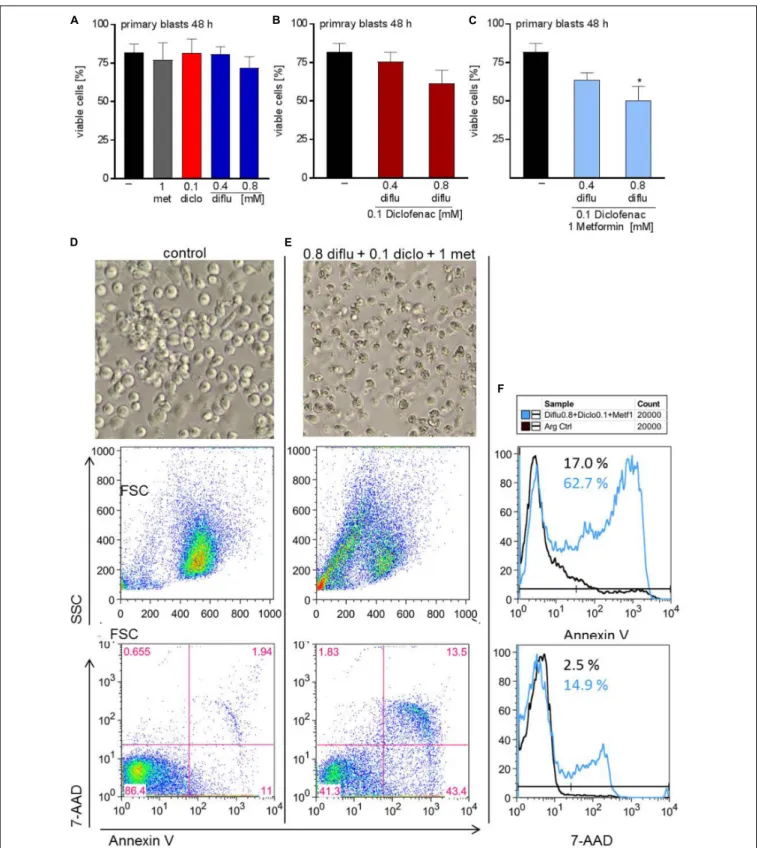
In contrast to THP-1 cells, AML blasts did not respond to single drug treatment (Figure 6A). Combination of low doses of diclofenac with high concentrations of 0.8 mM diflunisal
also had no effect (Figure 6B). Applying 0.8 mM diflunisal as triple therapy together with diclofenac and metformin resulted in apoptosis induction (Figures 6C–E). This effect is also clearly visible from the pictures, FCS/SSC characteristics and original data on Annexin-V/7-AAD staining, presented either as scatter blots or as histograms (Figures 6D–F).
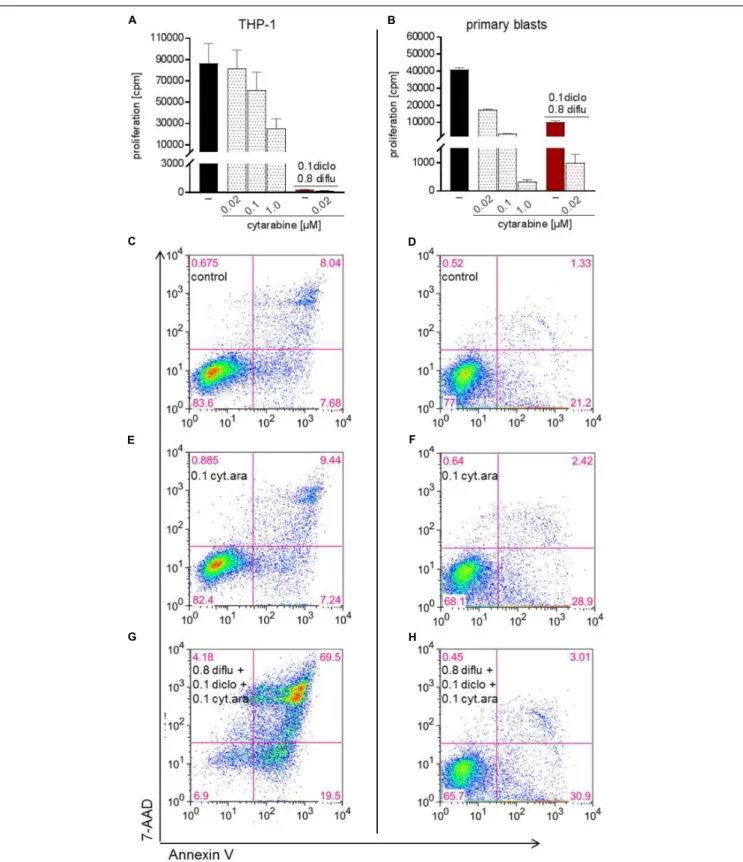
Metabolic Targeting in Combination With Metronomic Chemotherapy
Finally, we analyzed the impact of low dose standard
chemotherapy with cytarabine alone and in combination
with anti-metabolic treatment. In THP-1 cells and in primary
blasts, cytarabine dose-dependently inhibited proliferation and
the effect of cytarabine was more pronounced in primary blasts
(Figures 7A,B). Triple combination of diclofenac, diflunisal and
low dose cytarabine almost completely shut down proliferation
of primary blasts and THP-1 cells (Figures 7A,B). However,
low dose 0.02 and 0.1 µ M cytarabine had little impact on
apoptosis induction compared to untreated cells (data not
shown and Figures 7C–F). Combination of low dose 0.1 µ M
FIGURE 5 | Impact of metformin, diclofenac and diflunisal on apoptosis in THP-1 cells. For analysis of apoptosis, 3–5 × 10
5cells/mL medium were treated with (A)
single drugs or (B) combination of increasing concentrations of diflunisal (0.1–0.8 mM) plus 0.1 mM diclofenac or (C,E) triple combinations for 48 h. After treatment,
pictures were taken to document the morphology of (D) untreated or (E) treated cells; one representative experiment is shown. Cells were stained for Annexin-V-FITC
and 7-aminoactinomycin D (7-AAD) and analyzed by flow cytometry. Percentage of Annexin-V single positive cells (lower right quadrant), regarded as early apoptotic
cells, 7-AAD single positive cells (upper left quadrant), regarded as necrotic cells or Annexin V/7-AAD double positive cells (upper right quadrant), representing late
apoptotic cells, can be depicted either from scatter blots or histograms (D,E) Representative scatter blots and (F) histograms are presented. (A–C) data are shown
as mean ± SEM (n = 3),
∗P < 0.05,
∗∗P < 0.01, and
∗∗∗P < 0.001; significance was calculated by ANOVA and post hoc Holm-Sidak’s multiple comparisons test.
FIGURE 6 | Impact of metformin, diclofenac and diflunisal on apoptosis in primary AML blasts. For analysis of apoptosis, 3–5 × 10
5cells/mL medium were treated
with (A) single drugs or (B) combination of diflunisal (0.4 mM, 0.8 mM) plus 0.1 mM diclofenac or (C,E) triple combinations for 48 h. After treatment, pictures were
taken to document the morphology of (D) untreated or (E) treated cells; one representative experiment is shown. Then AML blasts were stained with Annexin-V-FITC
and 7-aminoactinomycin D (7-AAD) and analyzed by flow cytometry. Percentage of Annexin-V single positive cells (lower right quadrant), regarded as early apoptotic
cells, 7-AAD single positive cells (upper left quadrant), regarded as necrotic cells or Annexin V/7-AAD double positive cells (upper right quadrant), representing late
apoptotic cells, can be depicted either from scatter blots or histograms (D,E) Representative scatter blots and (F) histograms are presented. (A–C) data are shown
as mean ± SEM (n = 3),
∗P < 0.05; significance was calculated by ANOVA and post hoc Holm-Sidak’s multiple comparisons test.
FIGURE 7 | Impact of cytarabine in combination with diclofenac and diflunisal on proliferation and apoptosis in AML cells. To analyze effects on proliferation of (A) THP-1 or (B) primary blasts 3 × 10
4cells/0.2 mL medium were seeded in 96-well plates with indicated concentrations of cytarabine, diclofenac and diflunisal.
3